STANDARISASI STANDARITATION ADJUSTMENT PENYESUAIAN Pengertian Seperangkat teknis yang





- Slides: 32
STANDARISASI (STANDARITATION, ADJUSTMENT, PENYESUAIAN)
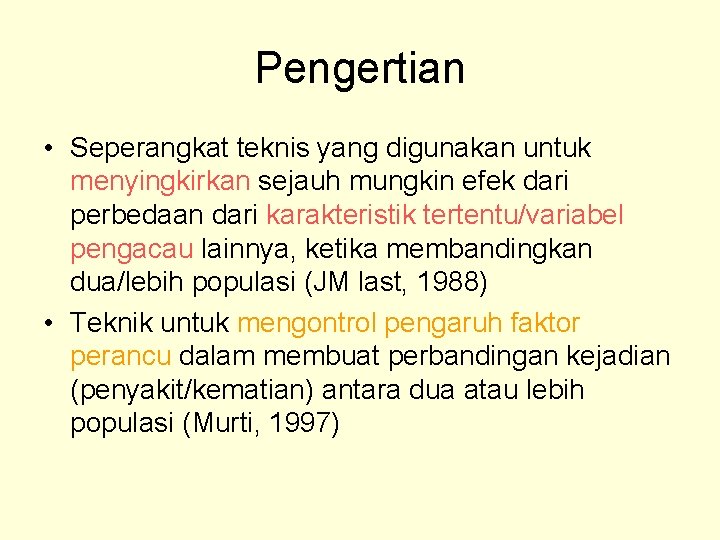
Pengertian • Seperangkat teknis yang digunakan untuk menyingkirkan sejauh mungkin efek dari perbedaan dari karakteristik tertentu/variabel pengacau lainnya, ketika membandingkan dua/lebih populasi (JM last, 1988) • Teknik untuk mengontrol pengaruh faktor perancu dalam membuat perbandingan kejadian (penyakit/kematian) antara dua atau lebih populasi (Murti, 1997)
Penggunaan • Bila variabel yang diteliti (mis. Penyakit/kematian) bervariasi menurut umur, jenis kelamin, ras atau faktor lainnya yang berhubungan erat dengan peristiwa tersebut • Bila proporsi penyebaran dari faktor tersebut di atas (umur, sex, dll) berbeda pada kedua kelompok penduduk yang ingin dibandingkan
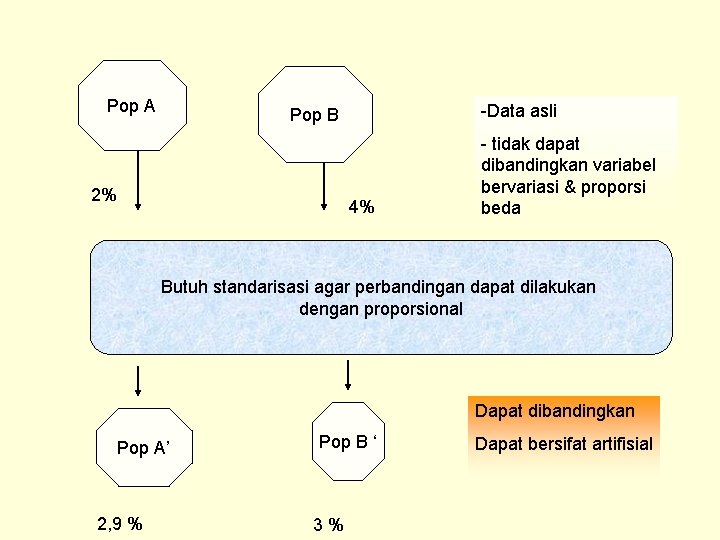
Pop A -Data asli Pop B 2% 4% - tidak dapat dibandingkan variabel bervariasi & proporsi beda Butuh standarisasi agar perbandingan dapat dilakukan dengan proporsional Dapat dibandingkan Pop A’ 2, 9 % Pop B ‘ 3% Dapat bersifat artifisial
TEKNIK STANDARISASI • Standarisasi Langsung (= penyesuaian langsung) Salah satu struktur populasi yang dibandingkan dipilih sebagai standar & dibagi dalam strata (kategori) faktor perancu (mis. Umur). Struktur populasi yang telah distratifikasi itu selanjutnya dipakai sebagai acuan dalam menghitung kejadian (penyakit / kematian) pada populasi lainnya
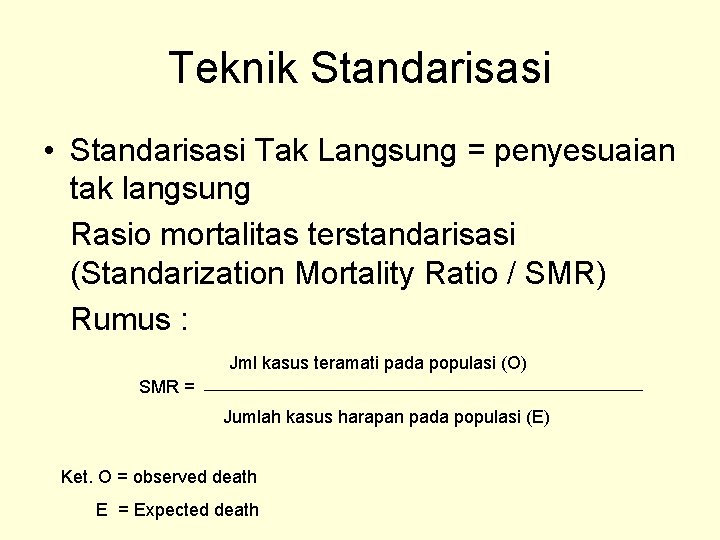
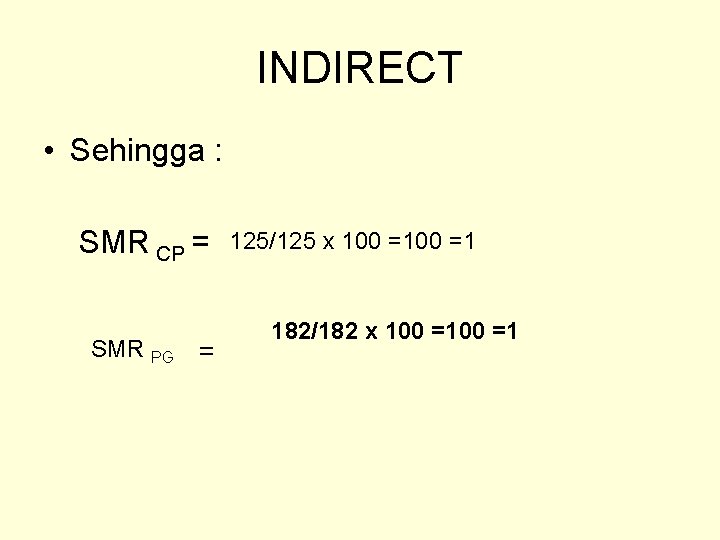
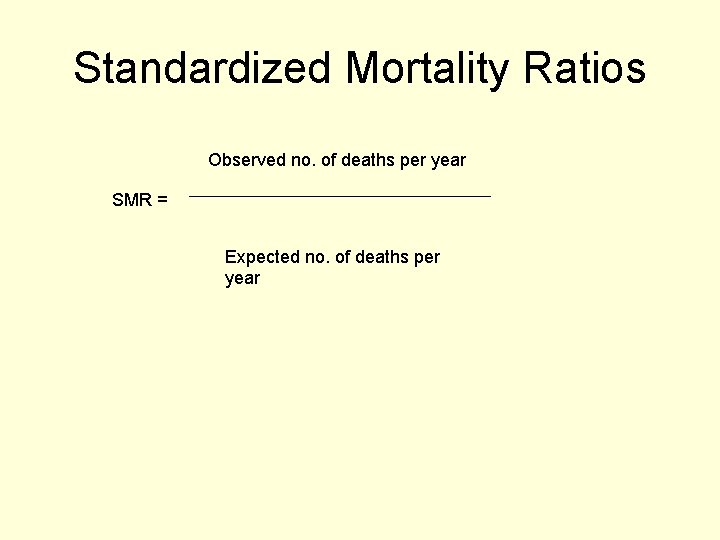
Teknik Standarisasi • Standarisasi Tak Langsung = penyesuaian tak langsung Rasio mortalitas terstandarisasi (Standarization Mortality Ratio / SMR) Rumus : Jml kasus teramati pada populasi (O) SMR = Jumlah kasus harapan pada populasi (E) Ket. O = observed death E = Expected death
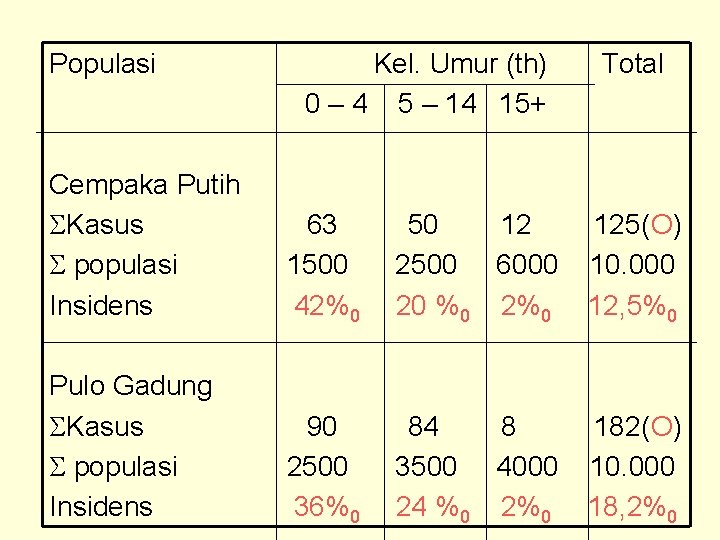
Populasi Kel. Umur (th) 0 – 4 5 – 14 15+ Total Cempaka Putih Kasus populasi Insidens 63 1500 42%0 50 12 2500 6000 20 %0 2%0 125(O) 10. 000 12, 5%0 Pulo Gadung Kasus populasi Insidens 90 2500 36%0 84 8 3500 4000 24 %0 2%0 182(O) 10. 000 18, 2%0
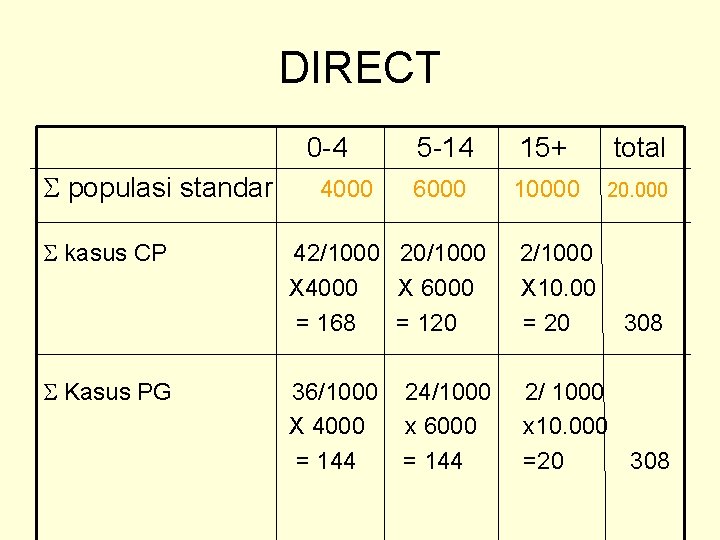
DIRECT 0 -4 populasi standar kasus CP Kasus PG 4000 5 -14 15+ total 6000 10000 20. 000 42/1000 20/1000 X 4000 X 6000 = 168 = 120 2/1000 X 10. 00 = 20 36/1000 X 4000 = 144 2/ 1000 x 10. 000 =20 308 24/1000 x 6000 = 144 308
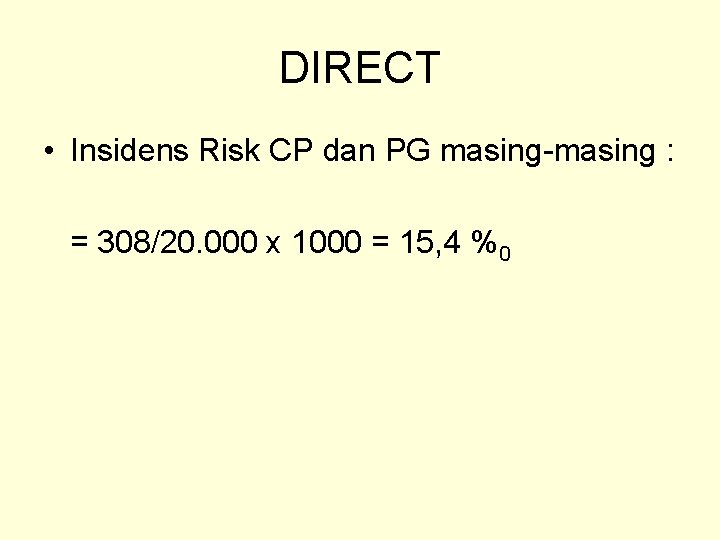
DIRECT • Insidens Risk CP dan PG masing-masing : = 308/20. 000 x 1000 = 15, 4 %0
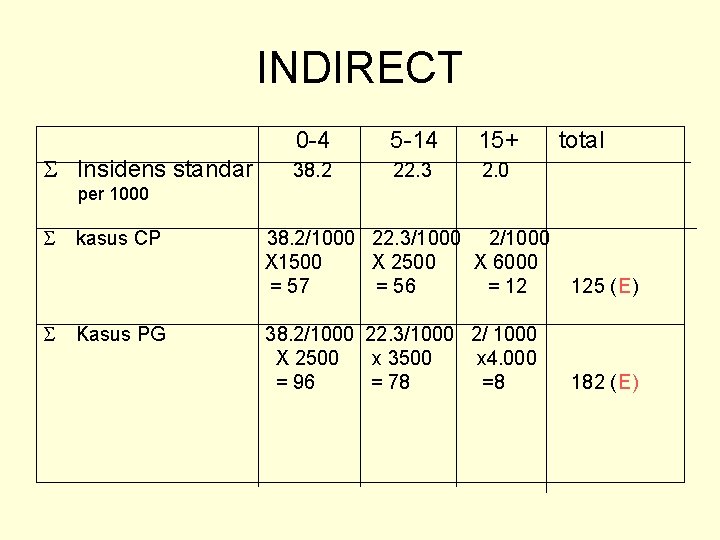
INDIRECT Insidens standar 0 -4 5 -14 15+ 38. 2 22. 3 2. 0 total per 1000 kasus CP Kasus PG 38. 2/1000 22. 3/1000 2/1000 X 1500 X 2500 X 6000 = 57 = 56 = 12 125 (E) 38. 2/1000 22. 3/1000 2/ 1000 X 2500 x 3500 x 4. 000 = 96 = 78 =8 182 (E)
INDIRECT • Sehingga : SMR CP = SMR PG = 125/125 x 100 =1 182/182 x 100 =1
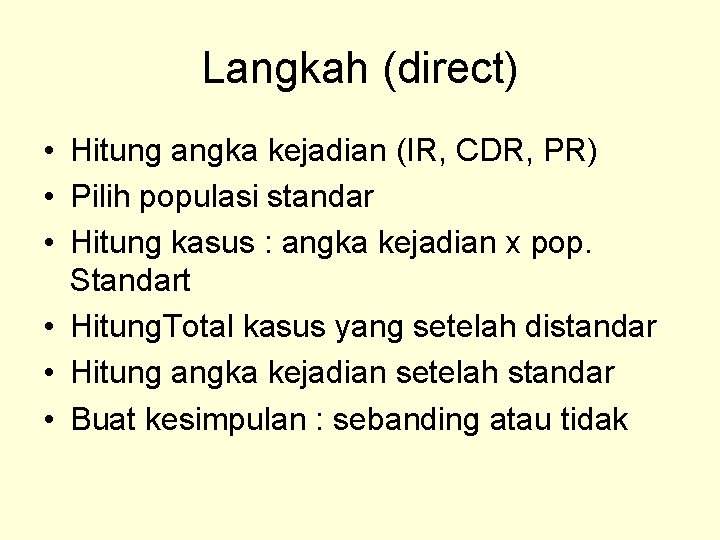
Langkah (direct) • Hitung angka kejadian (IR, CDR, PR) • Pilih populasi standar • Hitung kasus : angka kejadian x pop. Standart • Hitung. Total kasus yang setelah distandar • Hitung angka kejadian setelah standar • Buat kesimpulan : sebanding atau tidak
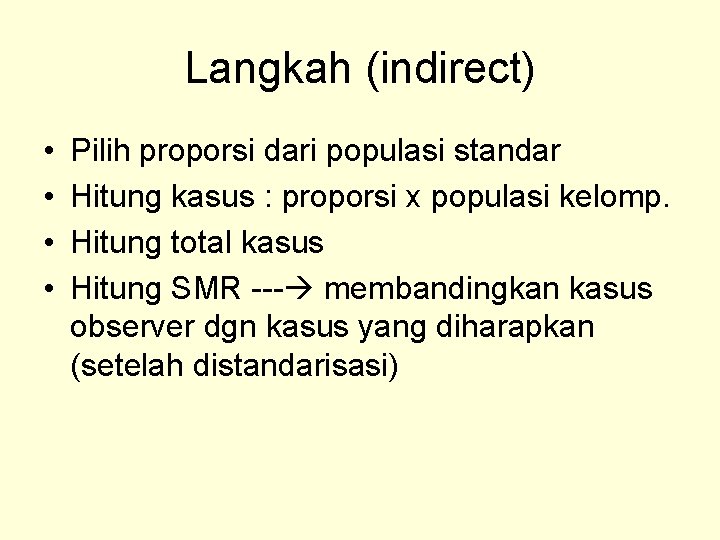
Langkah (indirect) • • Pilih proporsi dari populasi standar Hitung kasus : proporsi x populasi kelomp. Hitung total kasus Hitung SMR --- membandingkan kasus observer dgn kasus yang diharapkan (setelah distandarisasi)
Membandingkan Kematian dalam populasi berbeda
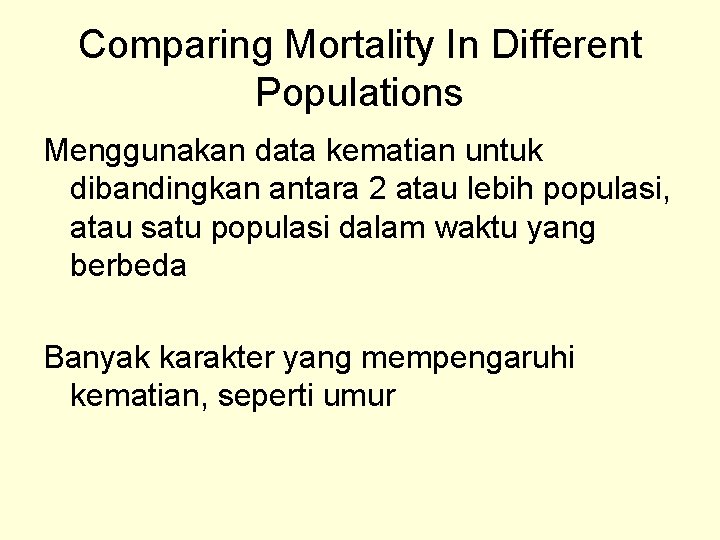
Comparing Mortality In Different Populations Menggunakan data kematian untuk dibandingkan antara 2 atau lebih populasi, atau satu populasi dalam waktu yang berbeda Banyak karakter yang mempengaruhi kematian, seperti umur
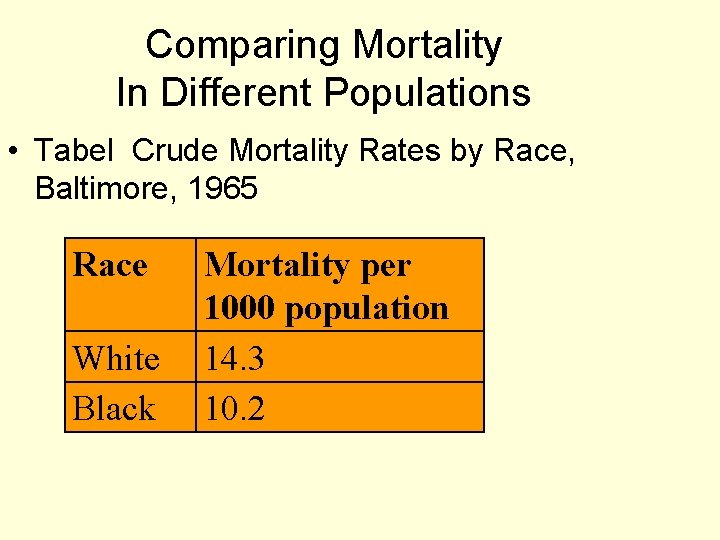
Comparing Mortality In Different Populations • Tabel Crude Mortality Rates by Race, Baltimore, 1965 Race White Black Mortality per 1000 population 14. 3 10. 2
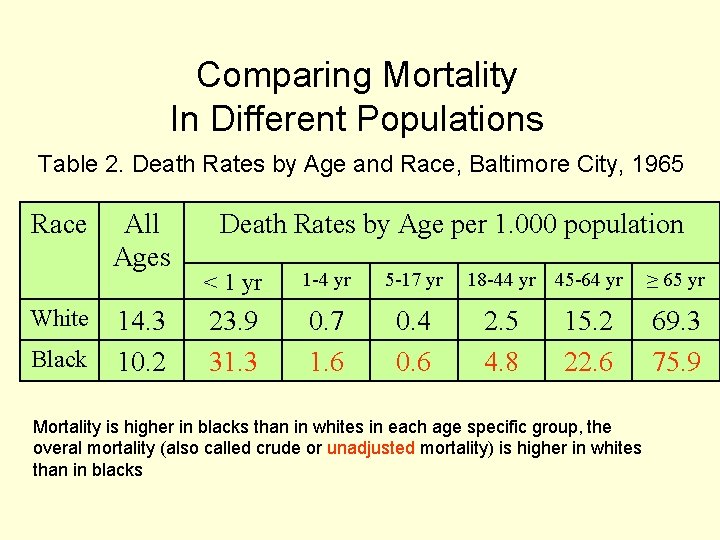
Comparing Mortality In Different Populations Table 2. Death Rates by Age and Race, Baltimore City, 1965 Race White Black All Ages 14. 3 10. 2 Death Rates by Age per 1. 000 population < 1 yr 1 -4 yr 5 -17 yr 23. 9 31. 3 0. 7 1. 6 0. 4 0. 6 18 -44 yr 45 -64 yr 2. 5 4. 8 15. 2 22. 6 Mortality is higher in blacks than in whites in each age specific group, the overal mortality (also called crude or unadjusted mortality) is higher in whites than in blacks ≥ 65 yr 69. 3 75. 9
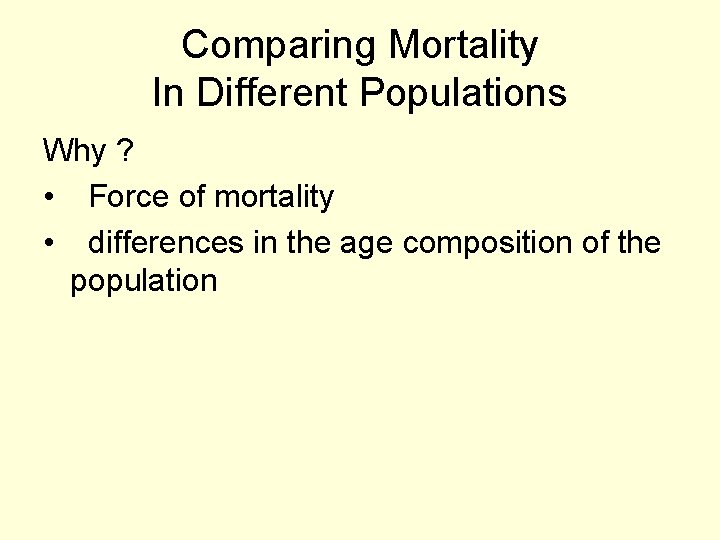
Comparing Mortality In Different Populations Why ? • Force of mortality • differences in the age composition of the population
Direct adjusment
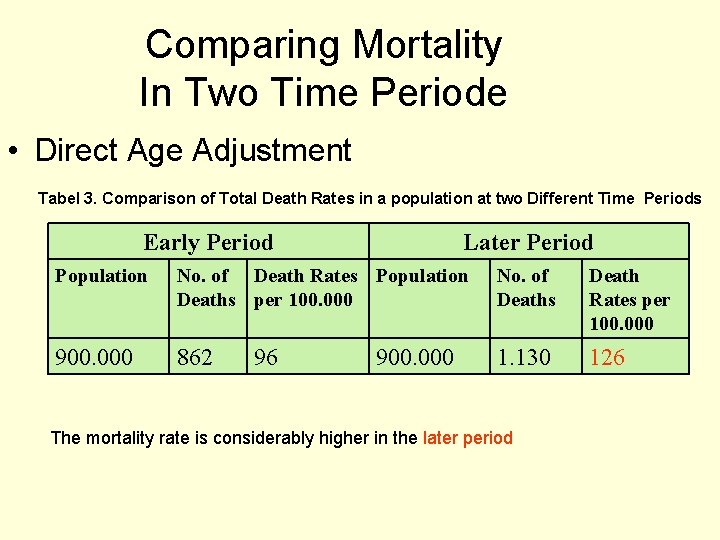
Comparing Mortality In Two Time Periode • Direct Age Adjustment Tabel 3. Comparison of Total Death Rates in a population at two Different Time Periods Early Period Later Period Population No. of Death Rates Population Deaths per 100. 000 No. of Deaths Death Rates per 100. 000 900. 000 862 1. 130 126 96 900. 000 The mortality rate is considerably higher in the later period
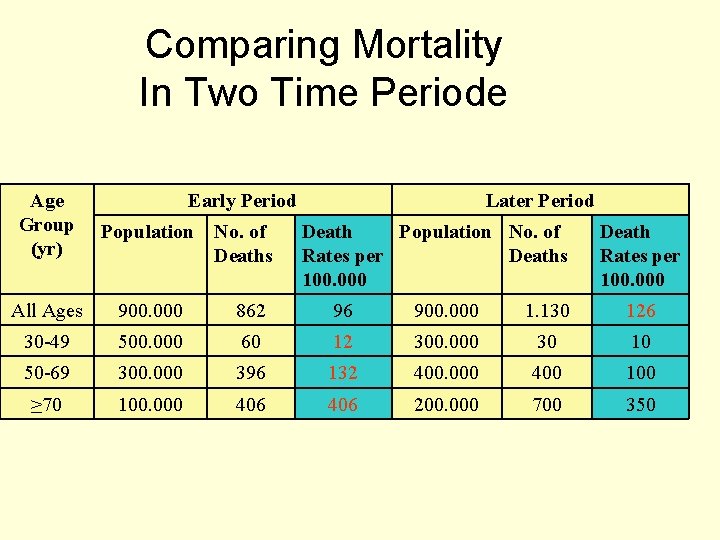
Comparing Mortality In Two Time Periode Age Group (yr) Early Period Population No. of Deaths Later Period Death Population No. of Rates per Deaths 100. 000 Death Rates per 100. 000 All Ages 900. 000 862 96 900. 000 1. 130 126 30 -49 500. 000 60 12 300. 000 30 10 50 -69 300. 000 396 132 400. 000 400 100 ≥ 70 100. 000 406 200. 000 700 350
Comparing Mortality In Two Time Periode • Bagaimana cara mengatasi ? ------- STANDARISASI
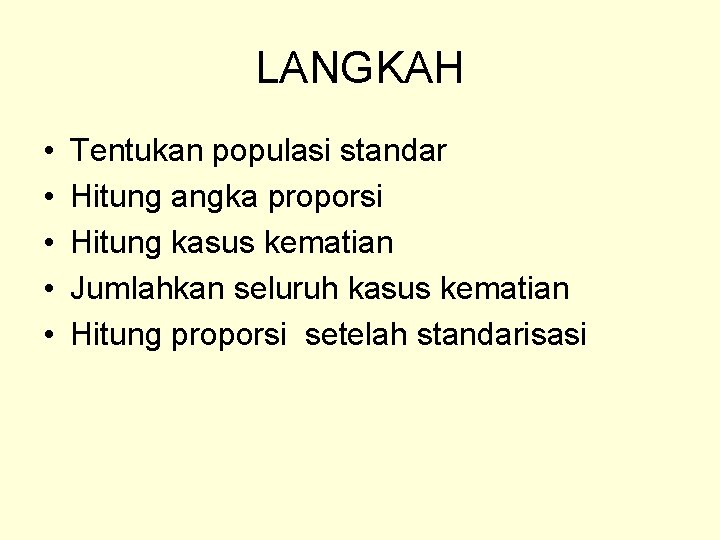
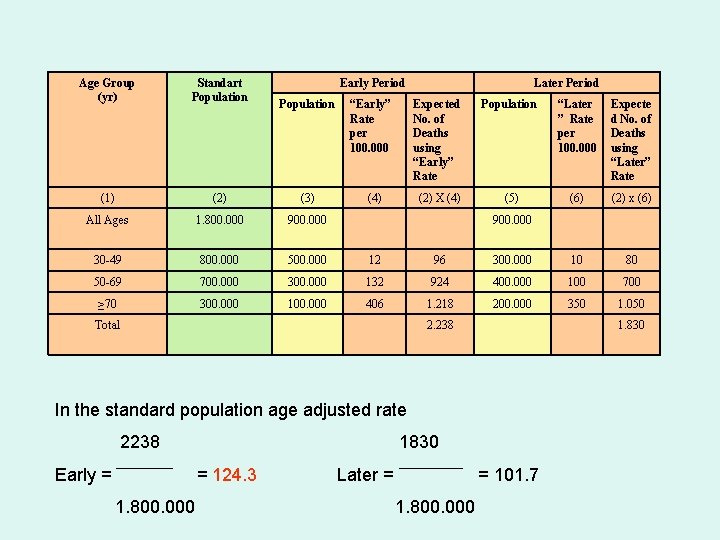
LANGKAH • • • Tentukan populasi standar Hitung angka proporsi Hitung kasus kematian Jumlahkan seluruh kasus kematian Hitung proporsi setelah standarisasi
Age Group (yr) Standart Population Early Period (1) (2) (3) All Ages 1. 800. 000 900. 000 30 -49 800. 000 500. 000 12 96 50 -69 700. 000 300. 000 132 ≥ 70 300. 000 100. 000 406 Population “Early” Rate per 100. 000 (4) Later Period Expected No. of Deaths using “Early” Rate Population “Later ” Rate per 100. 000 Expecte d No. of Deaths using “Later” Rate (2) X (4) (5) (6) (2) x (6) 300. 000 10 80 924 400. 000 100 700 1. 218 200. 000 350 1. 050 900. 000 Total 2. 238 1. 830 In the standard population age adjusted rate 2238 Early = 1830 = 124. 3 1. 800. 000 Later = = 101. 7 1. 800. 000
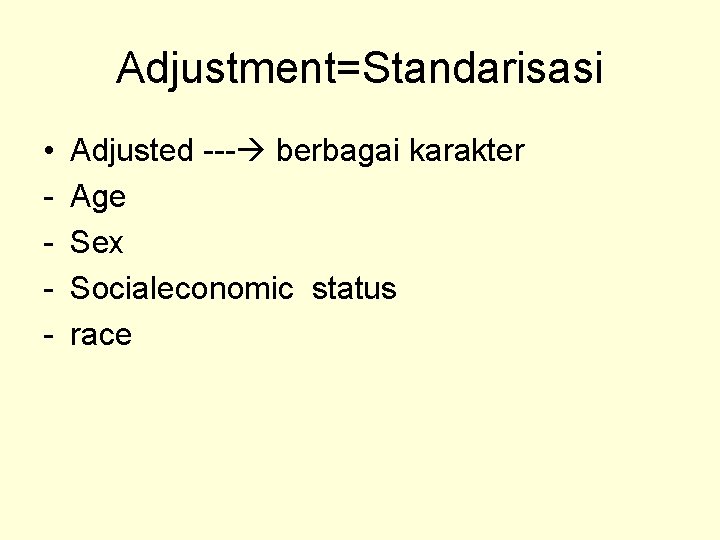
Adjustment=Standarisasi • - Adjusted --- berbagai karakter Age Sex Socialeconomic status race
Indirect adjustment
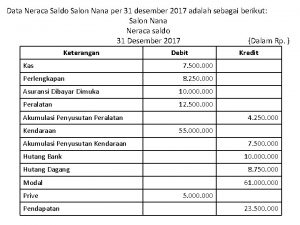
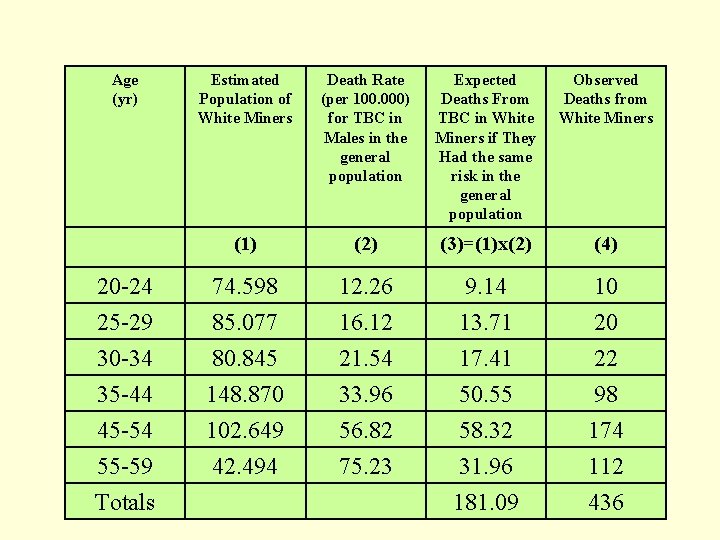
Age (yr) 20 -24 25 -29 30 -34 35 -44 45 -54 55 -59 Totals Estimated Population of White Miners Death Rate (per 100. 000) for TBC in Males in the general population Expected Deaths From TBC in White Miners if They Had the same risk in the general population Observed Deaths from White Miners (1) (2) (3)=(1)x(2) (4) 74. 598 85. 077 80. 845 148. 870 102. 649 42. 494 12. 26 16. 12 21. 54 33. 96 56. 82 75. 23 9. 14 13. 71 17. 41 50. 55 58. 32 31. 96 181. 09 10 20 22 98 174 112 436
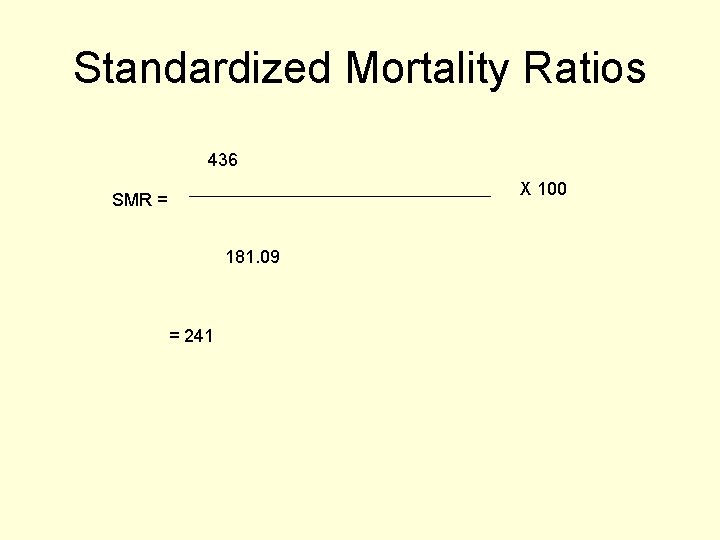
Standardized Mortality Ratios Observed no. of deaths per year SMR = Expected no. of deaths per year
Standardized Mortality Ratios 436 X 100 SMR = 181. 09 = 241
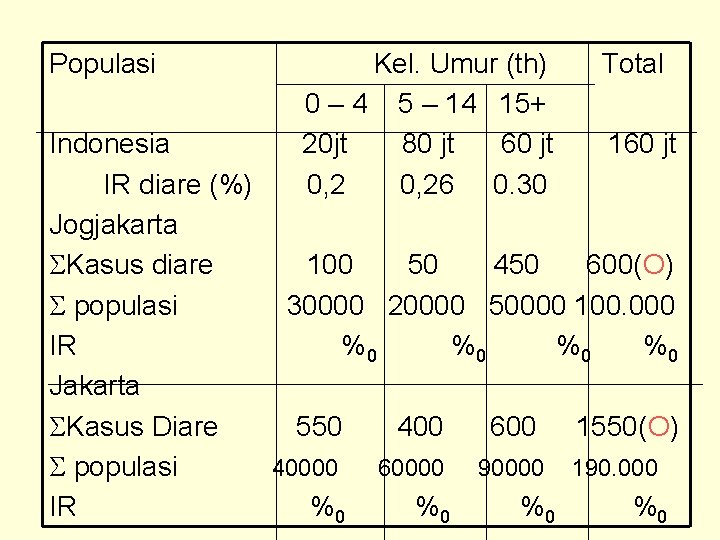
Latihan
Populasi Kel. Umur (th) 0 – 4 5 – 14 15+ 20 jt 80 jt 60 jt 0, 26 0. 30 Total Indonesia 160 jt IR diare (%) Jogjakarta Kasus diare 100 50 450 600(O) populasi 30000 20000 50000 100. 000 IR %0 %0 Jakarta Kasus Diare 550 400 600 1550(O) populasi 40000 60000 90000 190. 000 IR %0 %0