Soil Salinity Management Through Cropping Systems Chris Augustin




- Slides: 40
Soil Salinity Management Through Cropping Systems Chris Augustin Soil Health Area Extension Specialist (701)857 -7679 Chris. Augustin@ndsu. edu
Salinity, Sodicity, Alkalinity? ? ? Normal Soil Saline Soil Sodic Soil Saline-Sodic Soil EC < 4 d. S/m EC > 4 d. S/m SAR < 13 SAR > 13 p. H < 8. 5 p. H > 8. 5
Salts Make Plants Think They are in a Drought Photo Courtesy of Naeem Kalwar
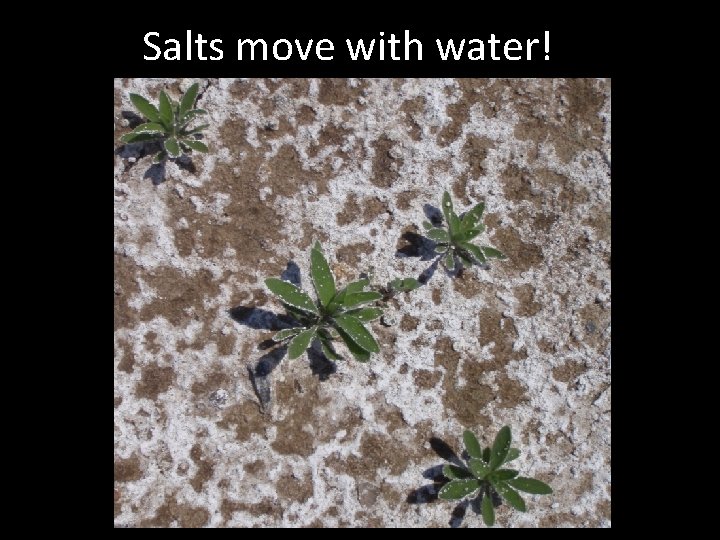
Salts move with water!
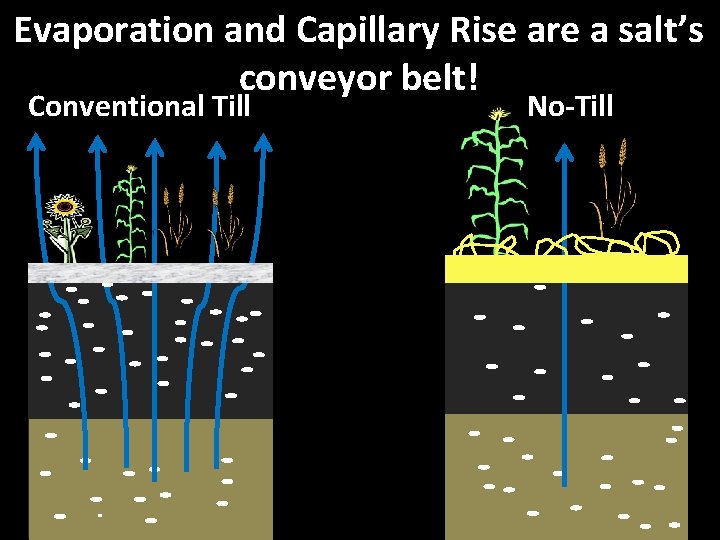
Evaporation and Capillary Rise are a salt’s conveyor belt! Conventional Till No-Till
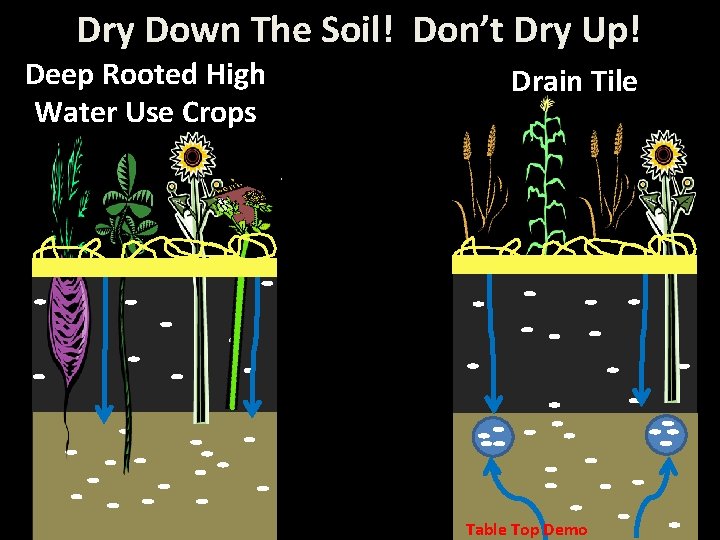
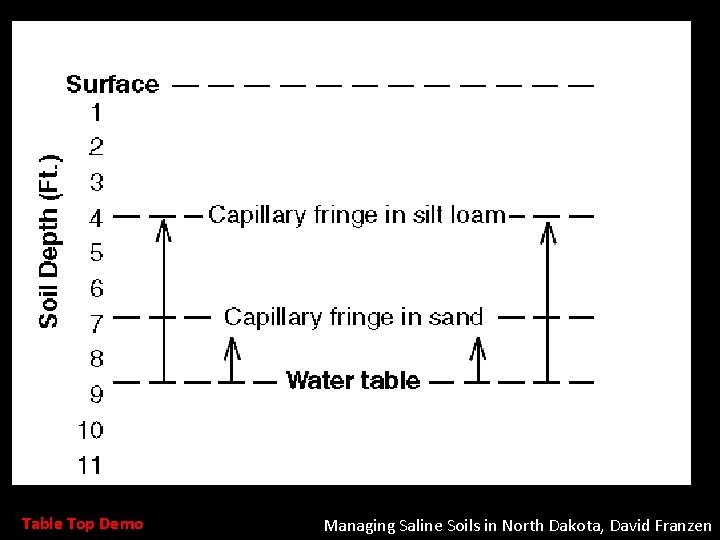
Dry Down The Soil! Don’t Dry Up! Deep Rooted High Water Use Crops Drain Tile Table Top Demo
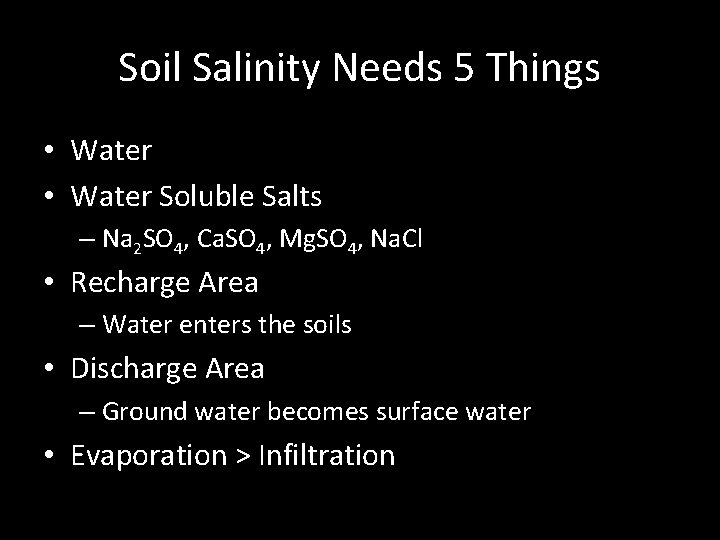
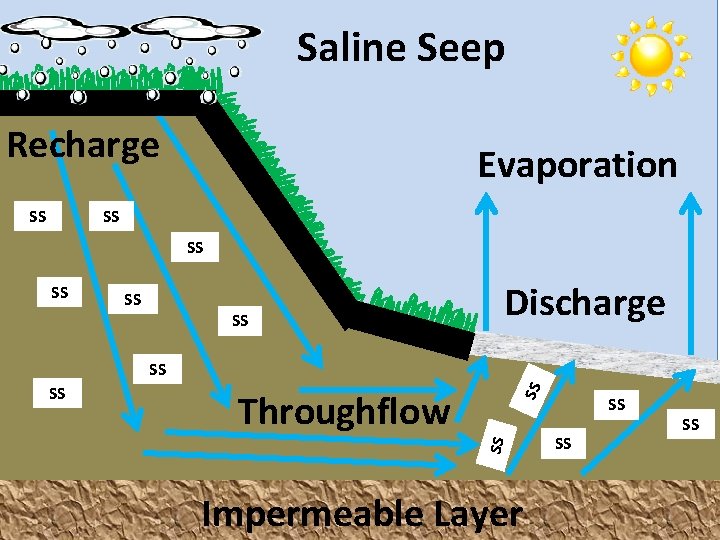
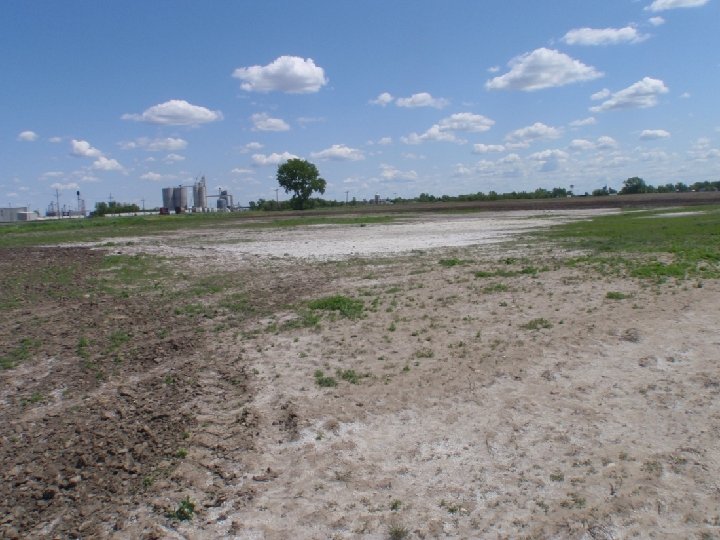
Soil Salinity Needs 5 Things • Water Soluble Salts – Na 2 SO 4, Ca. SO 4, Mg. SO 4, Na. Cl • Recharge Area – Water enters the soils • Discharge Area – Ground water becomes surface water • Evaporation > Infiltration
Saline Seep Recharge SS Evaporation SS SS SS Discharge Throughflow SS SS Impermeable Layer SS SS SS
Table Top Demo Managing Saline Soils in North Dakota, David Franzen
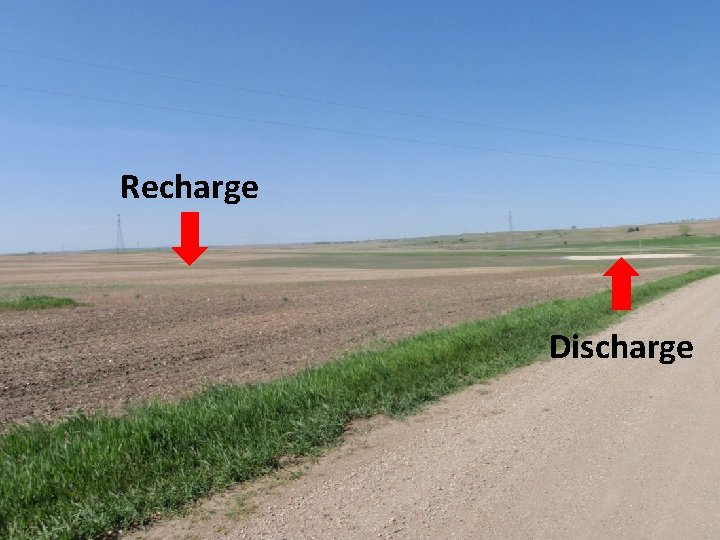
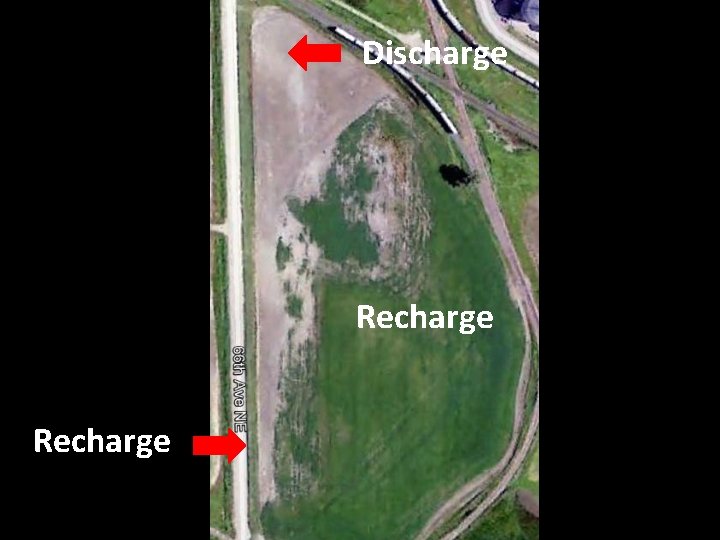
Recharge Discharge
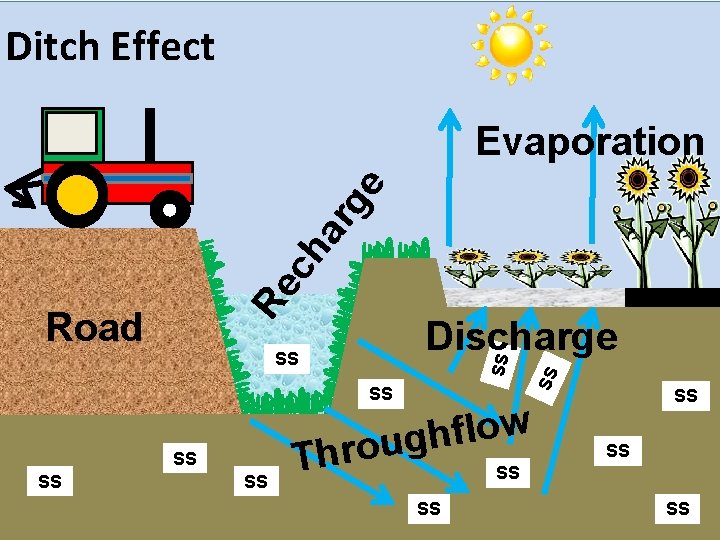
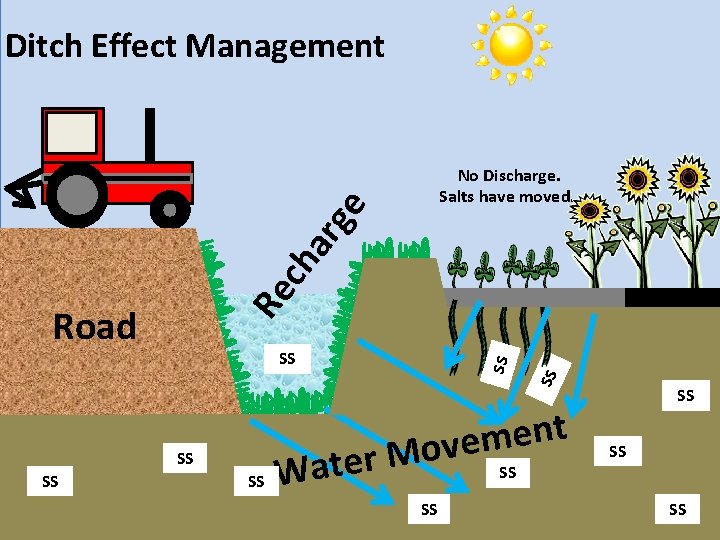
Ditch Effect Re ch ar ge Evaporation SS SS SS w o l f h hroug T SS SS Discharge SS Road SS SS SS
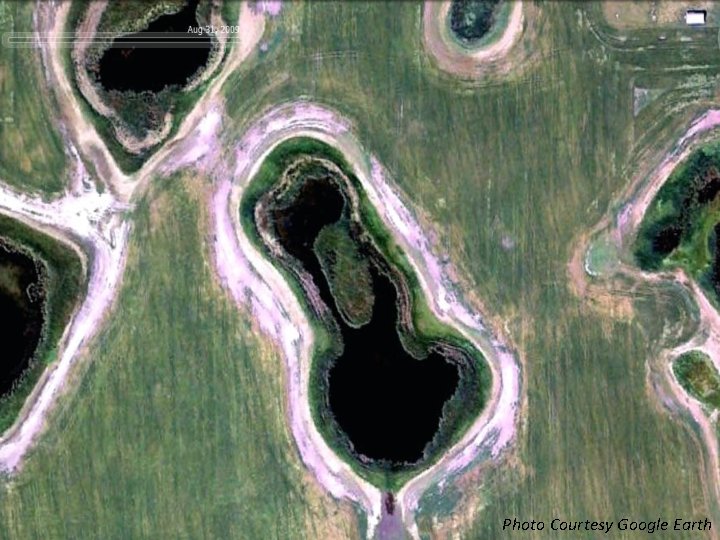
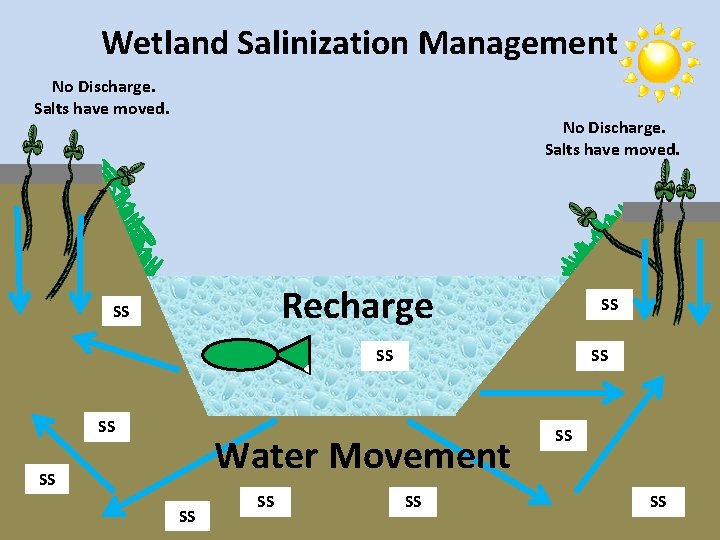
Wetland Salinization Evaporation Recharge SS SS SS Water Movement SS SS SS
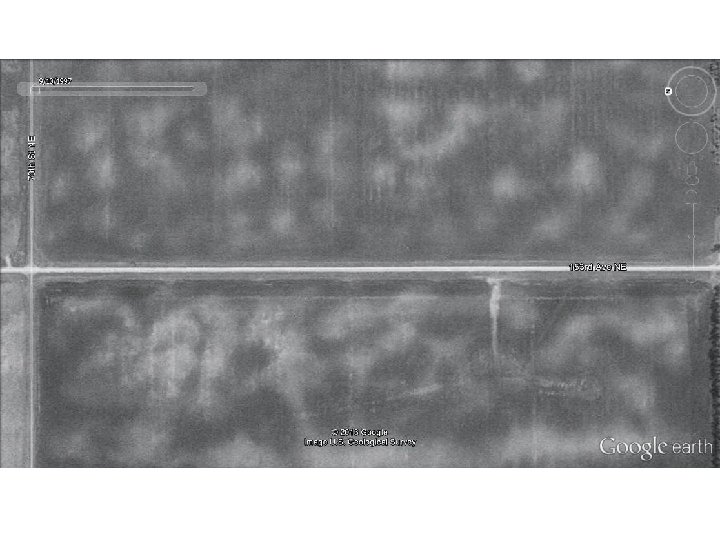
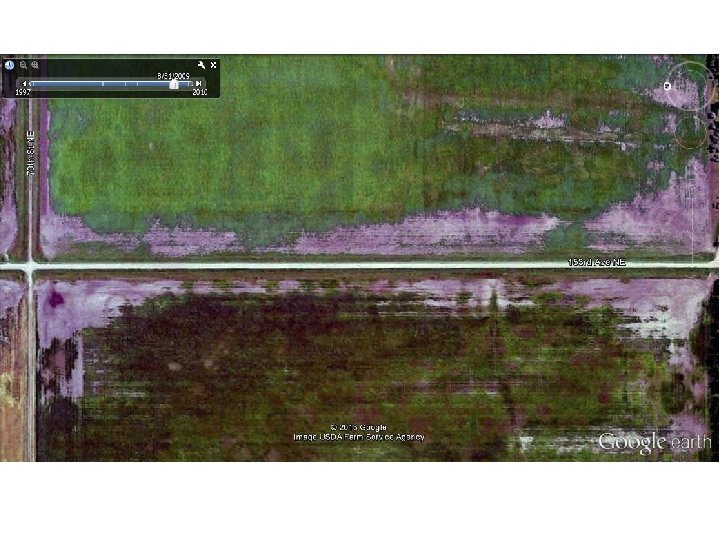
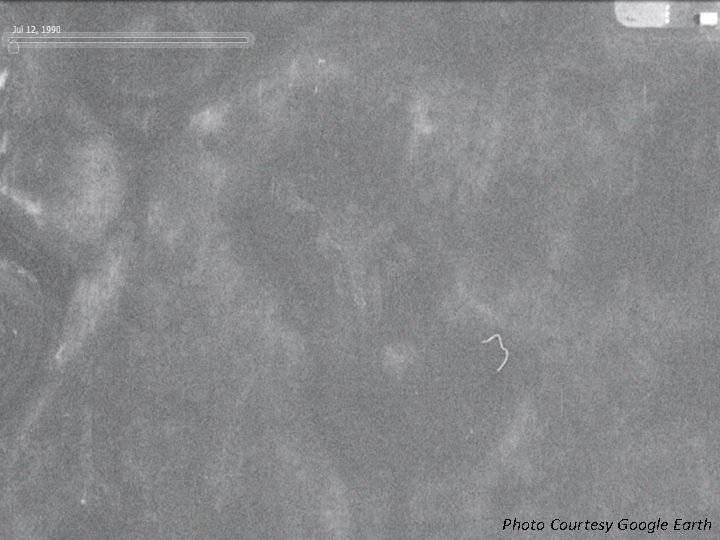
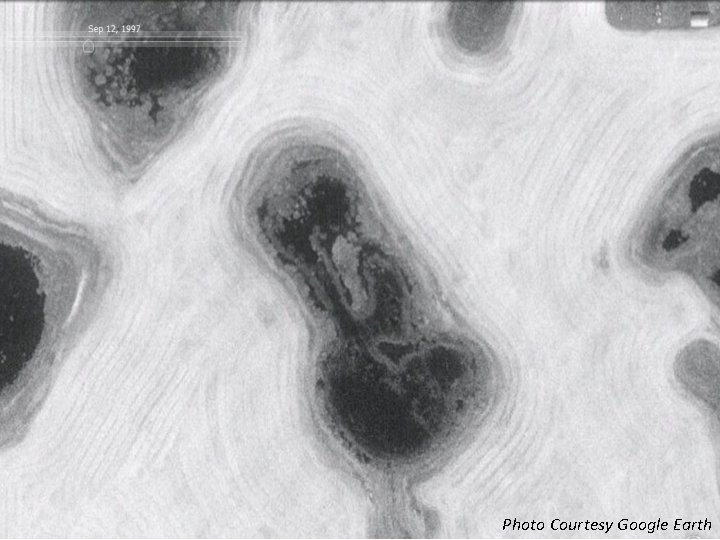
Photo Courtesy Google Earth
Photo Courtesy Google Earth
Photo Courtesy Google Earth
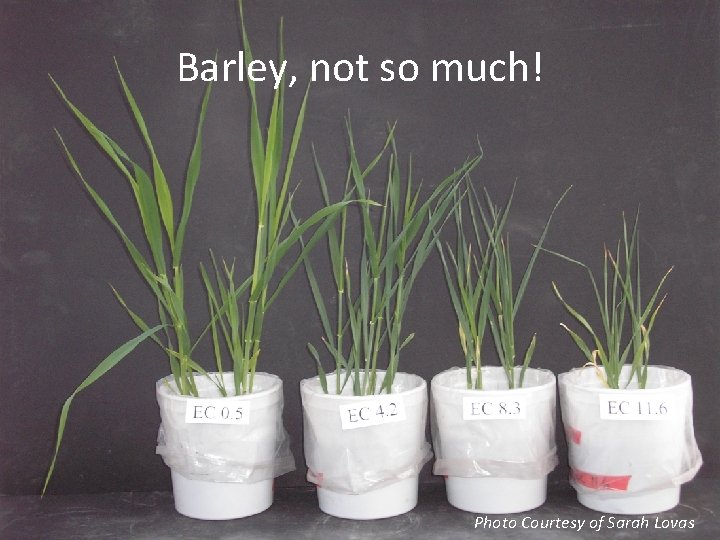
Soybeans HATE SALT!!! Photo Courtesy of Sarah Lovas
Barley, not so much! Photo Courtesy of Sarah Lovas
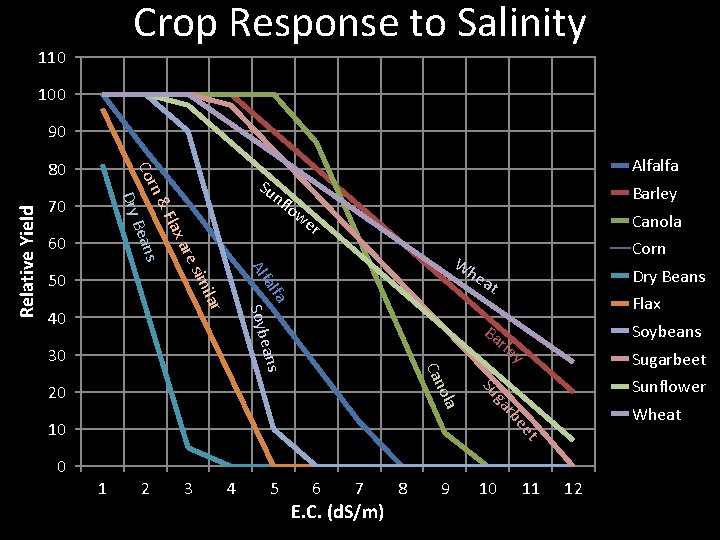
Crop Response to Salinity 110 100 90 nf imi re s xa Fla n& ns Bea 70 60 er Canola ea Flax Ba Soybeans Su 9 10 Sugarbeet Sunflower ga ola Can eans rle y 20 Wheat e rb et 10 0 Dry Beans t a Soyb 30 Corn Wh alf lar 40 Barley low Alf 50 Alfalfa Su Dry Relative Yield Cor 80 1 2 3 4 5 6 7 E. C. (d. S/m) 8 11 12
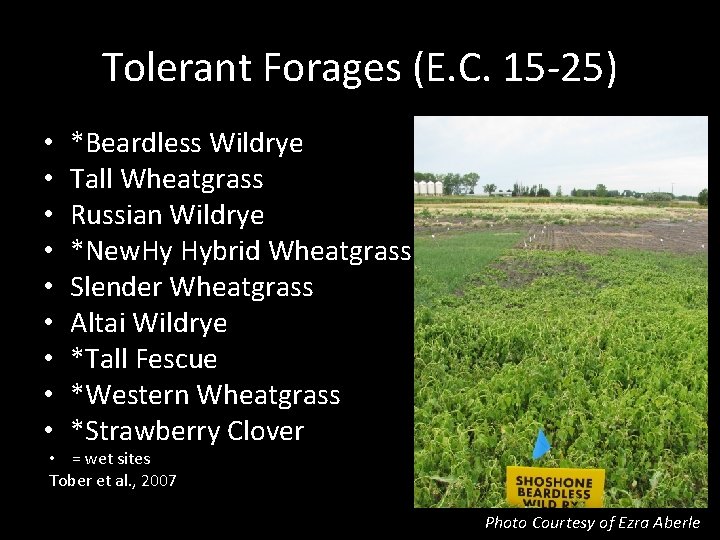
Tolerant Forages (E. C. 15 -25) • • • *Beardless Wildrye Tall Wheatgrass Russian Wildrye *New. Hy Hybrid Wheatgrass Slender Wheatgrass Altai Wildrye *Tall Fescue *Western Wheatgrass *Strawberry Clover • = wet sites Tober et al. , 2007 Photo Courtesy of Ezra Aberle
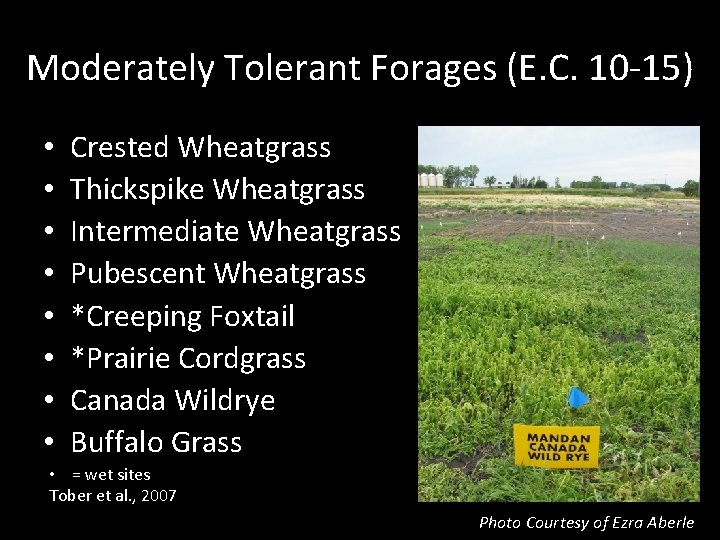
Moderately Tolerant Forages (E. C. 10 -15) • • Crested Wheatgrass Thickspike Wheatgrass Intermediate Wheatgrass Pubescent Wheatgrass *Creeping Foxtail *Prairie Cordgrass Canada Wildrye Buffalo Grass • = wet sites Tober et al. , 2007 Photo Courtesy of Ezra Aberle
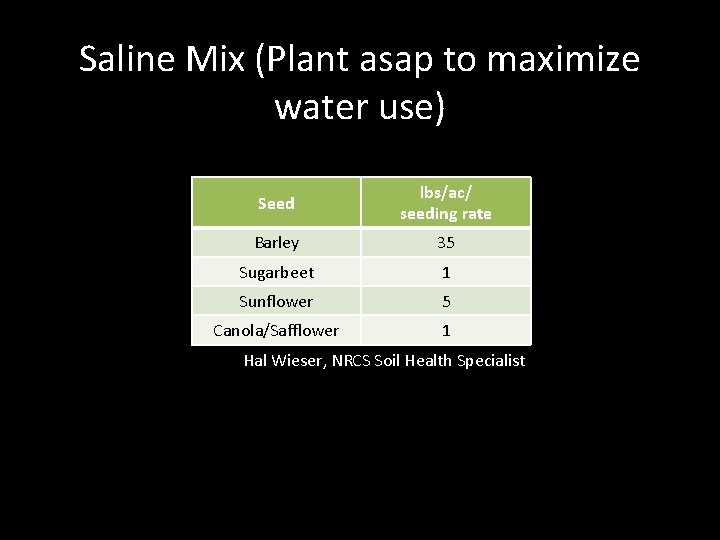
Saline Mix (Plant asap to maximize water use) Seed lbs/ac/ seeding rate Barley 35 Sugarbeet 1 Sunflower 5 Canola/Safflower 1 Hal Wieser, NRCS Soil Health Specialist
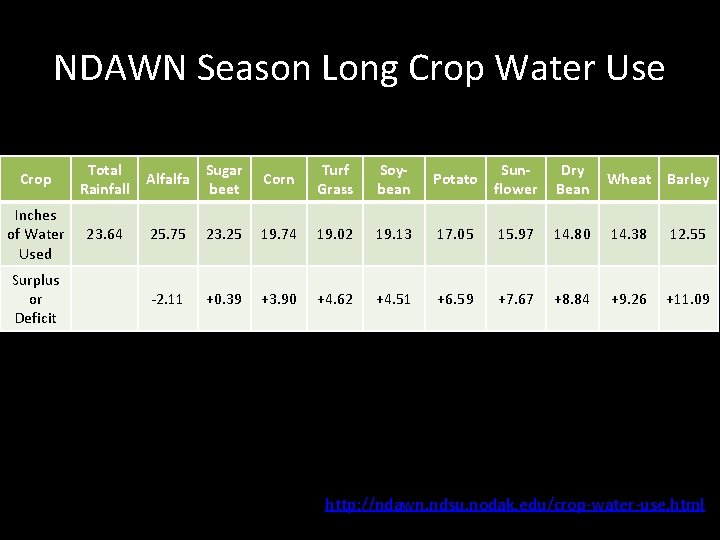
NDAWN Season Long Crop Water Use Crop Total Rainfall Alfalfa Sugar beet Corn Turf Grass Soybean Potato Sunflower Dry Bean Wheat Barley Inches of Water Used 23. 64 25. 75 23. 25 19. 74 19. 02 19. 13 17. 05 15. 97 14. 80 14. 38 12. 55 -2. 11 +0. 39 +3. 90 +4. 62 +4. 51 +6. 59 +7. 67 +8. 84 +9. 26 +11. 09 Surplus or Deficit Water use was from May 1 – Oct 15, 2013 at Oaks NDAWN http: //ndawn. ndsu. nodak. edu/crop-water-use. html
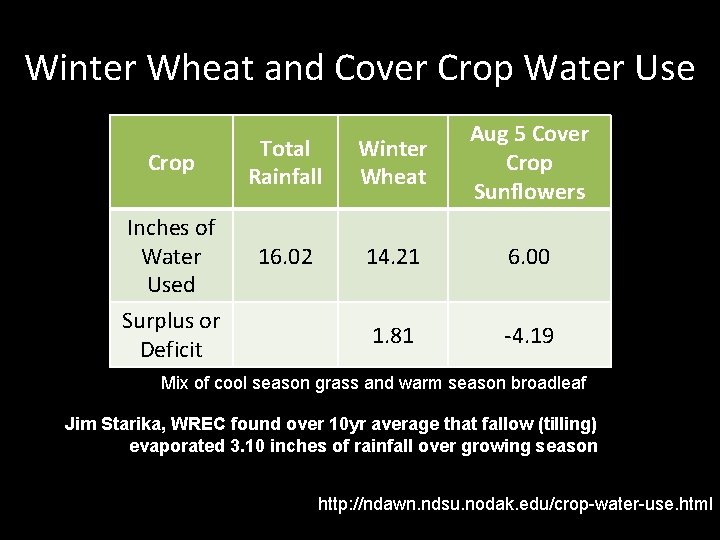
Winter Wheat and Cover Crop Water Use Crop Inches of Water Used Surplus or Deficit Total Rainfall Winter Wheat Aug 5 Cover Crop Sunflowers 16. 02 14. 21 6. 00 1. 81 -4. 19 Mix of cool season grass and warm season broadleaf Jim Starika, WREC found over 10 yr average that fallow (tilling) evaporated 3. 10 inches of rainfall over growing season http: //ndawn. ndsu. nodak. edu/crop-water-use. html
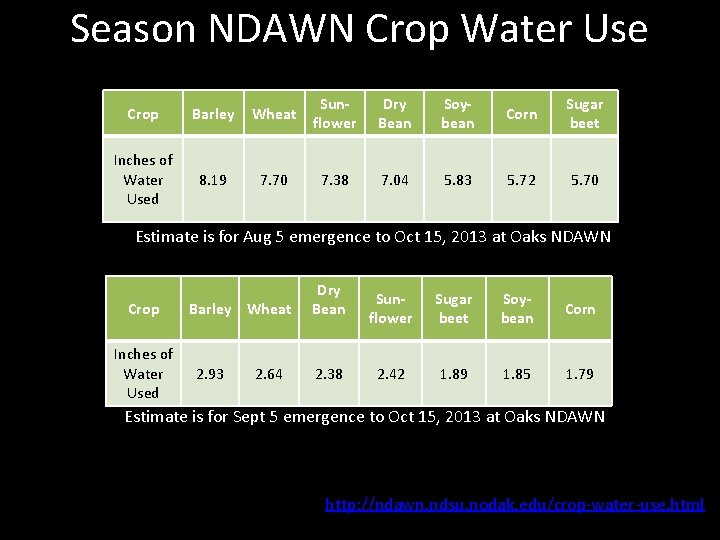
Season NDAWN Crop Water Use Crop Barley Wheat Sunflower Dry Bean Soybean Corn Sugar beet Inches of Water Used 8. 19 7. 70 7. 38 7. 04 5. 83 5. 72 5. 70 Estimate is for Aug 5 emergence to Oct 15, 2013 at Oaks NDAWN Crop Inches of Water Used Barley Wheat 2. 93 2. 64 Dry Bean 2. 38 Sunflower Sugar beet Soybean Corn 2. 42 1. 89 1. 85 1. 79 Estimate is for Sept 5 emergence to Oct 15, 2013 at Oaks NDAWN http: //ndawn. ndsu. nodak. edu/crop-water-use. html
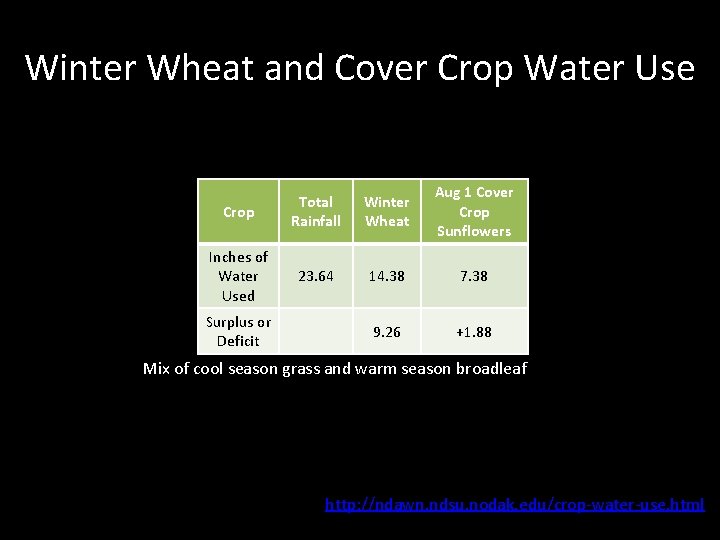
Winter Wheat and Cover Crop Water Use Crop Total Rainfall Winter Wheat Aug 1 Cover Crop Sunflowers Inches of Water Used 23. 64 14. 38 7. 38 9. 26 +1. 88 Surplus or Deficit Mix of cool season grass and warm season broadleaf http: //ndawn. ndsu. nodak. edu/crop-water-use. html
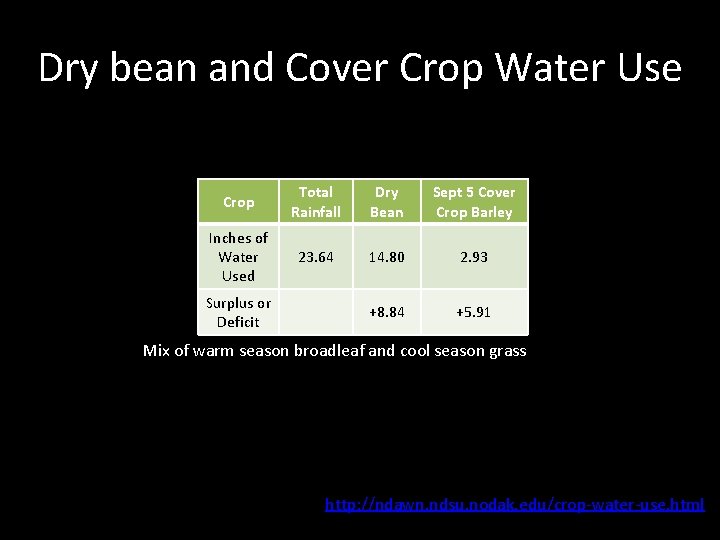
Dry bean and Cover Crop Water Use Crop Total Rainfall Dry Bean Sept 5 Cover Crop Barley Inches of Water Used 23. 64 14. 80 2. 93 +8. 84 +5. 91 Surplus or Deficit Mix of warm season broadleaf and cool season grass http: //ndawn. ndsu. nodak. edu/crop-water-use. html
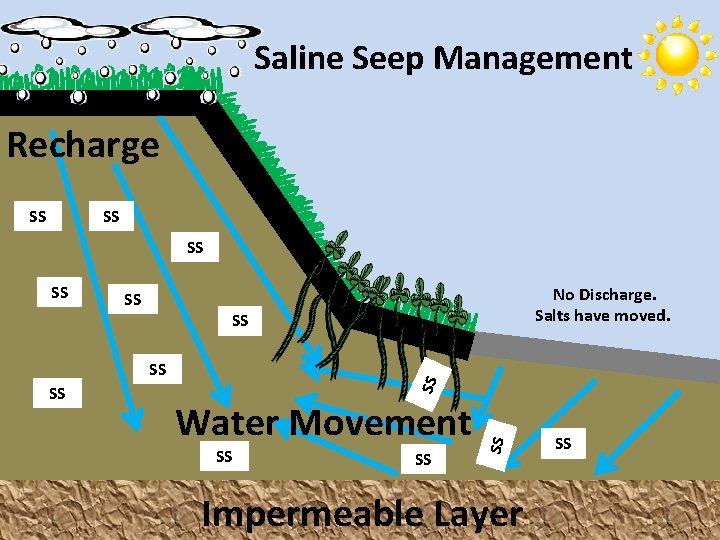
Saline Seep Management Recharge SS SS No Discharge. Salts have moved. Water Movement SS SS Impermeable Layer SS
Ditch Effect Management SS SS SS Road SS Re ch ar g e No Discharge. Salts have moved. t n e m e v o M r e t SS a SS W SS SS
Wetland Salinization Management No Discharge. Salts have moved. Recharge SS SS SS Water Movement SS SS SS
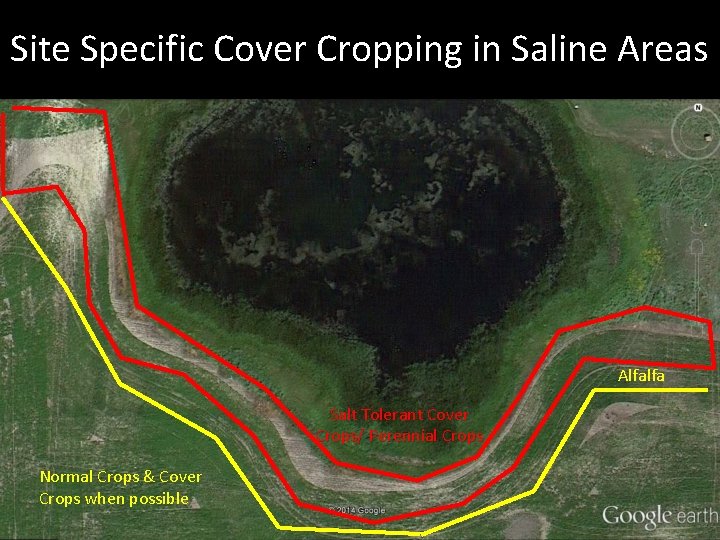
Site Specific Cover Cropping in Saline Areas Alfalfa Salt Tolerant Cover Crops/ Perennial Crops Normal Crops & Cover Crops when possible
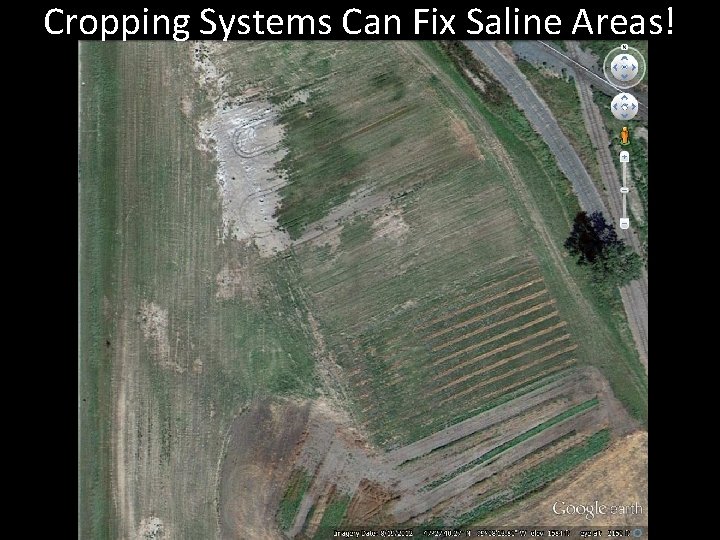
Cropping Systems Can Fix Saline Areas!
Discharge Recharge
Summary • Salinity is caused by excessive water that brings salts into the root zone • Salinity management is water management • Salts move up with water and down with water • Think about landscapes • Tillage and crops manage water. • However, evaporation can make your soils more prone to salinization, erosion, and loose O. M. • Crops utilize more water than tillage and have greater benefits for the soil. • Stay on top of your E. C.
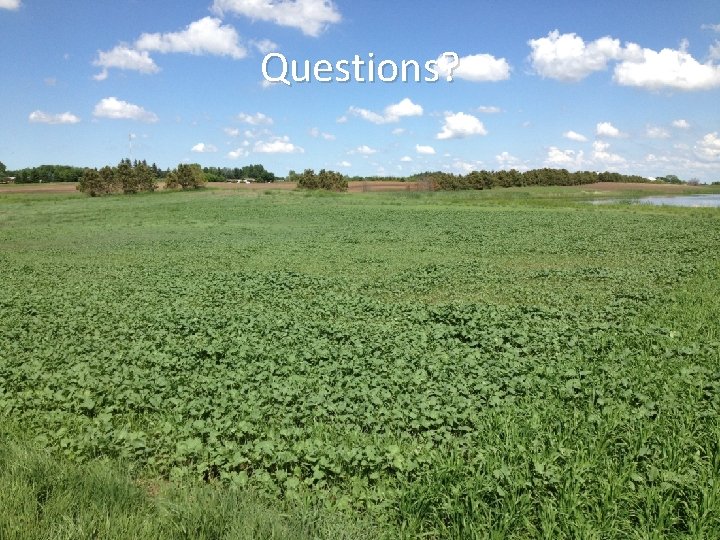
Questions?
Works Cited • Aberle, E. 2011. Cover Crops CREC Research Review. Carrington Research Extension Center, Carrington, ND. • American Society of Agronomy. 2009. Cover Crops in Crops and Soils. Am. Soc. Agron. 42: 6. • Blanco-Canqui, H. , J. D. Holman, A. J. Schlegel, J. Tatarko, and T. M. Shaver. 2013. Replacing fallow with cover crops in semiarid soil: Effects of soil properties. Soil Sci. Soc. Am. J. 77: 1026 -1034. • Bundy, L. G. and T. W. Andraski. 2005. Recovery of fertilizer nitrogen in crop residues and cover crops on an irrigated sandy soil. Soil Sci. Soc. Am. J. 69: 640 -648. • Chen, G. and R. R. Weil. 2011. Root growth and yield of maize as affected by soil compaction and cover crops. Soil and Tillage Research. 117: 17 -27. • Dragseth, K. , C. Hill, and J. Staricka. 2009. WREC cover crop study. NDSUWREC/MSU-EARC 2009 Agricultural Research Update. Williston Research Extension Center, Williston, ND. • Folorunso, O. A. , D. E. Rolston, T. Prichard, and D. T. Loui. 1992. Soil surface strength and infiltration rate as affected by winter cover crops. Soil Technology. 5: 189 -197. • North Dakota Agricultural Weather Network. 2014. Crop water use calculator. Online [http: //ndawn. ndsu. nodak. edu/crop-water-use. html]. Verified Dec. 16, 2014. North Dakota State University. Fargo, ND. • Staricka. J. 2011. Plant crops to dry out excessively wet fields. WREC Report. Williston Research Extension Center, Williston, ND. • Tober, D. , W. Duckwitz, and S. Sieler. 2007. Plant materials for salt-affected sites in the Northern Great Plains. USDA-NRCS Plant Materials Center, Bismarck, ND. • White and Weil. 2009. Plant and soil.