Saving Energy in Cotton Gins Paul A Funk
- Slides: 50
Saving Energy in Cotton Gins Paul A. Funk, Robert G. Hardin IV, and Albert A. Terrazas
Energy costs represent 20% of the total cost of post-harvest processing. A national industry survey indicated: • Electricity cost varied from $1. 62 to $21. 58 • Fuel costs from $0. 23 to $9. 07 per bale
Energy costs represent 20% of the total cost of ginning; a national industry survey indicated: • Electricity cost varied from $1. 62 to $21. 58 • Fuel costs from $0. 23 to $9. 07 per bale • Huge disparities = huge opportunities!
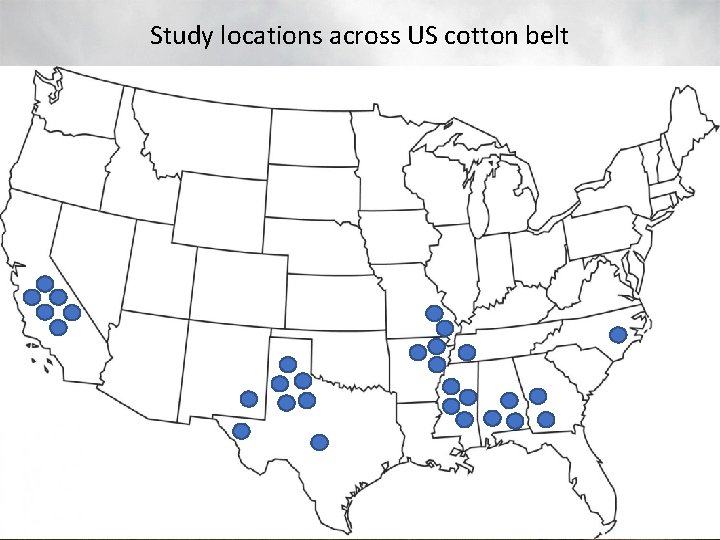
Study locations across US cotton belt
Energy • Two types: electricity (2009 -2011) and fuel (2016 -2018) • Two tools: audits and monitoring studies
Energy Audits • An audit is a snapshot – one moment in time • An audit quantifies energy consumption • Resolution depends on sample size • Typical cotton gin has ~120 motors and ~8 burners – we measured all • An audit asks, “What proportion is consumed by each subsystem? ” • Differences between facilities due to infrastructure
Energy Monitoring • A monitoring study is like a video • It records changes in energy consumption • Resolution depends on sampling rate • Monitoring asks, “What might be causing the change? ” • Differences with time due to operating parameters
Electricity: Rationale • Electricity is about 13% of the total cost of post harvest processing
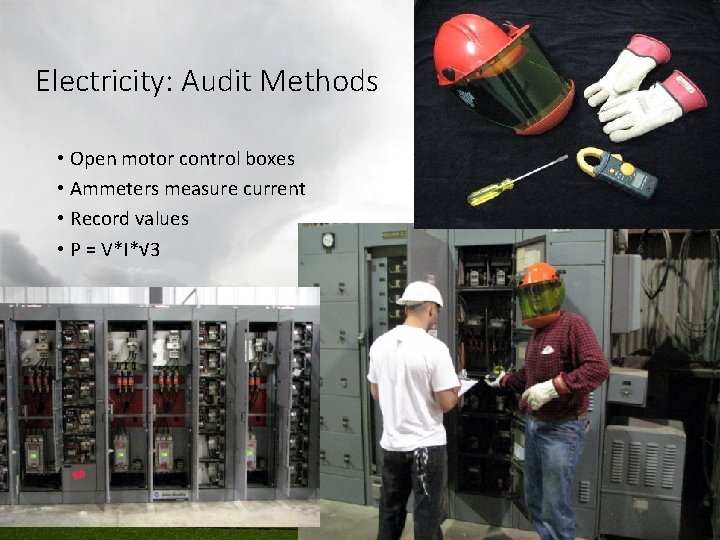
Electricity: Audit Methods • Open motor control boxes • Ammeters measure current • Record values • P = V*I*√ 3
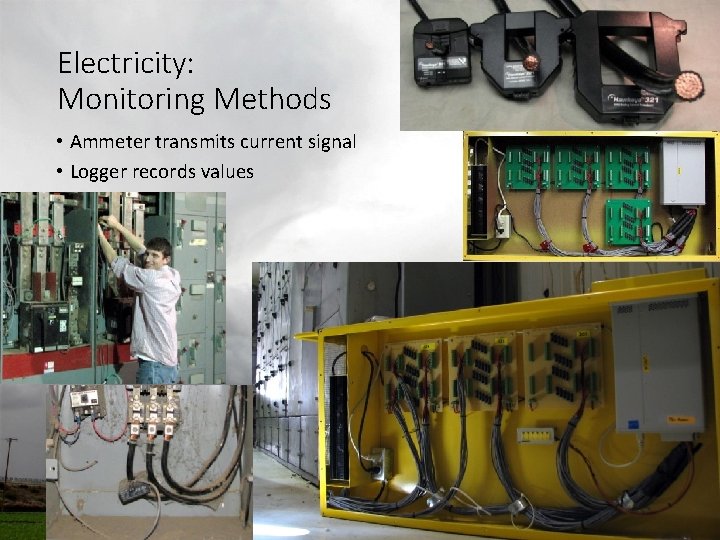
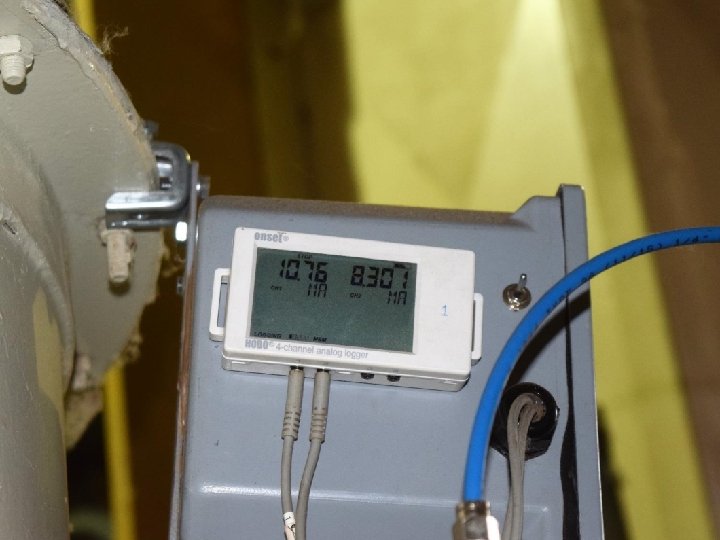
Electricity: Monitoring Methods • Ammeter transmits current signal • Logger records values
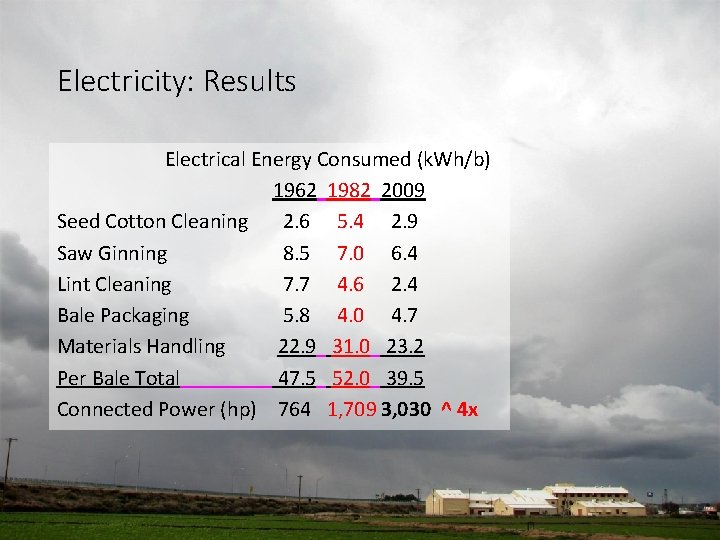
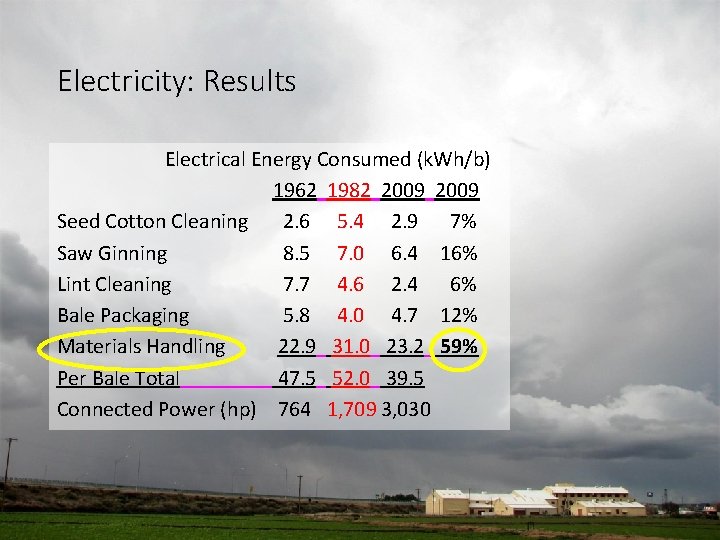
Electricity: Results Electrical Energy Consumed (k. Wh/b) 1962 1982 2009 Seed Cotton Cleaning 2. 6 5. 4 2. 9 Saw Ginning 8. 5 7. 0 6. 4 Lint Cleaning 7. 7 4. 6 2. 4 Bale Packaging 5. 8 4. 0 4. 7 Materials Handling 22. 9 31. 0 23. 2 Per Bale Total 47. 5 52. 0 39. 5 Connected Power (hp) 764 1, 709 3, 030 ^ 4 x
Electricity: Results Electrical Energy Consumed (k. Wh/b) 1962 1982 2009 Seed Cotton Cleaning 2. 6 5. 4 2. 9 7% Saw Ginning 8. 5 7. 0 6. 4 16% Lint Cleaning 7. 7 4. 6 2. 4 6% Bale Packaging 5. 8 4. 0 4. 7 12% Materials Handling 22. 9 31. 0 23. 2 59% Per Bale Total 47. 5 52. 0 39. 5 Connected Power (hp) 764 1, 709 3, 030
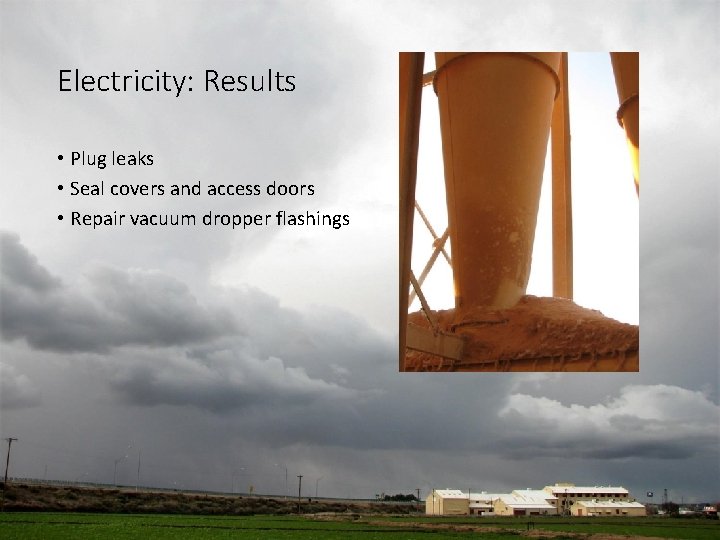
Electricity: Results • Plug leaks • Seal covers and access doors • Repair vacuum dropper flashings
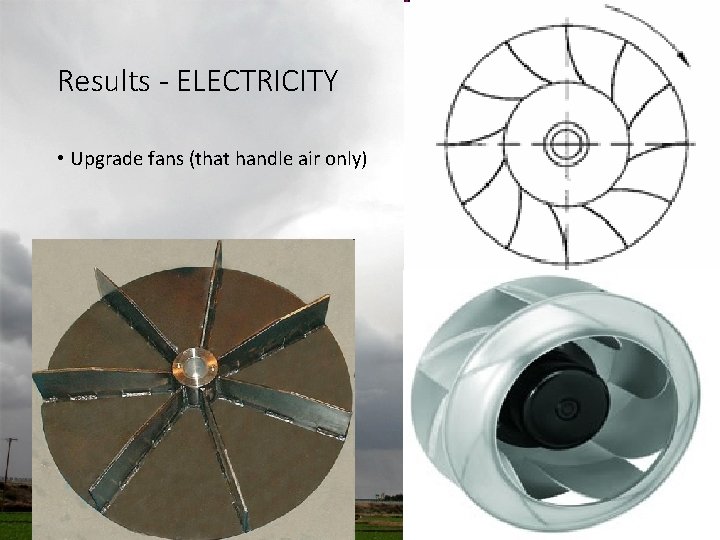
Results - ELECTRICITY • Upgrade fans (that handle air only)
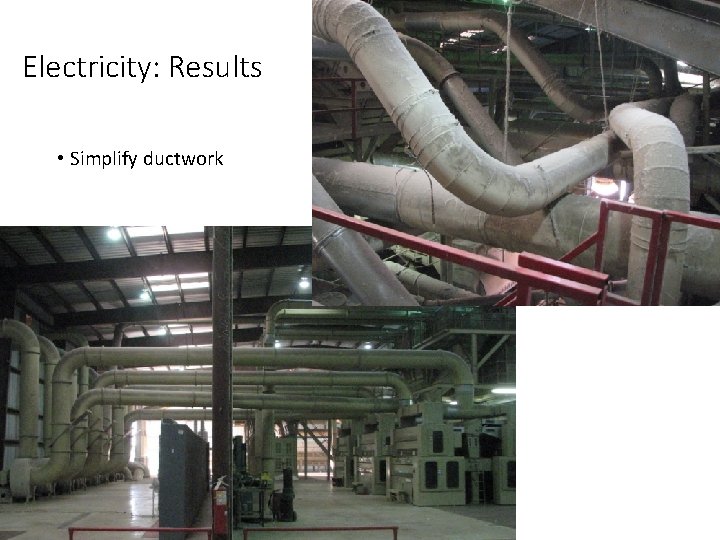
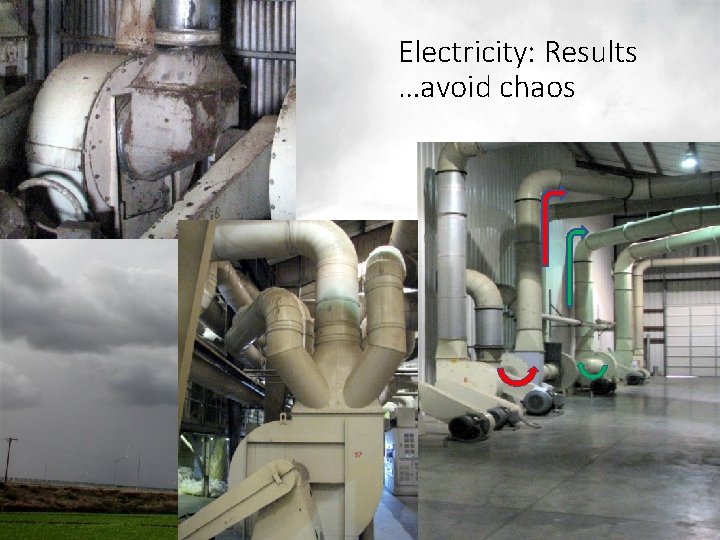
Electricity: Results • Simplify ductwork
Electricity: Results …avoid chaos
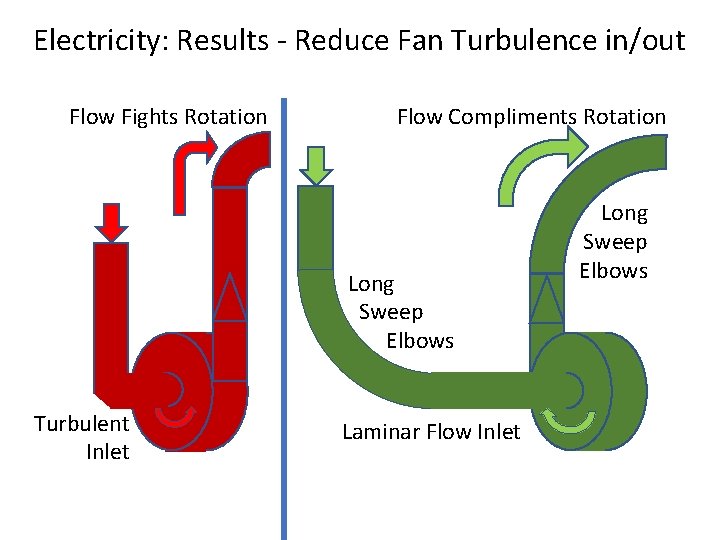
Electricity: Results - Reduce Fan Turbulence in/out Flow Fights Rotation Flow Compliments Rotation Long Sweep Elbows Turbulent Inlet Laminar Flow Inlet Long Sweep Elbows
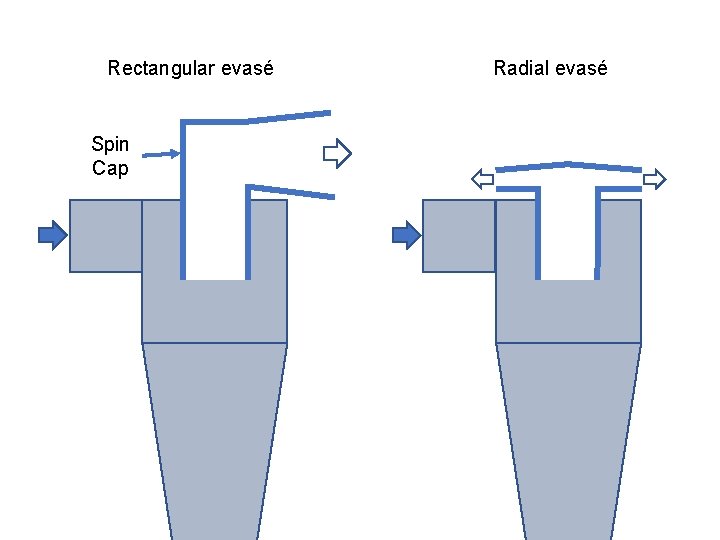
Rectangular evasé Spin Cap Radial evasé
Electricity: Results • Match motor sizes to loads • Buy high efficiency motors, but only when replacement is needed
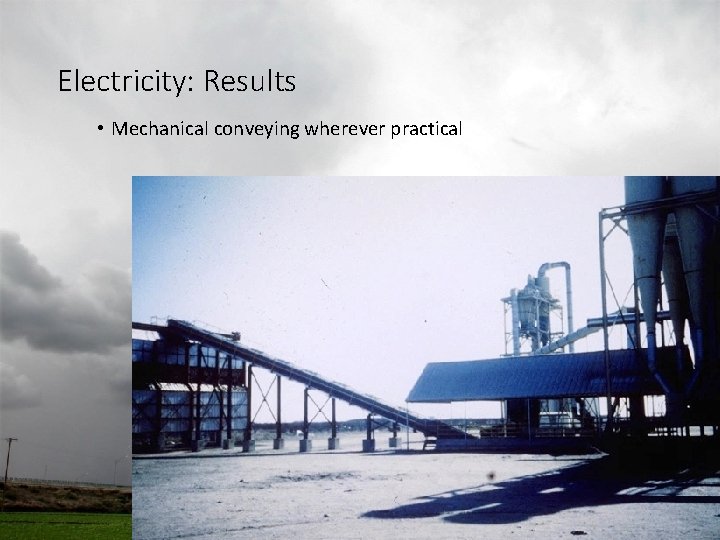
Electricity: Results • Mechanical conveying wherever practical
Electricity: Impacts • Industry has responded to rising costs by increasing efficiency • Electricity consumption per bale has decreased 0. 6 k. Wh each year • Improved sustainability and environmental stewardship • National savings about $10 million each season
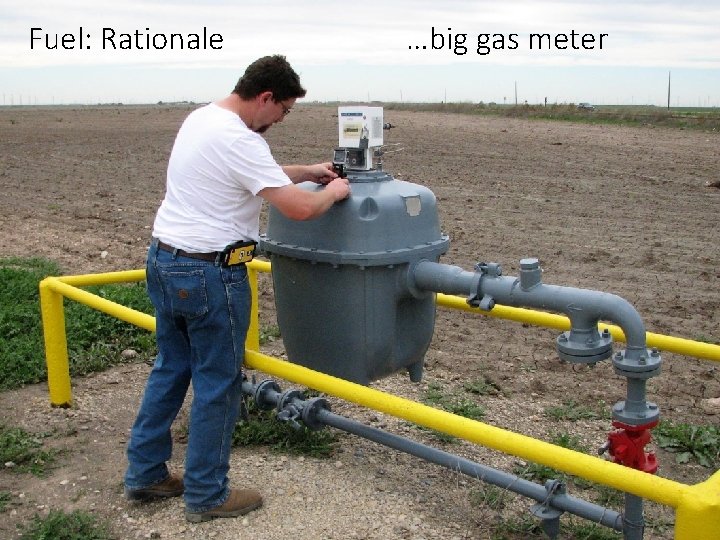
Fuel: Rationale …big gas meter
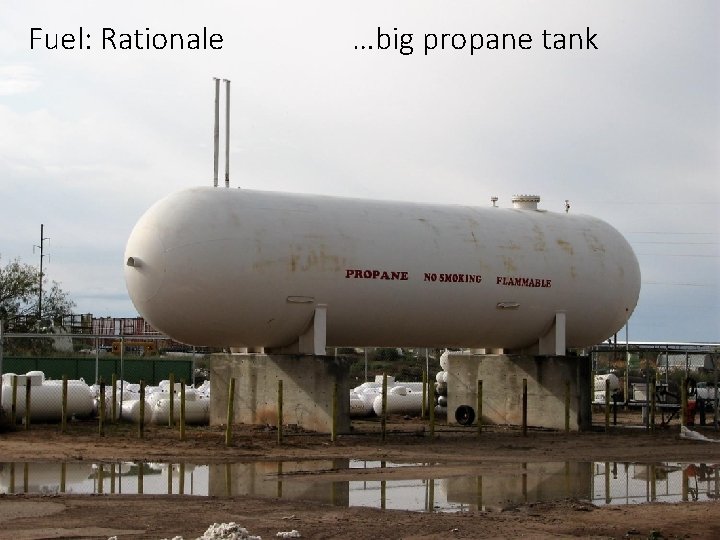
Fuel: Rationale …big propane tank
Fuel: Rationale • Fuel = 6½ % to 8½ % of ginning cost • Prices volatile, propane doubled in 10 y; can’t control cost of fuel • Weather unpredictable; can’t control drying amount needed • Fuel = most variable cost = biggest threat to profitability
Fuel: Rationale • Fuel = 6½ % to 8½ % of ginning cost • Prices volatile, propane doubled in 10 y; can’t control cost of fuel • Weather unpredictable; can’t control drying amount needed • Fuel = most variable cost = biggest threat to profitability • Can we improve utilization?
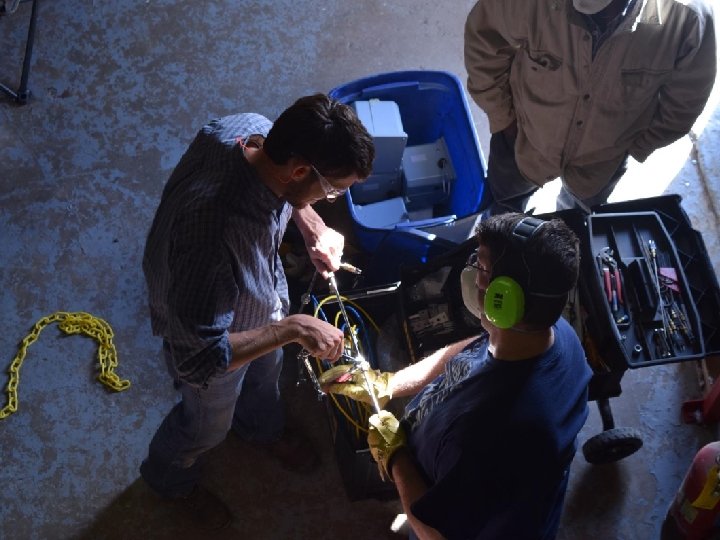
Fuel: Rationale Fuel Use Audits in Commercial Gins: in-season • It would be disruptive to cut gas flow to install a meter on each burner while the gin is running Fuel Use Audits in Commercial Gins: repair-season • It would be expensive to install meters on every burner in every cooperating commercial gin
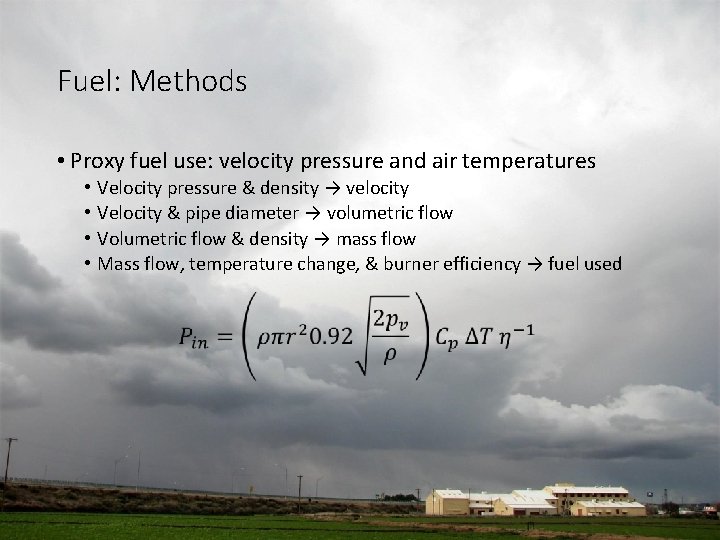
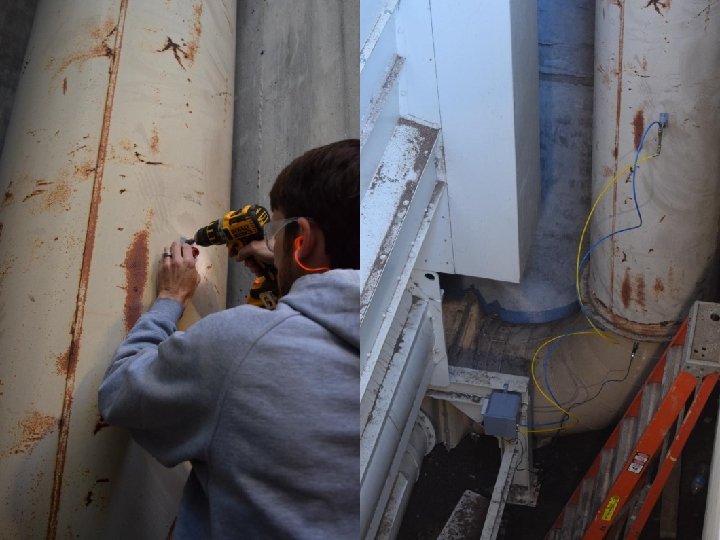
Fuel: Methods • Proxy fuel use: velocity pressure and air temperatures • • Velocity pressure & density → velocity Velocity & pipe diameter → volumetric flow Volumetric flow & density → mass flow Mass flow, temperature change, & burner efficiency → fuel used
Fuel: Methods • Quantify fuel consumption • Quantify effective drying • Bales per hour & turnout → seed cotton mass flow rate • Change in moisture content of that mass flow → water evaporated • Enthalpy of vaporization & rate of evaporation → benefit (k. W)
Fuel: Methods • Quantify fuel consumption • Quantify effective drying • Estimate portion of energy used for drying (fuel use efficiency) • Drying benefit/Fuel used cost → efficiency
Fuel: Methods • Quantify fuel consumption • Quantify effective drying • Estimate portion of energy used for drying (fuel use efficiency) • Find operating strategies, equipment selections, and facility designs that use fuel more efficiently
Fuel: Results • Find operating strategies, equipment selections, and facility designs that use fuel more efficiently …hasn’t been as easy as it first looked • Weather • Crop condition • Unmeasured factors
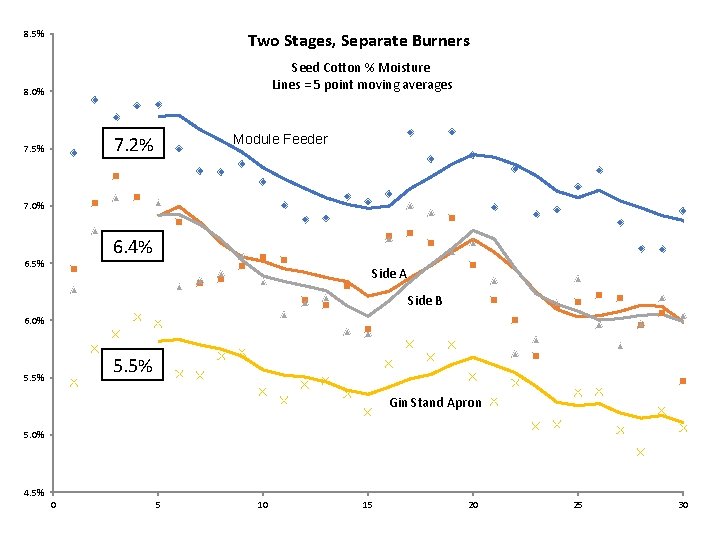
8. 5% Two Stages, Separate Burners Seed Cotton % Moisture Lines = 5 point moving averages 8. 0% Module Feeder 7. 2% 7. 5% 7. 0% 6. 4% 6. 5% Side A Side B 6. 0% 5. 5% Gin Stand Apron 5. 0% 4. 5% 0 5 10 15 20 25 30
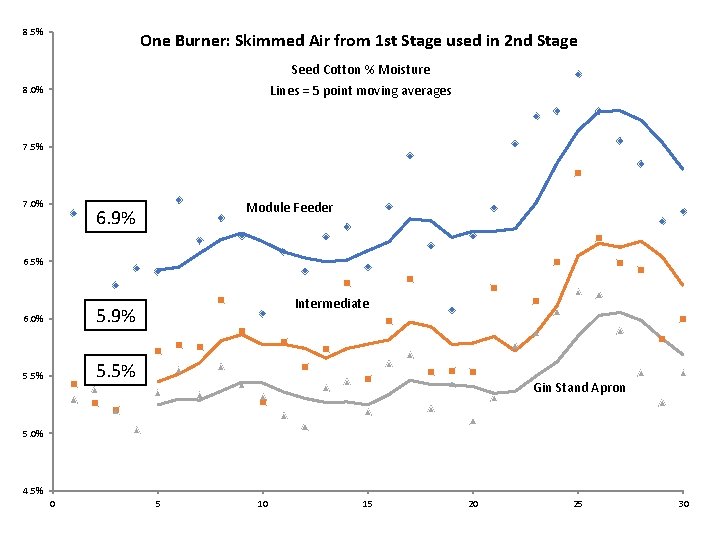
8. 5% One Burner: Skimmed Air from 1 st Stage used in 2 nd Stage Seed Cotton % Moisture Lines = 5 point moving averages 8. 0% 7. 5% 7. 0% Module Feeder 6. 9% 6. 5% 6. 0% 5. 9% 5. 5% Intermediate Gin Stand Apron 5. 0% 4. 5% 0 5 10 15 20 25 30
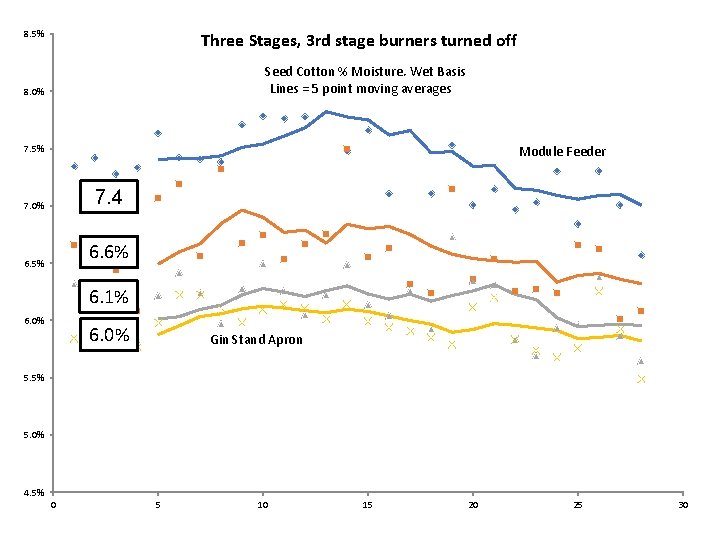
8. 5% Three Stages, 3 rd stage burners turned off Seed Cotton % Moisture, Wet Basis Lines = 5 point moving averages 8. 0% 7. 5% Module Feeder 7. 4 7. 0% 6. 6% 6. 5% 6. 1% 6. 0% Gin Stand Apron 5. 5% 5. 0% 4. 5% 0 5 10 15 20 25 30
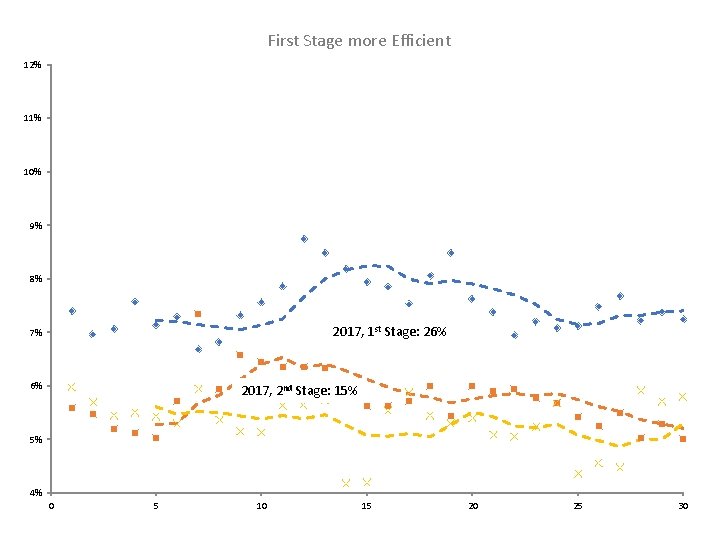
First Stage more Efficient 12% 11% 10% 9% 8% 2017, 1 st Stage: 26% 7% 6% 2017, 2 nd Stage: 15% 5% 4% 0 5 10 15 20 25 30
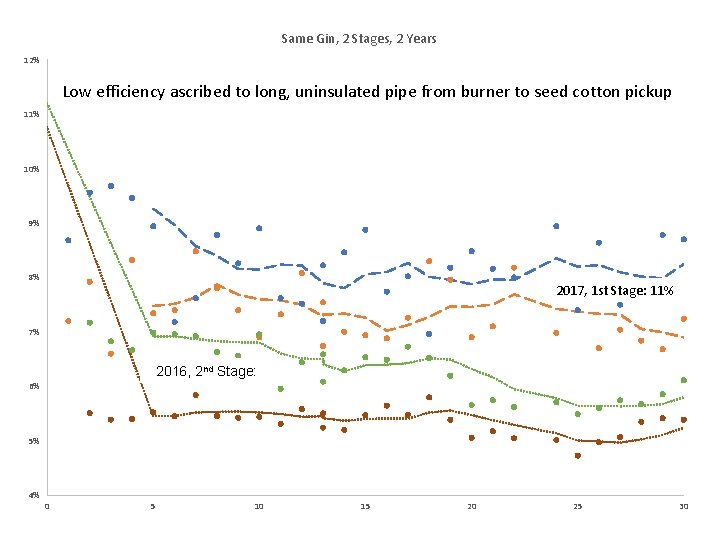
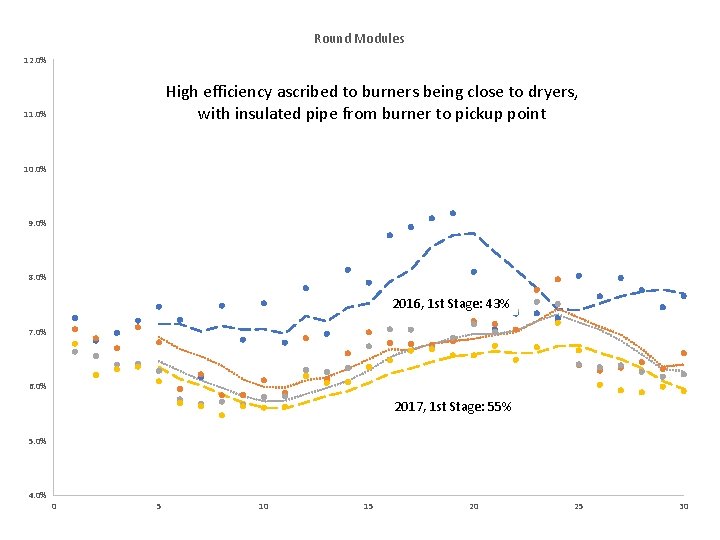
Round Modules 12. 0% High efficiency ascribed to burners being close to dryers, with insulated pipe from burner to pickup point 11. 0% 10. 0% 9. 0% 8. 0% 2016, 1 st Stage: 43% 7. 0% 6. 0% 2017, 1 st Stage: 55% 5. 0% 4. 0% 0 5 10 15 20 25 30
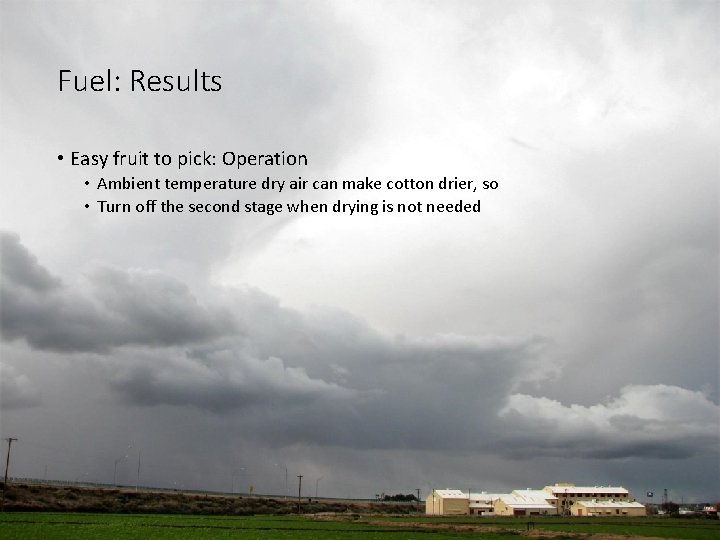
Fuel: Results • Easy fruit to pick: Operation • Ambient temperature dry air can make cotton drier, so • Turn off the second stage when drying is not needed
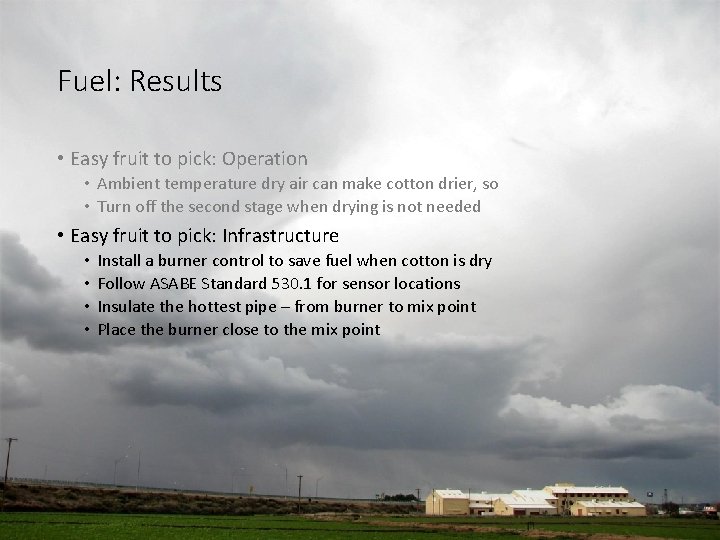
Fuel: Results • Easy fruit to pick: Operation • Ambient temperature dry air can make cotton drier, so • Turn off the second stage when drying is not needed • Easy fruit to pick: Infrastructure • • Install a burner control to save fuel when cotton is dry Follow ASABE Standard 530. 1 for sensor locations Insulate the hottest pipe – from burner to mix point Place the burner close to the mix point
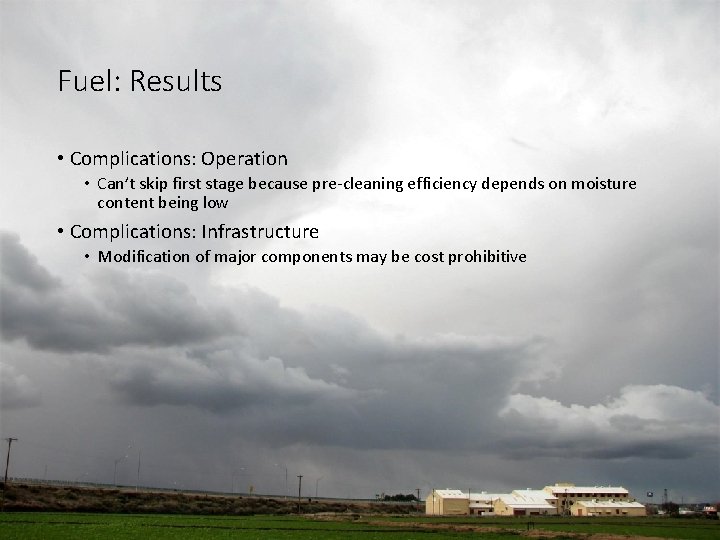
Fuel: Results • Complications: Operation • Can’t skip first stage because pre-cleaning efficiency depends on moisture content being low • Complications: Infrastructure • Modification of major components may be cost prohibitive
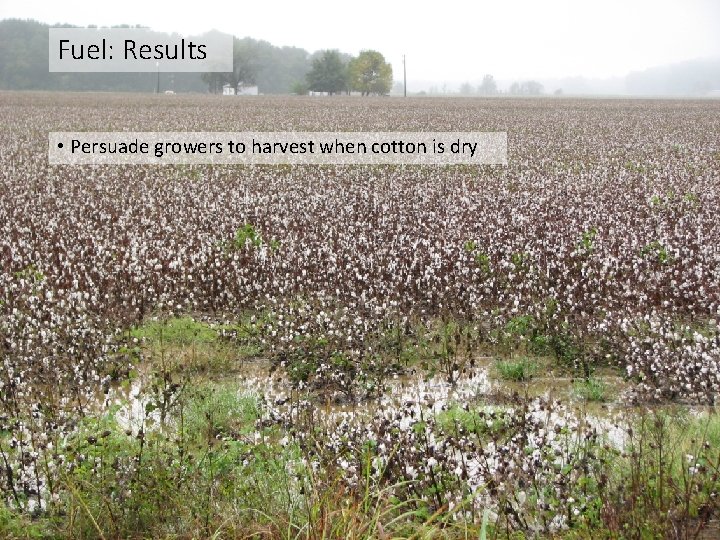
Fuel: Results • Persuade growers to harvest when cotton is dry
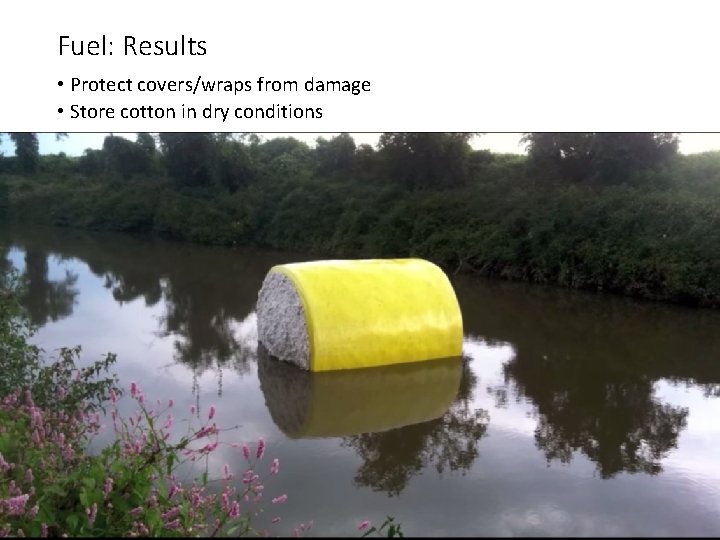
Fuel: Results • Protect covers/wraps from damage • Store cotton in dry conditions
USDA-Agricultural Research Service: Southwestern Cotton Ginning Research Lab (NM) US Cotton Ginning Research Unit (MS)