Results of Experiments in Akeno Kenji SHINOZAKI MaxPlanckInstitut

 Munich, Germany on")
")
 – Energy")
 – Sampling")


 • Detector station – 111 surface detectors TB")

 ρμ(1000) 600 m")

 • Modified from Linsley formula – Delay time behind shower")
![Lateral distribution (empirical) secθ≤ 1. 1 S(600)=10, 30[m 2] • Modified Linsley formula ρ(R)](https://slidetodoc.com/presentation_image_h2/4ffb27cc0f2edb05f880e0d0f5a294f1/image-15.jpg "Lateral distribution (empirical) secθ≤ 1. 1 S(600)=10, 30[m 2] • Modified Linsley formula ρ(R)")
 for vertical showers – Dai et al.")
 Dataset: February 1990 – January 2004 1. Energy: ≥ 1017")
![Reconstruction accuracy (Energy resolution, Angular resolution) 8 Open angle Δθ[º] Counts [%/bin] 20 15](https://slidetodoc.com/presentation_image_h2/4ffb27cc0f2edb05f880e0d0f5a294f1/image-18.jpg "Reconstruction accuracy (Energy resolution, Angular resolution) 8 Open angle Δθ[º] Counts [%/bin] 20 15")
 • AGASA Exposure – 5. 8 x 10¹⁶ m")
 Before & after unification ’ 90. 2—’")
 • Super GZK-particles exist – 11 events above 1020 e. V")
 Gain variation (11 yr)")
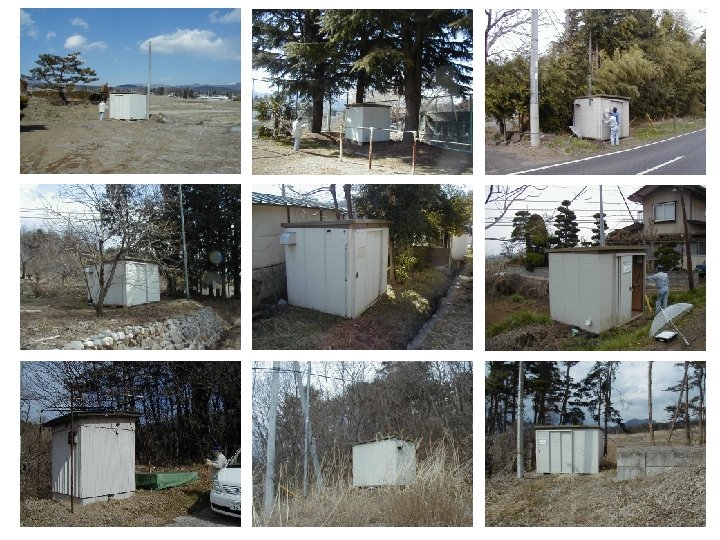
 • Detector container (0. 4 mm iron roof) – Detector box")

![Energy conversion factor E 0 = a [1017 e. V]x S(600) b Ref. Dai](https://slidetodoc.com/presentation_image_h2/4ffb27cc0f2edb05f880e0d0f5a294f1/image-25.jpg "Energy conversion factor E 0 = a [1017 e. V]x S(600) b Ref. Dai")
 attenuation curve AIRES code + QGSJET / SIBYLL model for p / Fe")
 Particle arrival time distri. @2 km")

 • No")
 in Akeno 1 km 2 array • E 0")


 : 1019 – 4 x 10¹⁹ e.")
 : 4 x 10¹⁹ –")
 : 4 x 10¹⁹ –")
 : 4 x 10¹⁹ –")
![Event density [a. u. ] 0 0 Event density [a. u. ] Log E>19.](https://slidetodoc.com/presentation_image_h2/4ffb27cc0f2edb05f880e0d0f5a294f1/image-38.jpg "Event density [a. u. ] 0 0 Event density [a. u. ] Log E>19.")

 Cluster component d. J/d. E")

 • Landau-Pomeranchuk-Migdal (LPM) effect (>~3")
 vs. energy relationship for gamma-rays (Akeno) • Gamma-ray energy underestimation – 30%")

![Primary mass estimator E 0=1. 8 x 10²⁰ e. V rm(1000)=2. 4[/m 2] Lateral](https://slidetodoc.com/presentation_image_h2/4ffb27cc0f2edb05f880e0d0f5a294f1/image-45.jpg "Primary mass estimator E 0=1. 8 x 1020 e. V rm(1000)=2. 4[/m 2] Lateral")
 – E 0≥ 1019 e. V –")
 • Gamma-ray primaries")
 distribution (E 0>1019 e. V) Consistent with proton dominant component Log(Muon density@1000 m[m–")
 A 1: Preliminary A 1: PRELIMINARY Present result")

 primaries • Gamma-ray fraction upper limits")

 • Energy spectrum – Data analysis up to")
- Slides: 53
Results of Experiments in Akeno Kenji SHINOZAKI Max-Planck-Institut für Physik (Werner-Heisenberg-Institut) Munich, Germany on behalf of AGASA Collaboration 2 nd International Workshop on Ultra-high-energy cosmic rays and their sources 14 – 16 April, 2005 @INR Moscow
AGASA Collaborators • • • Institute for Cosmic Ray Research, University of Tokyo (Kashiwa) – Masaki Fukushima, Naoaki Hayashida, Hideyuki Ohoka, Satoko Osone, Masahiro Takeda, Reiko Torii Kinki University (Osaka) – Michiyuki Chikawa University of Yamanashi (Kofu) – Ken Honda, Norio Kawasumi, Itsuro Tsushima Saitama University (Saitama) – Naoya Inoue Musashi Institute of Technology (Tokyo) – Kenji Kadota Tokyo Institute of Technology (Tokyo) – Fumio Kakimoto Nishina Memorial Fundation (Tokyo) – Koichi Kamata Hirosaki University (Hirosaki) – Setsuo Kawaguchi Osaka City University (Osaka) – Saburo Kawakami • RIKEN (Wako) – Yoshiya Kawasaki, Hirohiko M. Shimizu Chiba University (Chiba) • • – Keiichi Mase, Nobuyuki Sakurai, Shigeru Yoshida Ehime University (Matsuyama) – Satoko Mizobuchi, Hisashi Yoshi Fukuki University of Technology (Fukui) – Motohiko Nagano Aoyama Gakuin University (Sagamihara) – Naoto Sakaki National Maritine Research Institute (Sagamihara) – Masahiko Sasano Max-Planck-Institute for Physics (Munich, GER) – Kenji Shinozaki, Masahiro Teshima National Institute of Radiological Sciences (Chiba) – Yukio Uchihori University of Chicago (Chicago, USA) – Tokonatsu Yamamoto
Physics motivation • Understanding nature & origin of UHECRs (>1019 e. V) – Energy spectrum – Arrival direction distribution – Chemical composition • Super GZK particles incl. highest energy cosmic rays (>1020 e. V) – Bottom-up scenarios • AGNs / GRBs / Collinding galactic etc. ⇒ Hadronic primaries predicted – Top-Down scenarios • Topological defects • Super heavy dark matter • Z-burst ⇒ Gamma-ray + nucleon 1 ries predicted • Source location still not identified, p. UHECR γCMB → N π+ (E 0 ~5 x 10¹⁹ e. V)
Air shower development & observation techniques • Surface array observation (eg. AGASA) – Sampling particles in shower front reaching ground • Measurement of particle distribution (electron/muon) • Fluorescence technique (eg. Hi. Res, EUSO) – Imaging fluorescence light emitted along air shower track • Measurement of longitudinal development (Track length; Xmax) • Hybrid measurement (eg. Auger, Telescope Array)
Outline • Physics motivation & observation principle • Activities at Akeno Observatory • Energy determination & spectrum – Shower properties & analysis – Systematic error in energy estimation • UHECR Anisotropy – 1018 e. V energies – 1019 e. V energy and Super-GZK • Muon component & chemical composition • Summary & outlook
Pre-AGASA
AGASA era AGASA
AGASA (Akeno Giant Air Shower Array) • Detector station – 111 surface detectors TB • Effective area ~100 km 2 • Optical fibre cable connection to observatory • Triggered by 5 -neighbouring hit detector within 25 ms – 27 muon detectors • Southern region ~30 km 2 coverage • Operation – Feb. 1990–Dec. 1995 4 separate-array operation – Dec. 1995–Jan. 2004 Unified operation NB SB AB
• Surface detector – 5 cm thick plastic scintillator – Hamamatsu 5” R 1512 PMT • Muon detectors (2. 8– 10 m 2; south region) – 14– 20 Proportional counters – Shielded by 30 cm Fe or 1 m concrete • Threshold energy: 0. 5 Ge. Vxsecθ – Triggered by accompanying surface detector
Event sample & observables 4. 11 x 1019 e. V S(600) ρμ(1000) 600 m 1000 m • Energy estimator (charged particle density @600 m): S(600) E 0 = 2. 0 × 1017 S(600) for vertical showers → less dependent of 1 ries or interaction models • Primary mass estimator (muon density@1000 m): ρμ(1000)
Event reconstruction 1. Centre of gravity in ρch distribution →a priori core location 2. Arrival direction optimisation (fitting shower front structure) 3. Core location estimation (fitting lateral distribution) 4. Iterative recalculation of Steps 2 & 3 5. Sθ (600)→S 0 (600) translation 6. Energy estimation by S 0 (600) vs. E 0 relation
Shower front structure (empirical) • Modified from Linsley formula – Delay time behind shower plane Td(R)[ns] = 2. 6 ( 1 + R/30[m] )1. 5 ρ(R) -0. 5 – Shower front thickness Ts(R)[ns] = 2. 6 ( 1 + R/30[m] )1. 5 ρ(R) -0. 3
Lateral distribution (empirical) secθ≤ 1. 1 S(600)=10, 30[m 2] • Modified Linsley formula ρ(R) = C (R/RM) –α (1+R/RM) –(η–α) {1+(R/1000)2} –δ • C: Normalisation constant, α=1. 2, δ=0. 6 • RM: Moliere unit @ Akeno (=91. 6 m) • η = (3. 97± 0. 13) – (1. 79± 0. 62) (secθ – 1) • Fluctuation of observed particle number σρ2 = ρ + 0. 25 ρ2 + ρ (= σscin 2 + σrest 2 + σstat 2)
Energy estimating relationships • Energy vs. S(600) for vertical showers – Dai et al. ’s MC result by COSMOS+QCDJET (1988) E 0 [e. V] = 2. 03× 1017 S 0 (600) • S(600) Attenuation curve 2× 10¹⁹ e. V 1× 10¹⁹ e. V – Empirical relationship (equi-intensity cut method) Sθ (600)=S 0 (600)・ exp{–X 0 / Λ 1 (secθ– 1) –X 0 / Λ 2 (secθ– 1)2} • X 0: Atmospheric depth @ AKeno (920 g/cm 2) • Λ 1 = 500 g/cm 2 • Λ 2 = 594 g/cm 2
Event selection criteria (standard) Dataset: February 1990 – January 2004 1. Energy: ≥ 1017 e. V 2. Zenith angle: ≤ 45° 3. Core location: inside AGASA boundary 4. Number of hit detector ≥ 6 5. Good reconstruction χ2 ≤ 5 for arrival direction fitting χ2 ≤ 1. 5 for core location fitting (≥ 1018. 5 e. V for spectrum)
Reconstruction accuracy (Energy resolution, Angular resolution) 8 Open angle Δθ[º] Counts [%/bin] 20 15 10 5 0 – 1. 0 0. 0 1. 0 ΔLog(Energy[e. V]) • Energy resolution – ΔE 0/E 0=± 30% @1019. 5 e. V – ΔE 0/E 0=± 25% @1020 e. V 6 4 90% 2 0 68% 18 19 20 Log(Energy[e. V]) • Angular resolution – Δθ=2. 0º @1019. 5 e. V – Δθ=1. 3º @1020 e. V
Exposure (up to May 2003) • AGASA Exposure – 5. 8 x 10¹⁶ m 2 sec sr above ~1019 e. V within θ<45º – AGASA has higher exposure than Hi. Res below ~3 x 10¹⁹ e. V
Core location distribution (>1018. 5 e. V) Before & after unification ’ 90. 2—’ 95. 12 Aperture: ~110 km 2 sr ’ 95. 12—’ 04. 01 extended to ~160 km 2 sr
Energy spectrum (θ<45º) • Super GZK-particles exist – 11 events above 1020 e. V • Expected 1. 9 event on GZK assumption for uniform sources
t 1: Peak Detector calibration Pulse width distri. (~10 hr) Gain variation (11 yr) a: Slope Channel [0. 5 ns] • PWD monitored every RUN (~10 h) – Information taken into account in analysis • Stability of detector – Gain variation (peak of PWD) : ± 0. 7% – Linearity variation(slope of PWD) : ± 1. 6% Cf. Δτ/<τ>=–Δa/<a> Linearity variation (11 yr)
Detector simulation (GEANT) • Detector container (0. 4 mm iron roof) – Detector box (1. 6 mm iron) • Scintillator (5 cm thick) • Earth (backscattering) Detector response understood at ± 5% accuracy
Energy conversion AIRES + QGSJET 98 / SIBYLL for p & Fe Energy dispersion in atmosphere Muon / neutrino 90% Ele. Mag • 90% primary energy carried by EM component – primary particle & model ~a few % dependence • S(600) depending less on primary particle / model
Energy conversion factor E 0 = a [1017 e. V]x S(600) b Ref. Dai et al. ’ 88 COSMOS Model 1 ry a b QCDJET p 2. 03 1. 02 QGSJET 98 p 2. 07 1. 03 Fe 2. 34 1. 00 p 2. 30 1. 03 Fe 2. 19 1. 03 p 2. 17 1. 01 Fe 2. 15 1. 03 p 2. 34 1. 04 Fe 2. 24 1. 02 Single=electron (900 m) Nagano et al. ’ 99 (CORSIKA 5. 621) Single= PH peak (900 m) SIBYLL 1. 6 Sakaki et al. ’ 01 (AIRES 2. 2. 1) QGSJET 98 Single= PW peak (667 m) SIBYLL 1. 6 • Presently assigned primary energy: – 10% ± 1 2% – Most conservative (We need to push up current energy)
S(600) attenuation curve AIRES code + QGSJET / SIBYLL model for p / Fe 45º 20. 0 19. 5 19. 0 18. 5 18. 0 • S(600) attenuating rather slowly – Correction factor less than 2 up to 45º zenith angle • S(600) attenuation curve consistent between data & MC – Depending less on 1 ry particles or interaction models – Error on energy estimation: ± 5%
Shower phenomenology effects (shower front thickness/ delaying particles) Particle arrival time distri. @2 km (2 x 10²⁰ e. V) Shower front thickness • Overestimation effects – Important far away from core • Data between several 100 m – 1 km dominant in energy estimation – Effect of shower front thickness ± 5% – Effect of delaying particles ± 5% Delaying particles
Major systematics in AGASA energy Detector Absolute gain ± 0. 7% Linearity ± 7% Detector response (container, box backscattering) ± 5% Energy estimator S(600) Interaction model, primary particles, altitude ± 12% Shower Phenomenology Lateral distribution ± 7% S(600) attenuation ± 5% Shower front structure ± 5% Late arriving particles ± 5% Total ± 18% Systematics is energy independent above 1019 e. V Feature of spectrum can hardly change that extends beyond GZK cutoff.
Consistency check in different aperture Inside array Well inside array (~2/3 AGASA) • No systematic found in different apertures • EHECR spectrum extension beyond GZK cut-off
Comparison of Ne vs. S(600) in Akeno 1 km 2 array • E 0 [e. V] = 3. 9× 10¹⁵(Ne/106) 0. 9 – Derived from attenuation curve comparison with Chacalaya (5200 m; 540 g/cm 2) experiment • E 0 = 8. 5× 10¹⁸ [e. V] – by Ne = 5. 13× 109 • E 0 = 9. 3× 10¹⁸ [e. V] – by S(600) = 45. 7 [/m 2 ] Fairly good agreement between experiment & MC
AGASA vs. A 1 comparison
Cosmic ray propagation in Galaxy 1018 e. V 1019 e. V • ~1018 e. V – Well trapped in Galaxy • >1019 e. V – Sources extragalactic – >1020 e. V: Deflection angle ~a few deg. • Very likely to point back birthplace 1020 e. V
Anisotropy around 1018 e. V Significance map of event density in 20ºΦ along equi-declination • Large scale anisotropy clearly found – ~4σ excess @~Galactic Centre – ~4σ deficit @~anti-Galactic Centre • Evidence of Galactic cosmic rays presence up to 1018 e. V
Arrival direction distribution (>1019 e. V; θ<50º) : 1019 – 4 x 10¹⁹ e. V : 4 x 10¹⁹ – 1020 e. V : >1020 e. V • No large scale anisotropy
Arrival direction distribution (>4 x 10¹⁹ e. V; θ<50º) : 4 x 10¹⁹ – 1020 e. V • Small scale anisotropy – Event clustering (>4 x 10¹⁹ e. V within 2. 5º) 1 triplet (○) & 6 doublets (○) observed : >1020 e. V
Arrival direction distribution (>4 x 10¹⁹ e. V; θ<50º) : 4 x 10¹⁹ – 1020 e. V : >1020 e. V • Small scale anisotropy – Event clustering (>4 x 10¹⁹ e. V within 2. 5º) 1 triplet (○) & 6 doublets (○) observed – Applying loose criteria (>3. 9 x 10¹⁹ e. V within 2. 6º) 2 triplet (doublet → triplet) & 6 doublets (new doublet) observed
Arrival direction distribution (>4 x 10¹⁹ e. V; θ<50º) : 4 x 10¹⁹ – 1020 e. V : >1020 e. V • Small scale anisotropy – Event clustering (>4 x 10¹⁹ e. V within 2. 5º) 6 doublets (○) &1 triplet (○) observed • Against expected 2. 0 doublets (Pch <0. 1%) • There must be ~ a few x 100 EHECR sources
Event density [a. u. ] 0 0 Event density [a. u. ] Log E>19. 0 3. 4σ 20 40 Space angle [º] 60 Log E>19. 4 2. 0σ 20 40 Space angle [º] 60 0 Log E>19. 2 3. 0σ 20 40 Space angle [º] Event density [a. u. ] Space angle distribution of events 0 60 Log E>19. 6 4. 4σ 20 40 Space angle [º] 60 • Significant peak @ 0 degree – implying presence of compact EHECR sources
2 D-plots on galactic coordinates Δb. II 90º<l<180º; – 60<b<+60º Log E >19. 0 Log E >19. 2 Δl. II Log E >19. 4 Log E >19. 6 Modelled by Stanev • Hot region elongating along ~40º tilting from Δb direction – Consistent with Galactic magnetic field structure behind our FOV
Integral EHECR spectrum (Ordinary EHECR vs. cluster comp. ) Cluster component d. J/d. E 0∝E 0– 1. 8± 0. 5 • Harder spectrum of cluster component – Scattering lower energy EHECRs – Watching spectrum at nearby sources? • Extrapolation meeting highest energy cosmic ray flux @~1020 e. V
Chemical composition study • Presence of Super-GZK particles – No location identified as their sources – Possibilities of Top-down models (TDs, Z-burst, SHDM…) UHECR composition is key discriminator of models ⇒ Muons in giant air shower are key observable for AGASA
Gamma-ray shower properties • Fewer muon content (photoproduced muon) • Landau-Pomeranchuk-Migdal (LPM) effect (>~3 x 10¹⁹ e. V) – ‘Slowing down’ shower development • Interaction in geomagnetic field (>several x 1019 e. V) – ‘Accelerating’ shower development – LPM effect extinction – Incident direction dependence Simulated with MC by Stanev & Vankov 1020 e. V Proton 1020 e. V Gamma-ray (LPM effect) 1020 e. V Gamma-ray (geomag. Interacted) 2000 g/cm 2 1000 g/cm 2
Average S(600) vs. energy relationship for gamma-rays (Akeno) • Gamma-ray energy underestimation – 30% @~1019 e. V – 50% @~1019. 5 e. V (Maximum LPM effct) – 30% @~1020 e. V (Recovered by geomag. effect)
Lateral distribution of muons No significant change in shape of LDM up to 1020 e. V rm(R)=C(R/R 0)-1. 2(1+R/R 0)-2. 52(1+(R[m]/800)3)-0. 6 , E 0=1017. 5– 1019 e. V R 0: Characteristic distance (280 m @q=25 o) Lateral distribution function obtained by A 1 Experiment (Hayashida et al. 1995)
Primary mass estimator E 0=1. 8 x 10²⁰ e. V rm(1000)=2. 4[/m 2] Lateral distribution SAMPLE • Muon density at 1000 m rm(1000) – Fitting muon data in R=800 -1600 m to LDM – Error~± 40% Muon: Charged particle: Empirical formulae
Analysis • Dataset (After unification in 1995) – E 0≥ 1019 e. V – Zenith angle: q≤ 36º – Normal event quality cuts – ≥ 2 muon detectors in R=800 m– 1600 m ⇒ rm(1000) – Statistics 129 events above 1019 e. V 19 events above 1019. 5 e. V
Simulations • Proton / iron primaries (AIRES 2. 2. 1+QGSJET 98) • Gamma-ray primaries (Geomag. + AIRES +LPM) – Geomagnetic field effect • Significant above 1019. 5 e. V • Code by Stanev &Vankov – LPM effect • Significant above 1019. 0 e. V • Included in AIRES • Detector configuration & analysis process
rm(1000) distribution (E 0>1019 e. V) Consistent with proton dominant component Log(Muon density@1000 m[m– 2]) Average relationship rm (1000)[m− 2]= (1. 26± 0. 16)(E 0[e. V]/1019)0. 93± 0. 13 1 0 − 1 − 2 19 19. 5 20 Log(Energy [e. V]) 20. 5
Iron fraction (p+Fe 2 comp. assumption) A 1: Preliminary A 1: PRELIMINARY Present result (@90% CL) Fe frac. : <35% (1019 – 1019. 5 e. V) <76% (above 1019. 5 e. V) Akeno 1 km 2 (A 1): Hayashida et al. ’ 95 (Interpretation by AIRES+QGSJET) Gradual decrease of Fe fraction between 1017. 5 & 1019 e. V Haverah Park (HP): Ave et al. ’ 03 Volcano Ranch (VR): Dova et al. (present conf. ) Hi. Res (Hi. Res): Archbold et al. (present conf. )
Compilation by Anchordoqui et al. 2004 Fly’s Eye Xmax MOCCA SIBYLL Akeno 1 μ Volcano R. Lat. MOCCA + SIBYLL Haverah P T 50 QGSJET 01 QGSJET 98 Haverah P. Lat. QGSJET 98 Hi. Res-MIA Xmax AGASA μ CORSIKA QGSJET AIRES QGSJET 98 Hi. Res Xmax CORSIKA QGSJET Akeno 1 μ AIRES + QGSJET 98
Limits on gamma-ray fraction Assuming 2 -comp. (p+gamma-ray) primaries • Gamma-ray fraction upper limits (@90%CL) to observed events – 34% (>1019 e. V) Topological defects (Sigl et al. ‘ 01) (Mx=1016[e. V]; flux normalised@1020 e. V ) Z-burst model(Sigl et al. ‘ 01) (Flux normalised@1020 e. V) SHDM-model (Berezinski ‘ 03) (Mx=1014[e. V]; flux normalised@1020 e. V ) SHDM-model (Berezinski et al. ‘ 98) (Mx=1014[e. V]; flux normalised@1019 e. V ) (g/p<0. 45) – 56% (>1019. 5 e. V) (g/p<1. 27)
• Energy Spectrum Summary – 11 events observed >1020 e. V against 1. 9 on GZK assumption – Energy spectrum remains extending beyond GZK cut-off Conventional GZK mechanism can hardly explain!! • Arrival direction distribution – Signature of compact EHECR sources • 6 doublets & 1 triplet in 2. 5º above 4 x 10¹⁹ e. V (θ<50 º) – Feature of charged EHECRs deflection in GMF • Chemical composition – Gradual lightening between 1017. 5 & 1019 e. V – Light component favoured @1019 e. V (AIRES+QGSJET) – Gamma-ray dominance negative at highest energies Fraction of gamma-rays <56% @90%CL (> 1019. 5 e. V)
Outlook (what’s gonna come to India) • Energy spectrum – Data analysis up to 60º zenith angle – Improved energy estimation • Arrival direction distribution – Data analysis up to 60º zenith angles – Improved understanding shower front stucture – Detailed features in anisotropy • Chemical composition – Interpretation using latest MC simulations • Akeno 1 km 2 data – Data interpretation of old Akeno 1 km 2 data by latest MCs – Energy spectrum & chemical composition in 1016— 1018 e. V energies