Redistricting in Wisconsin Presentation to the Wisconsin Land


 - Reflect a good faith effort")
 (a) 2. indicates that wards are to")

 by Race/Ethnicity")


 by Census Block")
 by Census Block")


- Slides: 18
Redistricting in Wisconsin Presentation to the Wisconsin Land Information Association Conference February 16, 2012 Sarah Kemp, Researcher University of Wisconsin-Madison Phone: 608 -256 -6781 Email: kemp@wisc. edu
Redistricting in Wisconsin • Summary of the State Population • Review of Redistricting History • Research Question • Data and Methodology • Results • Future Research
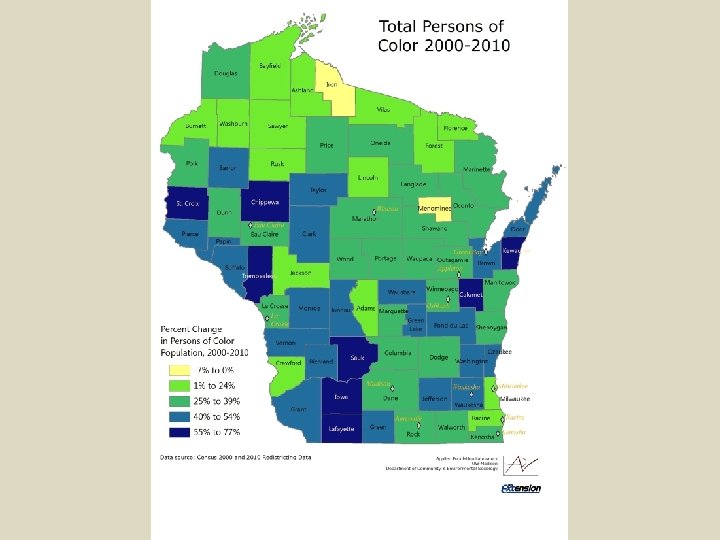
Total Population for the State of Wisconsin by Race/Ethnicity Ø The percentage of non-Hispanic white decreased while the percentage of all other race/ethnic groups increased from 2000 to 2010. Ø All race/ethnic population groups increased from 2000 to 2010. Ø Non-Hispanic white population increased the least (3%) while Hispanic population increased the most (74%).
Redistricting prior to 2011 State Statutes (1980 s) - Reflect a good faith effort to apportion the legislature giving due consideration to the maintenance of the integrity of political subdivisions and of communities of interest. [4. 001(3)] Assembly and Senate districts were determined by the courts and not the legislature in the 1990 s and 2000 s. Summer of 2011 Act 39 (August 8, 2011) Local Redistricting - Wards and Supervisory Districts Act 43 (August 23, 2011) Redistricting of Senate and Assembly Districts
Redistricting Act 39 Section 5. 15 (1) (a) 2. indicates that wards are to be created in such a way that aldermanic and supervisory districts can be created allowing enhanced participation by members of racial or language minority groups. Act 43 created the 2011 assembly and senate districts and repealed the language regarding communities of interest. 2001 Blocks 2011 Blocks Wards Legislative Districts Wards
Research Question How does the concentration of racially and ethnically distinct groups within Wisconsin’s legislative districts compare between 2001 and 2011? Data • Census Block data, 2000 and 2010 • Assembly District data, 2002 and 2011 Methodology • Arc. GIS
Percent Population (over 18 years old) by Race/Ethnicity
Majority Race/Ethnicity, 2000 By Census Block 100, 0% Non-Hispanic White 90, 0% African American 80, 0% Hispanic Asian Percent Population 70, 0% Native American 60, 0% 50, 0% 40, 0% 30, 0% 20, 0% 10, 0% Non-Hispanic White African American Hispanic Race/Ethnicity Majority Population Asian Native American
Majority Race/Ethnicity, 2010 By Census Block 100, 0% Non-Hispanic White 90, 0% African American 80, 0% Hispanic Asian Percent Population 70, 0% Native American 60, 0% 50, 0% 40, 0% 30, 0% 20, 0% 10, 0% Non-Hispanic White African American Hispanic Race/Ethnicity Majority Population Asian Native American
2000 Minority Population (over 18) by Census Block
2010 Minority Population (over 18) by Census Block
Results
Results
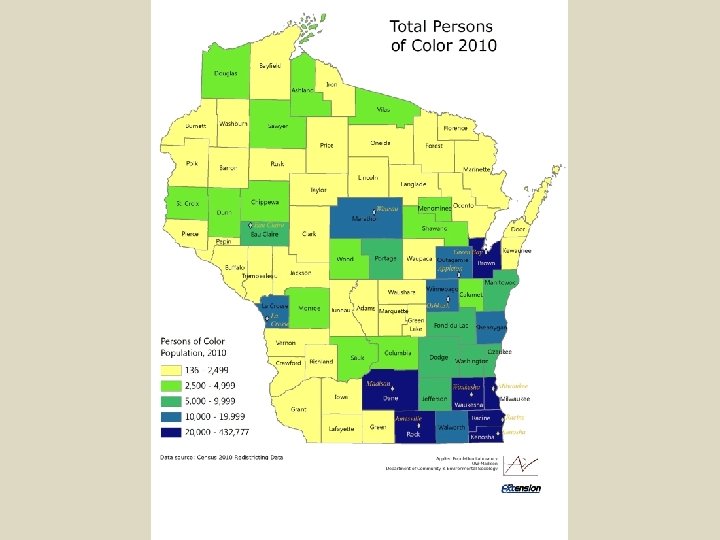
Findings • Percent minority population increased while percent non-Hispanic white population decreased from 2000 to 2010. • Persons of color appear to be more dispersed throughout the State of Wisconsin from 2000 to 2010. • Percent population (over 18) of majority minority population has increased for African American, Hispanic and native American populations within assembly districts. • Asian American percent population (over 18) remained the same within assembly districts.
Future Research • Evaluate population in assembly districts with a higher concentration of minority populations. • Compare 2000 & 2010 minority population by local wards. • Compare 2010 population by 2001 assembly districts to 2000 population by 2001 assembly districts.
THANK YOU ! Sarah Kemp Applied Population Laboratory University of Wisconsin-Madison 608 -256 -6781 kemp@wisc. edu