Recent Results from a Nested MultiStatic HF Radar


- Slides: 39
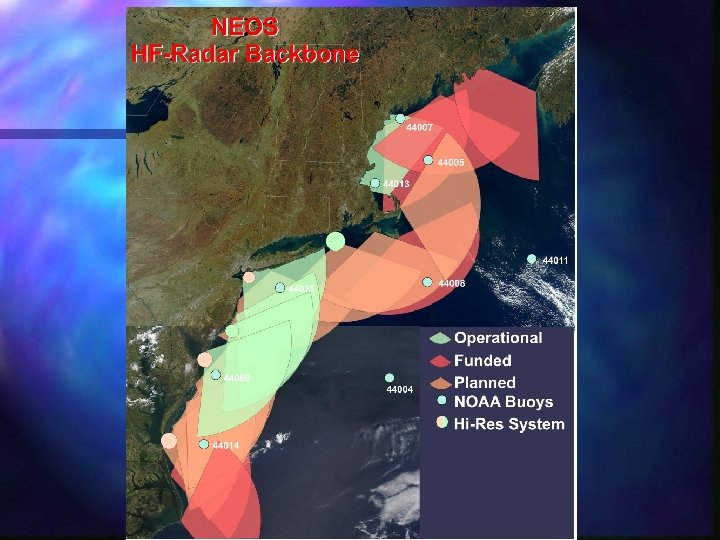
Recent Results from a Nested Multi-Static HF Radar Network for the Northeast Observing System (NEOS) Hugh Roarty Josh Kohut & Scott Glenn Coastal Ocean Observation Lab Rutgers University Science web site http: //marine. rutgers. edu/cool Operational web site http: //www. thecoolroom. org
VOTE Scott Glenn for Governor of California Where is Gray Davis? Where is Scott Glenn? “I’m right here Arnold and I am coming after you!
Frequency: 25 MHz Range: 50 km Resolution: 1. 5 km Time Step: 1 hour
Test 1998 1999 2000 2001 2002 2003
Frequency: 5 MHz Range: 200 km Resolution: 6 km Time Step: 3 hour
1998 1999 2000 2001 2002 2003 Radials Radials
NEOS HF Radar Network Partners • Applied Mathematics, Inc. • Army Corp. of Engineers • CODAR Ocean Sensors • Go. MOOS • NOAA • Stevens Institute of Technology • Rutgers University • United Stated Coast Guard R&D Center • University of Connecticut • University of Maine • University of Massachusetts, Dartmouth • University of North Carolina, Chapel Hill • University of Rhode Island
5 MHz Long-Range Bistatic Buoy
5 MHz Long-Range Bistatic Buoy
Block Island, RI 5 MHz Long-Range CODAR Install
Block Island, RI 5 MHz Long-Range CODAR Install
Validation: Contribution of Vertical and Horizontal Shear
2 0 0 1 S u m m e r Ex p e r i m e n t
2001 Summer Experiment Site Depth Instrument COOL 1 10. 1 m RDI ADCP Tuckerton COOL 2 14. 9 m Son. Tek ADP 5 MHz Long-Range CODAR COOL 3 18. 0 m RDI ADCP COOL 4 20. 7 m Son. Tek ADP COOL 5 21. 9 m RDI ADCP COOL 1 COOL 2 Brigantine 25 MHz Standard CODAR COOL 3 n COOL 4 COOL 5 n n Long-Range and Standard CODAR Thermistors at all 5 locations, spaced at 1 m intervals ADCP n n n 1 meter bins Continuously sampled every 5 s 3 hour Centered Average
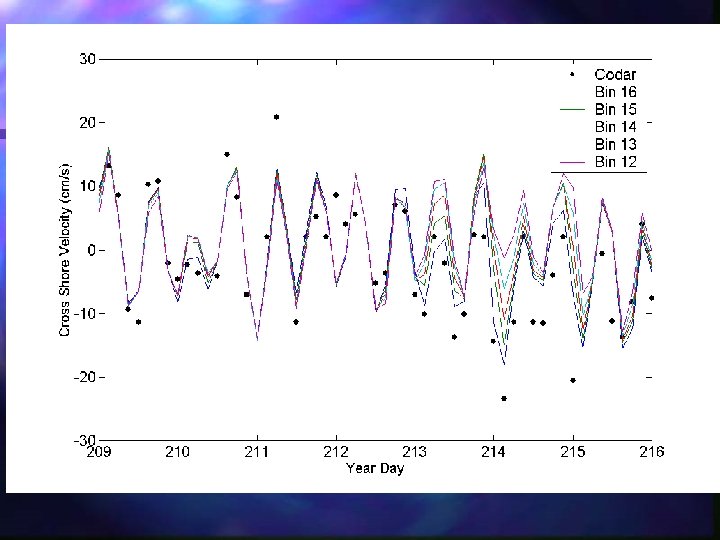
6 km Long-Range Sea. Sonde 5 m 2. 5 m BIN 20 BIN 19 BIN 18 BIN 17 BIN 16 12 m BIN 15 BIN 14 BIN 13 BIN 12 BIN 11 BIN 10 BIN 9 COOL 5 NTS
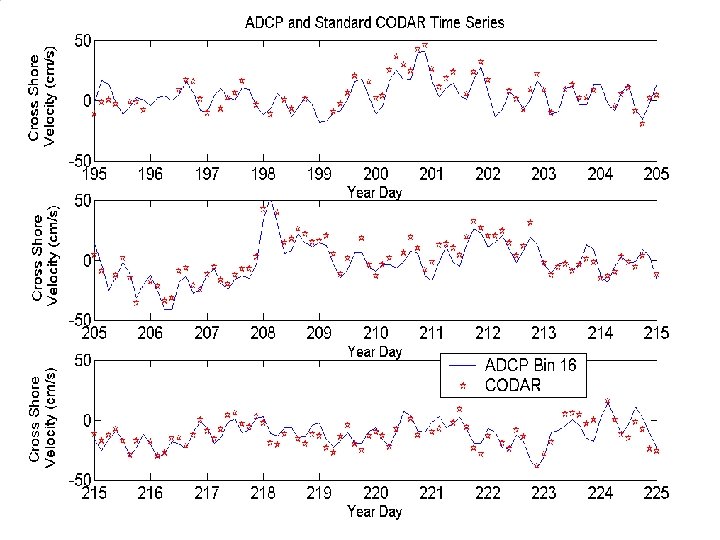
Long-Range CODAR and ADCP Comparison VERTICAL SHEAR
Tuckerton COOL 1 COOL 2 COOL 3 Brigantine COOL 4 COOL 5
Radial
Ideal Pattern, 8. 27 cm/s RMS Difference Measured Pattern, 7. 74 cm/s RMS Difference
Location of Bin 16 Location of Bin 11 Temperature °C
July 28 th to 30 th: Low Shear August 1 st to 3 rd: High Shear
Bin 16 Bin 11
Bin 16 Bin 11
RMS Difference 3. 92 cm/s RMS Difference 6. 30 cm/s
Long-Range CODAR and ADCP Comparison HORIZONTAL SHEAR
Tuckerton COOL 1 COOL 2 COOL 3 Brigantine COOL 4 COOL 5
BIN 16 BIN 15 Long-Range Sea. Sonde BIN 19 BIN 18 2. 5 m BIN 20 BIN 19 BIN 14 BIN 17 BIN 18 BIN 13 BIN 16 BIN 17 BIN 12 BIN 15 BIN 16 BIN 11 BIN 14 BIN 15 BIN 10 BIN 13 BIN 14 BIN 9 BIN 12 BIN 13 BIN 12 BIN 11 BIN 10 BIN 9 COOL 4 COOL 3 4 km COOL 5 4 km NTS
RMS Difference Between CODAR & Bin 16 BIN 15 BIN 19 11. 29 cm/s BIN 14 BIN 20 BIN 18 BIN 13 BIN 17 BIN 12 RMS Difference 6. 07 cm/s BIN 11 BIN 10 BIN 9 BIN 16 BIN 15 BIN 14 BIN 13 RMS Difference Between CODAR & Bin 16 COOL 4 4 km BIN 11 BIN 10 BIN 9 6. 89 cm/s COOL 3 BIN 12 COOL 5 4 km
RMS Difference Between 5 MHz CODAR and ADCP Horizontal Shear Above Measure Horizontal Shear Below Measure Vertical Shear Above Measure 9. 29 cm/s (8) 7. 30 cm/s (21) Vertical Shear Below Measure 11. 60 cm/s (17) 6. 51 cm/s (77) (Number of data points shown in parentheses)
Standard CODAR and ADCP Comparison
BIN 16 BIN 15 Standard Sea. Sonde Long-Range Sea. Sonde BIN 20 BIN 19 BIN 14 BIN 18 BIN 13 BIN 17 BIN 12 BIN 16 BIN 11 BIN 10 BIN 9 RMS Difference Between Long. Range CODAR and Bin 16: 7. 74 cm/s RMS Difference Between Standard CODAR and Bin 16: 6. 79 cm/s BIN 15 BIN 14 BIN 13 BIN 12 BIN 11 BIN 10 BIN 9 COOL 3 4 km COOL 4 4 km COOL 5
Tuckerton COOL 1 COOL 2 Brigantine COOL 3 COOL 4 COOL 5
Tuckerton 5. 9 cm/s Brigantine 7. 2 cm/s
Conclusions The HF Radar network I within NEOS is growing with the help of strong collaboration between operators, data managers and users n Use of Measured Antenna Patterns Improved Comparison n Decreased Vertical Shear due to Strong Stratification Led to Closer ADCP/HF Radar Comparisons n Differences Between ADCP and HF Radar Measurements are shown to Depend on the Strength of the Horizontal Shear n