Recent Trends in Indias Foreign Trade Presented By

Recent Trends in India’s Foreign Trade Presented By: Indransh Gupta Kunal Modi

What is Foreign Trade Policy? • Union Commerce Ministry, Go. I announces integrated FTP every five year also called EXIM policy. • policy updated every year with some modifications & new schemes. • FTP which was announced on August 28, 2009 is an integrated policy for the period 2009 -14.

Foreign Trade Policy 2009 -14 Short Term Objectives: • arrest and reverse the declining trend of exports. • provide support to those sectors which have been hit badly by recession. Medium term Policy Objectives : • achieve an Annual Export growth of 15% by March 2013. • achieve Annual Export growth of around 25% by 2014. Long Term Objective : • doubling India’s share in Global Trade by 2020.

Targets • Export Target : $ 350 Billion for 2012 -13 • Export Growth Target: 15 % for next two year and 25 % thereafter.

Import/Export Controls IMPORTS: • Around 5% Tariff Lines are under Import Controls. • 11600 Tariff Lines are free for import. • Restrictions removed over the next 10 years, removing almost all the Quantitative Restrictions. • Presently: § Prohibited items - 53 Lines § Restricted items - 485 Lines § State Trading Items - 33 Lines.

Import/Export Controls EXPORTS: Controls primarily on account of security, public health, morals, exhaustible resources and environment grounds. § Prohibited items - 59 § Restricted items - 155 § State Trading Items - 12 • Restrictions fall under two Categories: § Special provision for these items under Weapons of Mass Destruction Act, 2005. § Export Facilitation Committee looks into applications for license for these items. {Special chemical , organisms, materials, equip. & tech. } •

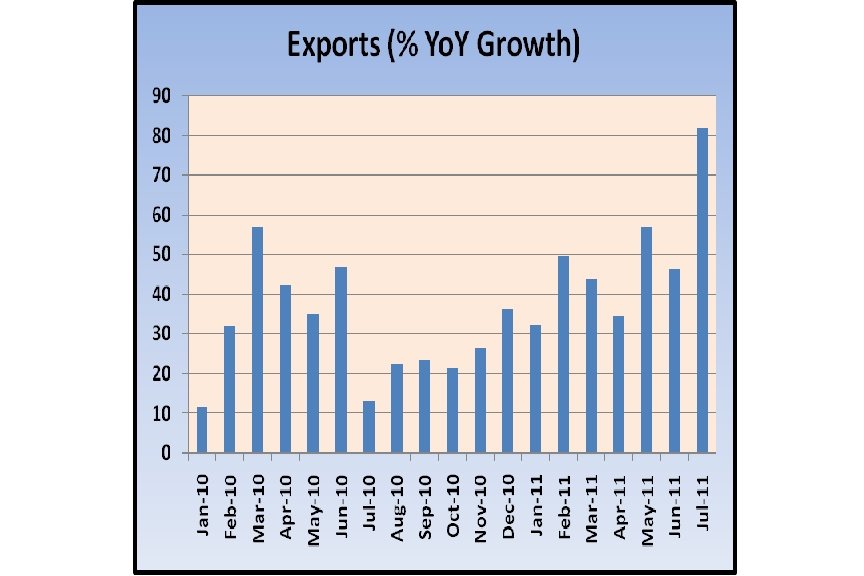
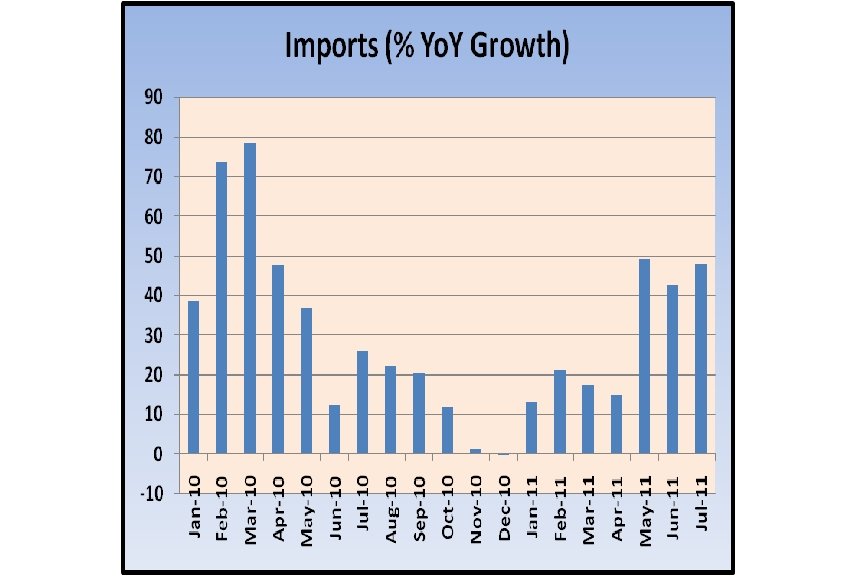
Highlights • Q 1 of 2012 -13, exports stood at US$ 75. 2 bn and showed a decline of 1. 7 per cent as against an increase of 36. 4 per cent during Q 1 of 2011 -12. • Q 1 of 2012 -13, imports declined by 6. 1 percent over the corresponding quarter of 2011 -12 and stood at US$ 115. 3 billion. • Lower growth in POL imports at 5. 5 percent during Q 1 of 2012 -13 as compared with 52. 5 percent during Q 1 of 2011 -12.

Highlights • Imports of gold and silver, US$ 9. 4 bn during Q 1 of 2012 -13 were 48. 4 per cent lower than that in Q 1 of 2011 -12. • Non-oil non-gold imports during Q 1 of 2012 -13 at US$ 65. 3 bn recorded a decline of 2. 9 per cent as compared to an increase of 18. 9 per cent in Q 1 of preceding year. • Trade deficit during Q 1 of 2012 -13 stood lower at US$ 40. 1 bn as compared with US$ 46. 2 bn during Q 1 of 2011 -12.

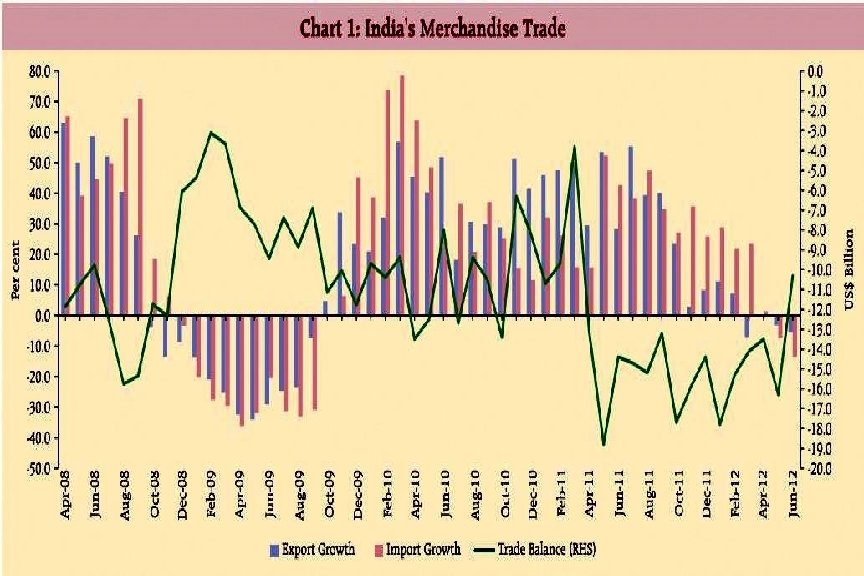
India’s Foreign Trade • growth is uncertain in coming months, given the worsening global macroeconomic outlook and high interest rate in the domestic market. • During April-Sept 2011, India's imports expanded by 32. 4% to $ 233. 5 billion. The trade deficit during the April-Sept’ 2011 period stood at $ 73. 5 billion. Increasing Trade Deficit further depreciates Rupee. • depreciation of rupee will also push up cost of imports leading to wider trade deficit in coming times.
 of GDP")
Export/Import Share of India as (%) of GDP

Exports of Principal Commodities

Imports of Principal Commodities

India's Exports to Principal Regions

India's Imports from Principal Regions

India’s Foreign Trade

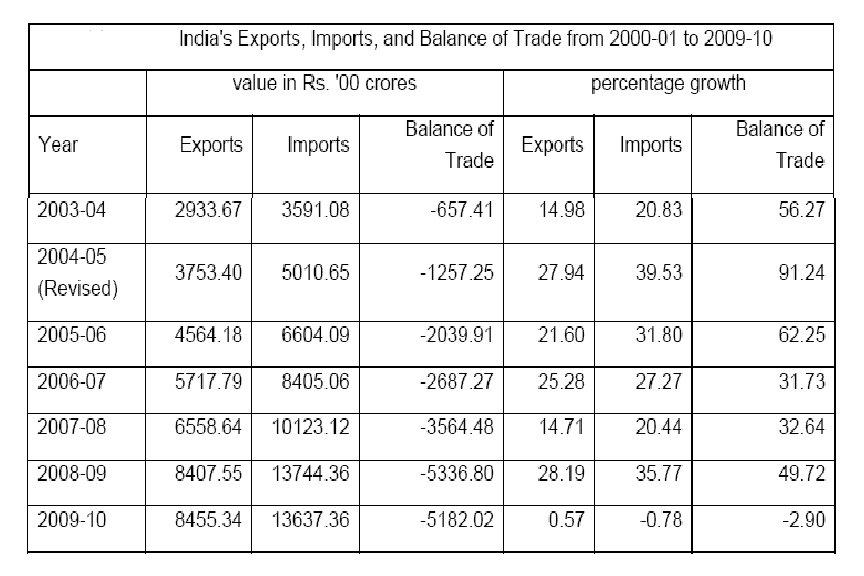
Last 10 Years India’s Export/Import Performance

Composition Of India’s Foreign Trade • Composition of Exports

Agricultural and Allied Products • 15% share in exports • Top items of agricultural exports include: - Fish Products - Rice - Oil Cakes - Fruits and Vegetables

Ores and Minerals • 12. 3% share in exports. Manufactured Goods • 61. 3% share in exports. - Include: Engineering Goods Gems and Jewellery Chemical and Allied Products Readymade Garments

Minerals Fuels and Lubricants • 18. 3% share in exports • There has been improvement in the exports of mineral fuels and lubricant both in terms of value and in terms of %.

Composition of Imports

• Petroleum Products 31. 7% share in Imports. • Capital Goods 20. 3% share in Imports. • Pearls and Precious Stones 6. 2% share in Imports. • Iron and Steel 2. 4% share of Imports. • Fertilizers 2. 4% share of Imports.

Conclusion Composition of India’s Foreign Trade has undergone a positive change. It is a remarkable achievement that India has transformed itself from a predominantly primary goods exporting country into non primary goods exporting country. Under Imports also India’s dependence on food grains and capital goods has declined.

- Slides: 28