Recent developments in productivity measurement Paul Schreyer OECD





- Slides: 28
Recent developments in productivity measurement Paul Schreyer OECD Statistics Directorate Canberra, 20 November 2012 1
Introduction • Productivity = output/input • Issues: – Identifying, measuring and aggregating inputs and outputs – Level of measurement (economy, industry, firm) • Academic community dealing with productivity measurement and analysis • World KLEMS network • NSOs: no clear trend 2
This presentation 1. Bringing nature into the productivity picture 2. The firm level: productivity measurement with micro-data No claim for comprehensive presentation of recent developments 3
Bringing nature into the productivity picture 4
Bringing nature into the picture – input side (1) • Typical inputs: labour, produced capital, intermediate inputs • Often neglected: non-produced natural assets: – Mineral resources – Soil/land – Timber – Aquatic resources – Water 5
Bringing nature into the picture – input side (2) • Why important? – Assessing contribution of natural assets to economic growth – Measuring productivity correctly – Policy implication: is growth driven by MFP or by natural assets – Note: without measurement, direction of bias unknown 6
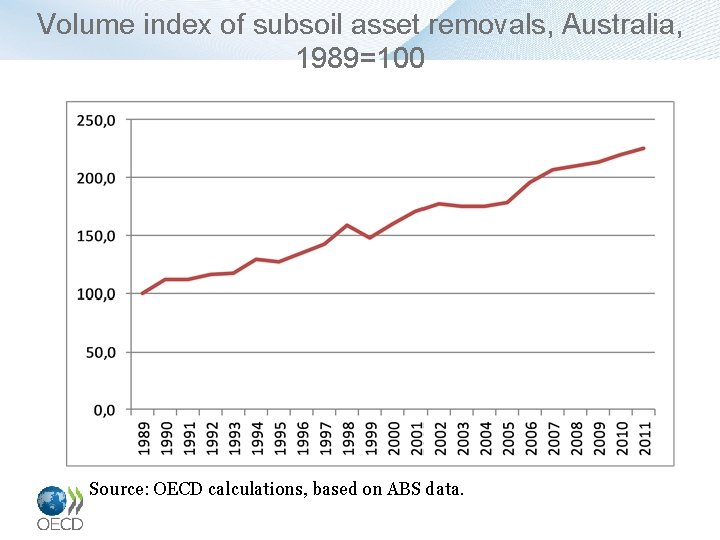
Volume index of subsoil asset removals, Australia, 1989=100 Source: OECD calculations, based on ABS data. 7
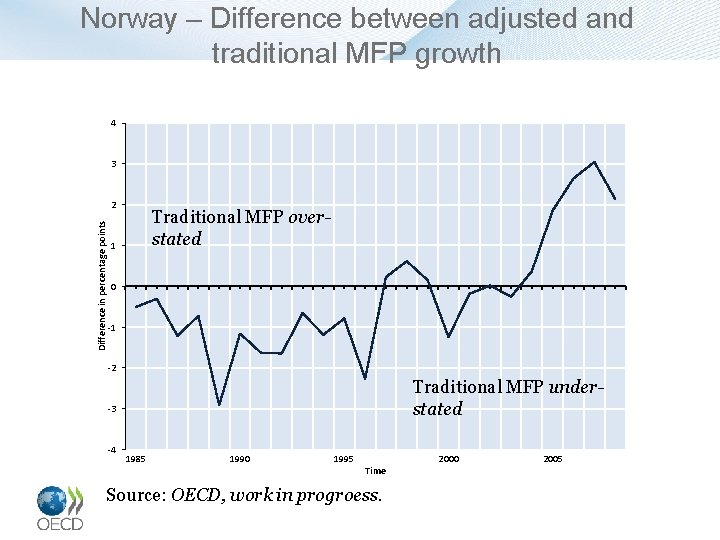
No unambiguous direction Effect of including natural resource input on measured productivity growth: • Traditional MFP > adjusted MFP if : – natural resource input growth > traditional input growth – i. e. , total input growth has been understated – i. e. , traditional MFP growth has been overstated • And vice versa 8
Norway – Difference between adjusted and traditional MFP growth 4 3 Difference in percentage points 2 Traditional MFP overstated 1 0 -1 -2 Traditional MFP understated -3 -4 1985 1990 1995 Time 2000 2005 Source: OECD, work in progroess. 9
Challenge: quality of natural resource input • Capture changing marginal extraction costs (which may be increasing) • Capturing changing quality in the resource itself eg declining soil quality failing to do so will overstate measured contribution of natural resource to output and understate MFP 10
Effects on productivity measures: Australia’s mining industry • Study by Productivity Commission (Topp, Soames, Parham, Bloch 2008): • Similar in spirit except that mining output is adjusted for declining yields • Underlying rate of productivity growth is around 2. 5 per cent p. a. , compared with stagnant standard MFP (1974 to 2007) Natural resource input has grown less quickly than other inputs, so MFP was understated by traditional measure 11
Bringing nature into the picture – output side (1) • Production processes often accompanied by undesirable outputs, e. g. , emissions • From producer and MFP measurement perspective: • Relevant in presence of environmental policies: – explicit price (e. g. , tax) or – implicit price (marginal abatement costs due to regulation) • Are traditional MFP measures over-or understated? 12
Again, no unambiguous effect on measured productivity (1) Example: • Given inputs (labour, capital, …) • Rising traditional output • Constant emissions adjusted MFP > traditional MFP Productivity growth was required to keep emissions at bay 13
Again, no unambiguous effect on measured productivity (2) • But overstatement of traditional MFP if emissions grow quicker than traditional output • For many pollutants (NOx, Sox, CO 2, …) relative decoupling in many OECD countries Understatement of traditional MFP 14
Private and social valuation • Producer perspective = private valuation – marginal abatement cost for producer • Welfare perspective = social valuation – marginal cost to society = producer costs + consumer costs + externalities • Both perspectives meaningful but should not be mixed up • If productivity measurement is based on producer theory, producer perspective is called for 15
OECD work in this area… • As part of green growth indicator work – MFP adjustment with natural asset inputs – MFP adjustment with undesirable outputs – Index of natural resources 16
Important international development: SEEA • System of Integrated Environmental and Economic Accounts • Adopted at UN level in 2012 • Consistent accounting for environmenteconomy interaction • Basis for indicator work • Unifying element: balance sheets – Stocks, additions, removals – Physical and monetary valuation • Major task ahead: implementation 17
The firm level: productivity measurement with micro-data 18
Firm-level measurement • Drawbacks – No prices, capital proxy, employees, incomplete sector coverage, short time-spans • Avantages – Entry, exit, reallocation – Within-firm cycle/growth – Understanding/measuring both firm-level levers and environmental factors driving growth 19
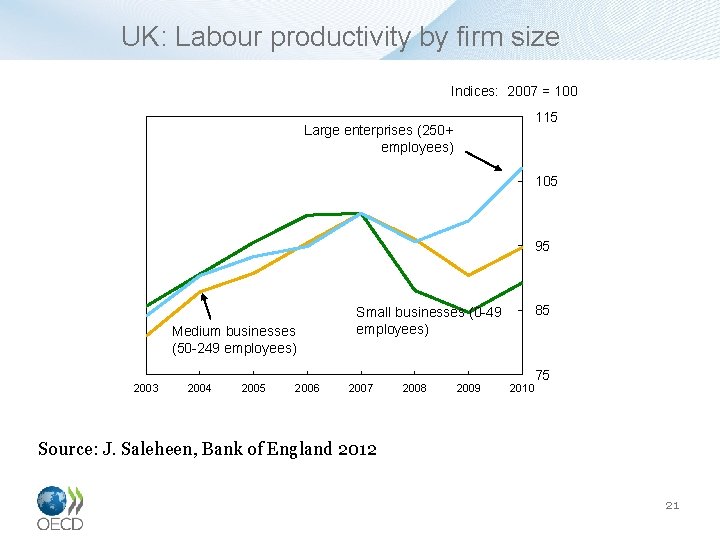
Stylised facts from micro estimates (1) • Huge productivity dispersion – Even within very narrowly defined industries – Firm size plays an important role – But how accurately are outputs measured? 20
UK: Labour productivity by firm size Indices: 2007 = 100 115 Large enterprises (250+ employees) 105 95 Medium businesses (50 -249 employees) 2003 2004 2005 2006 Small businesses (0 -49 employees) 2007 2008 2009 85 75 2010 Source: J. Saleheen, Bank of England 2012 21
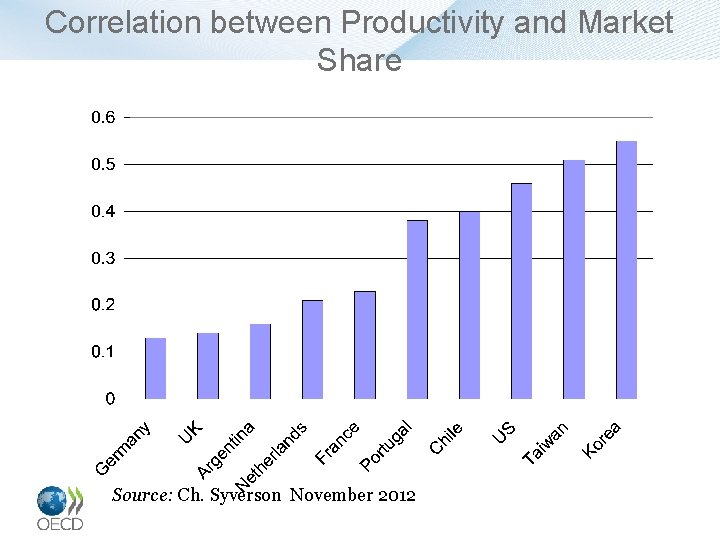
Stylised facts from micro estimates (2) • Reallocation or resources to highproductivity producers important • Competition—consumers can easily switch suppliers • Labor and capital market flexibility • Summary measure of reallocation: correlation between productivity and market share 22
Correlation between Productivity and Market Share Source: Ch. Syverson November 2012 23
Firm-level measurement requires dealing with… • Large volumes of data • Confidentiality issues – Small countries – Narrowly defined industries • No international standards – reduced comparability • NSOs have taken up issue 24
Conclusions 25
Conclusions (1) • Nature of productivity implies cumulation of measurement challenges • Quality of source data (national accounts, firm-level data) key • Integrating productivity measurement into official statistics important but not yet widespread 26
Conclusions (2) • Tricky output measurement in particular in: – Financial services – Health, education, general administration – Undesirable outputs • Tricky input measurement: – Hours worked by industry and by skills – R&D capital (new in national accounts) – Natural capital • Intangibles 27
Thank you! 28