Psychological research refers to research that psychologists conduct


- Slides: 19
Psychological research refers to research that psychologists conduct for systematic study and for analysis of the experiences and behaviours of individuals or groups. Their research can have educational, occupational and clinical applications.
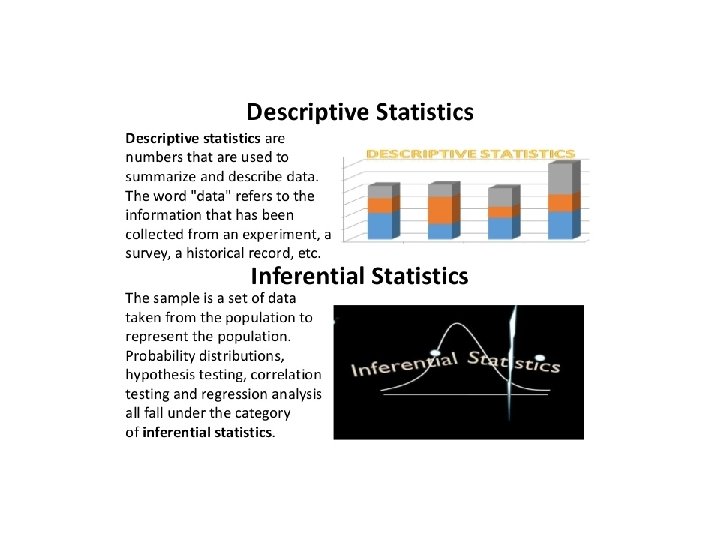
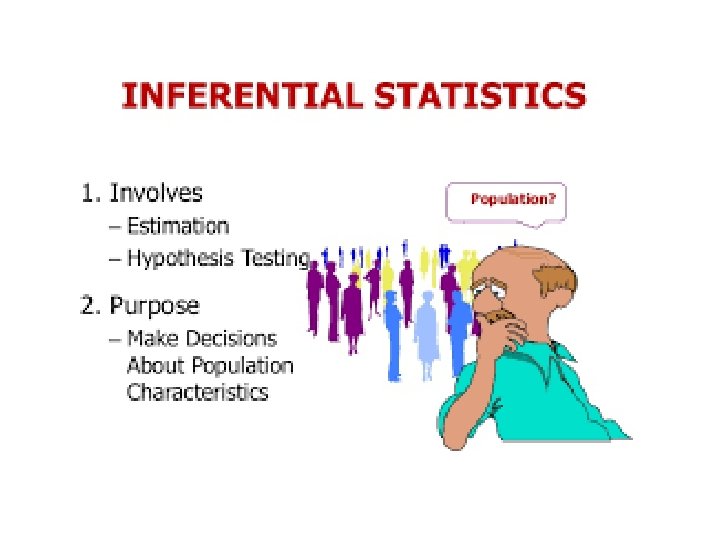
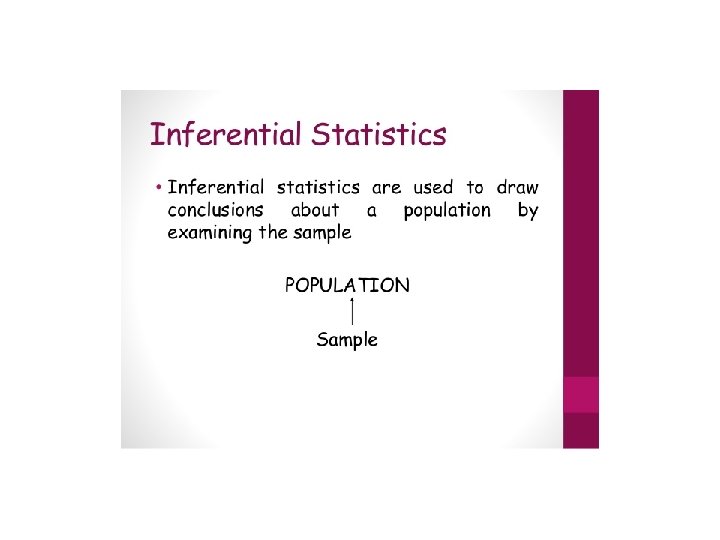
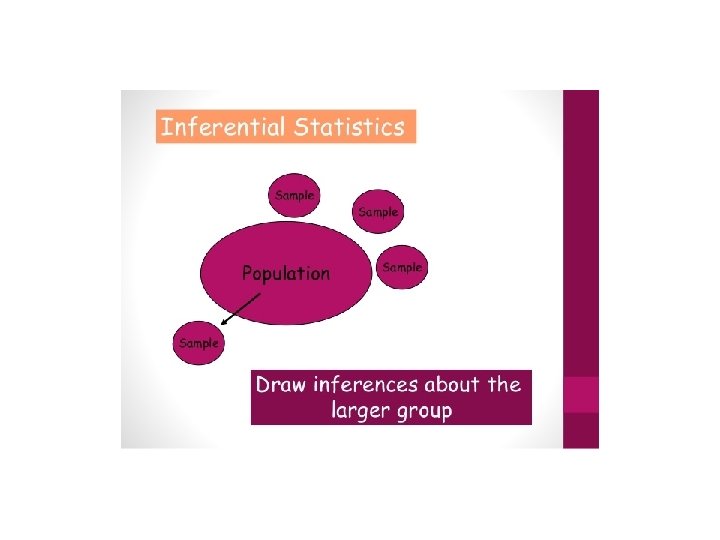
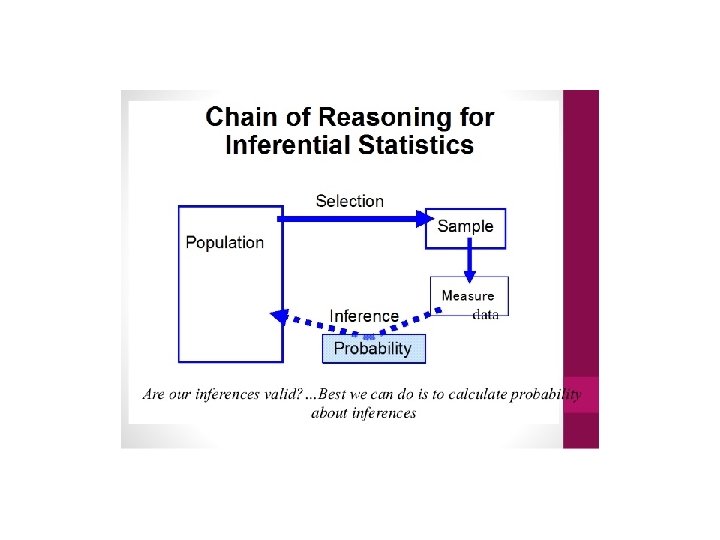
The Importance of Statistics in Psychology: Statistics allow psychologists to: Organize data: When dealing with an enormous amount of information, it is all too easy to become overwhelmed. Statistics allow psychologists to present data in ways that are easier to comprehend. Visual displays such as graphs, pie charts, frequency distributions, and scatterplots allow researchers to get a better overview of data and look for patterns they might otherwise miss. Describe data: Think about what happens when researchers collect a great deal of information about a group of people (for example, the U. S. Census). Descriptive statistics provide a way to summarize facts, such as how many men and women there are, how many children there are, or how many people are currently employed. Make inferences based on data: By using what's known as inferential statistics, researchers can infer things about a given sample or population. Psychologists use the data they have collected to test a hypothesis. Using statistical analysis, researchers can determine the likelihood that a hypothesis should be either accepted or rejected.
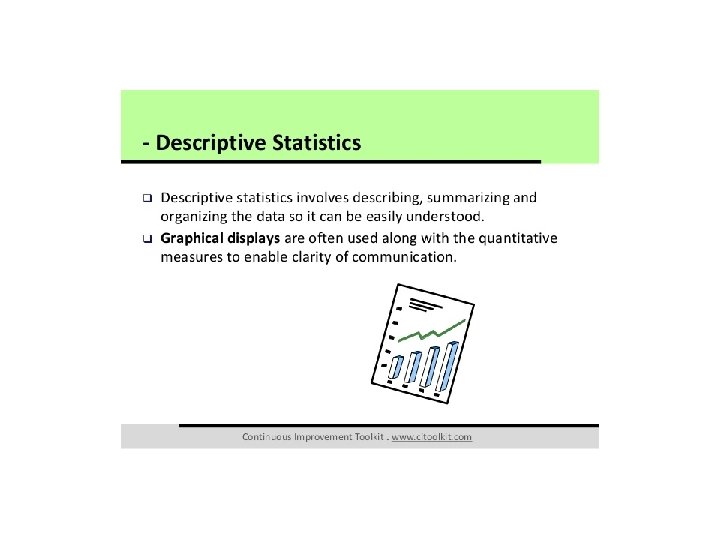
Use in statistical analysis: Descriptive statistics provide simple summaries about the sample and about the observations that have been made. Such summaries may be either quantitative, i. e. summary statistics, or visual, i. e. simple-to-understand graphs. These summaries may either form the basis of the initial description of the data as part of a more extensive statistical analysis, or they may be sufficient in and of themselves for a particular investigation. For example, the shooting percentage in basketball is a descriptive statistic that summarizes the performance of a player or a team. This number is the number of shots made divided by the number of shots taken. For example, a player who shoots 33% is making approximately one shot in every three. The percentage summarizes or describes multiple discrete events. Consider also the grade point average. This single number describes the general performance of a student across the range of their course experiences. The use of descriptive and summary statistics has an extensive history and, indeed, the simple tabulation of populations and of economic data was the first way the topic of statistics appeared. More recently, a collection of summarization techniques has been formulated under the heading of exploratory data analysis: an example of such a technique is the box plot.
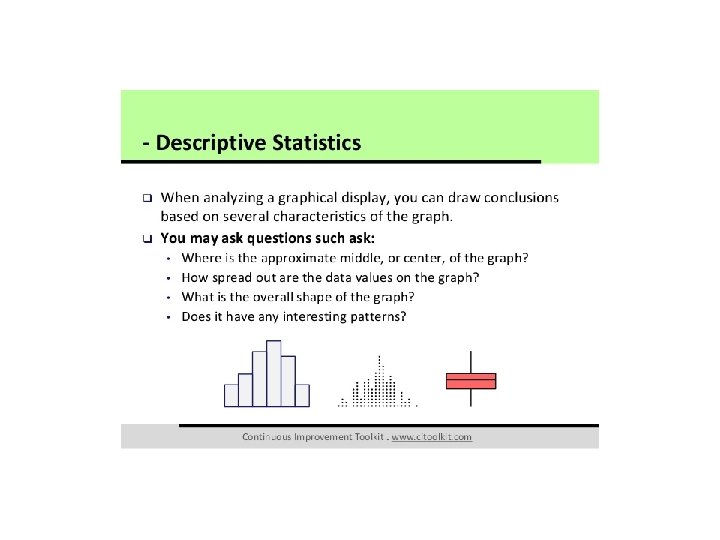
Univariate analysis involves describing the distribution of a single variable, including its central tendency (including the mean, median, and mode) and dispersion (including the range and quartiles of the data-set, and measures of spread such as the variance and standard deviation). The shape of the distribution may also be described via indices such as skewness and kurtosis. Characteristics of a variable's distribution may also be depicted in graphical or tabular format, including histograms and stem-and-leaf display. Bivariate and multivariate analysis When a sample consists of more than one variable, descriptive statistics may be used to describe the relationship between pairs of variables. In this case, descriptive statistics include: Cross-tabulations and contingency tables Graphical representation via scatterplots Quantitative measures of dependence Descriptions of conditional distributions
The main reason for differentiating univariate and bivariate analysis is that bivariate analysis is not only simple descriptive analysis, but also it describes the relationship between two different variables. Quantitative measures of dependence include correlation (such as Pearson's r when both variables are continuous, or Spearman's rho if one or both are not) and covariance (which reflects the scale variables are measured on). The slope, in regression analysis, also reflects the relationship between variables. The unstandardized slope indicates the unit change in the criterion variable for a one unit change in the predictor. The standardized slope indicates this change in standardized (z-score) units. Highly skewed data are often transformed by taking logarithms. Use of logarithms makes graphs more symmetrical and look more similar to the normal distribution, making them easier to interpret intuitively.
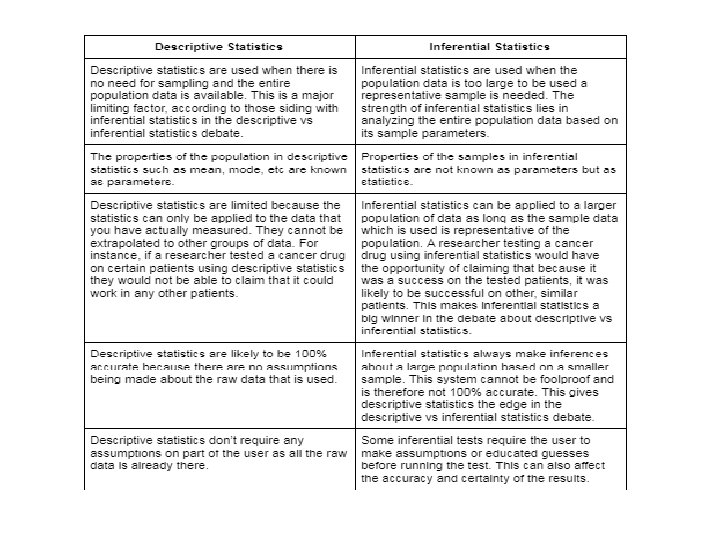
Inferential vs Descriptive Statistics: Which Is Better? There is no easy answer to this question. Both descriptive and inferential statistics signal very different approaches to understanding data. One method is not superior to the other in absolute terms. In fact, the superiority of the method depends on the circumstances. For instance, where the population data is limited, descriptive statistics is the right approach because it guarantees accuracy. However, when solving complex problems that affect a huge population, this method won’t work. Using inferential statistics to extrapolate the results for a larger population is the way to go in this case. So both methods have their limitations and advantages. The superiority of the method depends purely on the nature of the research and the problem that is being solved.