Principles of the MRI Signal Contrast Mechanisms MR


 is a pulse sequence where one")
 is a pulse sequence where one suppresses")

 Tissue Contrast Dependence on TR, TE Long PDW T")

 - uses a second")
 • Refer to T 2 -weighting in a gradient echo sequence")
 vs T 2 -Weighting (SE)")


 time t Mo Bo z z 90°")
- Slides: 20
ﻣﺤﺎﺿﺮﺍﺕ ﺍﻟﻔﻴﺰﻳﺎﺀ ﺍﻟﻄﺒﻴﺔ Principles of the MRI Signal Contrast Mechanisms MR Image Formation
Contrast Principles of the MRI Signal MR Image Formation Mechanisms ﺍﻟﻤﺤﺎﺿﺮﺓ ﺍﻟﺨﺎﻣﺴﺔ ﺳﻌﻴﺪ ﺳﻠﻤﺎﻥ ﻛﻤﻮﻥ. ﺍﻋﺪﺍﺩ ﺩ ﻛﻠﻴﺔ ﻣﺪﻳﻨﺔ ﺍﻟﻌﻠﻢ ﺍﻟﺠﺎﻣﻌﺔ ﻗﺴﻢ ﺍﻟﻔﻴﺰﻳﺎﺀ ﺍﻟﻄﺒﻴﺔ– ﺍﻟﻤﺮﺣﻠﺔ ﺍﻟﺮﺍﺑﻌﺔ John Van. Meter, Ph. D. Center for Functional and Molecular Imaging Georgetown University Medical Center
Mixing T 1 & T 2 Contrast • What do you get if you use the optimal TR setting for T 1 contrast and the optimal TE setting for T 2 contrast? • T 3 contrast? • No contrast!!
STIR AND FLAIR STIR (Short Time Inversion Recovery) is a pulse sequence where one suppresses the fat signal by applying a pulse 180 o relative the initial B 0 magnetic field and then quickly applying a pulse 90 o relative to B 0 field direction. The time between is called TI (Inversion Time). This combination of pulses doesn't allow the fat to relax in the longitudinal plane hence negating signal from surrounding tissues containing fat.
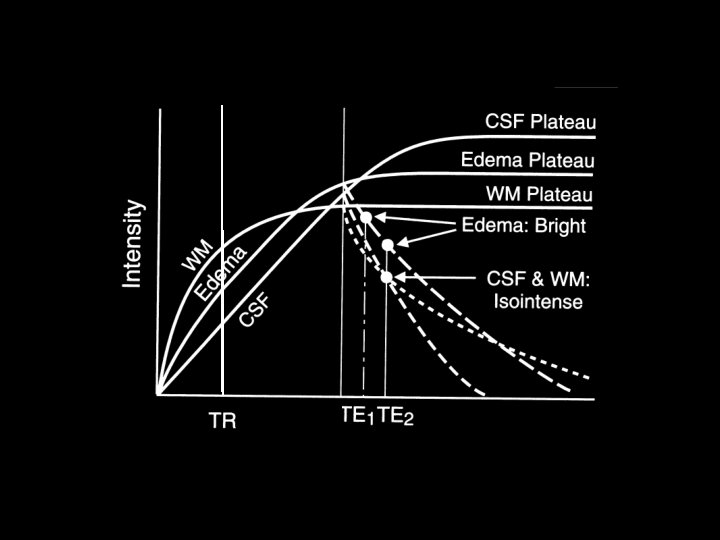
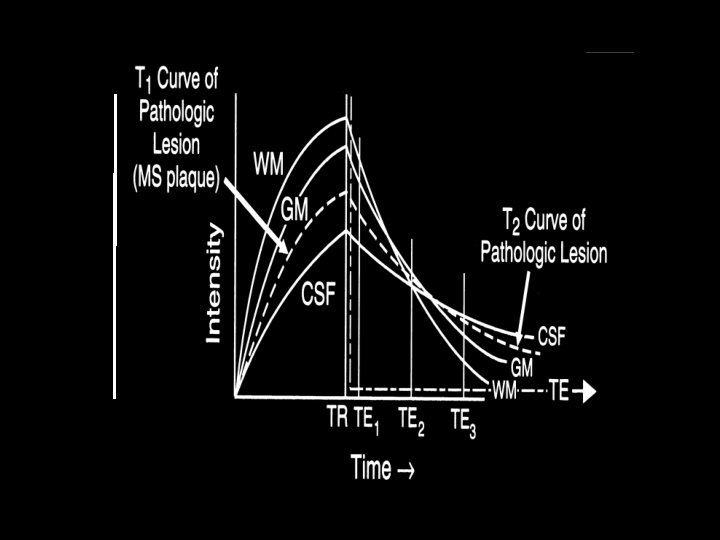
STIR AND FLAIR (Fluid Attenuated Inversion Recovery) is a pulse sequence where one suppresses signal from fluid to make surrounding pathology appear brighter. This is used frequently in MS. Since classic location of plaques in MS is around the ventricles, nulling the signal from CSF allows for easy visualization of plaques. FLAIR sequence uses a TI that is long (close to that of T 2 -weighted image) to suppress fluid from CSF and other fluid filled cavities in the body.
THAT'S IT! Now you should be able to explain MRI in basic terms to someone who doesn't know anything about obtaining images using magnetic resonance. Remember if you forget you can always say this: “Protons resonate or wobble at a certain frequency and when you excite them they relax and emit energy in the form of electromagnetic radiation. The body has different numbers and location of protons in various tissues. When you receive the emitted energy you can map the data onto a matrix. Then you can extrapolate using sine and cosine waves what the body looks like based on the mapped RF pulses emitted by different numbers of protons residing in various tissues (kind of like picturing the music arrangement by looking only at the sound signal on your audio receiver!). ”
(time in 1000’s of ms) Tissue Contrast Dependence on TR, TE Long PDW T 2 TR Short T 1 poor! Short TE Long (time in 10’s of ms)
Damadian’s Discovery • Differential longitudinal relaxation between healthy and tumorous tissue in the rat • Walker sarcoma had longer T 1 relaxation time than healthy brain • Novikoff Hepatoma had shorter T 2 relaxation time than healthy liver
Two Main Classes of Pulse Sequence • Spin Echo (SE) - uses a second RF-pulse to refocus spins – TR & TE control T 1 and T 2 contrast • Gradient Echo (GE) - uses a gradient to refocus spins – Flip Angle & TE control T 1 and T 2* contrast – Used in EPI (f. MRI) sequences
T 2*-Weighting (GE) • Refer to T 2 -weighting in a gradient echo sequence as T 2*-weighting • Because of inhomogeneities in the B 0 magnetic field T 2 relaxation occurs faster using a gradient echo sequence than ‘true T 2 relaxation’ as measured with a spin-echo sequence • The greater the inhomogeneity the faster T 2 decay occurs
T 2*-Weighting (GE) vs T 2 -Weighting (SE)
T 2* Effect Well shimmed Poorly shimmed
Venous Infarct T 1 -Weighted T 2 -Weighted PD-Weighted
Glioblastoma Multiforme T 1 -Weighted T 2 -Weighted
Cerebral Lymphoma T 1 -Weighted T 2 -Weighted
Anaplastic Astrocytoma T 1 -Weighted T 2 -Weighted
Multiple Sclerosis
The MRI Experiment RF time Voltage (Signal) time t Mo Bo z z 90° z y Mo y y x x Mo V(t) x