PLS Vs SVD in Dimensionality Reduction Paul Hsiung


- Slides: 15
PLS Vs. SVD in Dimensionality Reduction Paul Hsiung December 3, 2002 16 -811
Problem • • Curse of dimensionality Very sparse data: • A lot of 0’s • Some attributes irrelevant • Others are repeated • • Many machine learning algorithm are infeasible at high dimensions. Compound dataset example…
SVD Quick Review • • • Find the axis with greatest variance. Project your data unto this axis. Let the top n eigenvectors be the space of your new decomposed data. x 2 e 1 x 1
Partial Least Squares: Intuition 1 • • • SVD max the variance of X, PLS max the covariance of X and Y. SVD does not factor in Y when decomposing. A good picture would be…
Linear Regression • • • Given data output Y, input X Find a w such that w. Tx best approximates Y in the least square sense. The magical formula for w is y w 1 x
PLS: Intuition 2 • • Problem with linear regression is… PLS does as the name says, it finds the least squares except it’s partial. As it builds Bpls, it will decompose X into T We can control how many dimension T has by the number of iterations in PLS
PLS: No Guts, No Glory
PLS: Aftermath • • Collect all small t 1…tn into T. Same for P, B, and W. Notice that T is s x n and that’s our decomposed dataset. We define. R will transform any X into T. Prediction is done by Q is a column of 1’s.
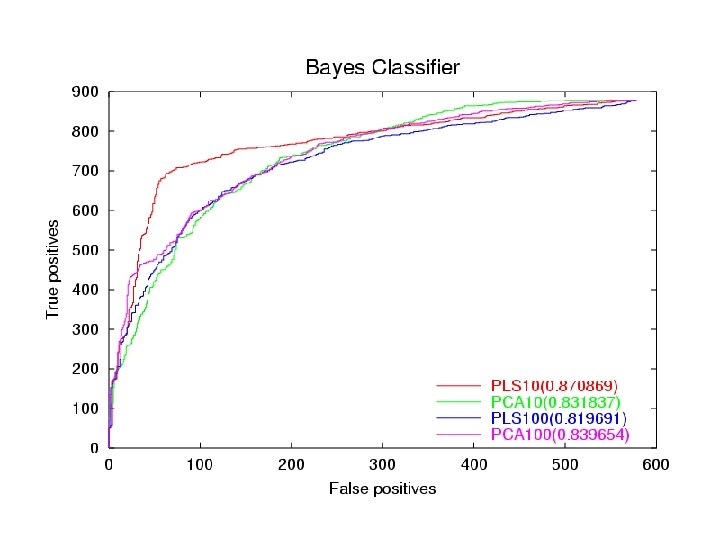
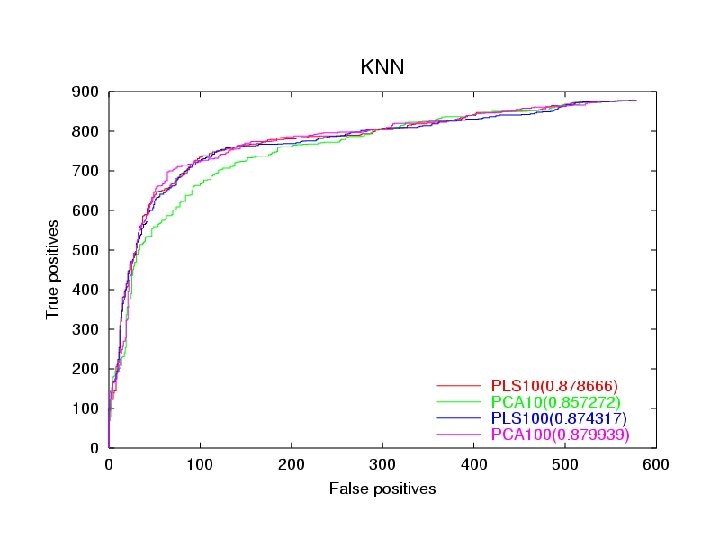
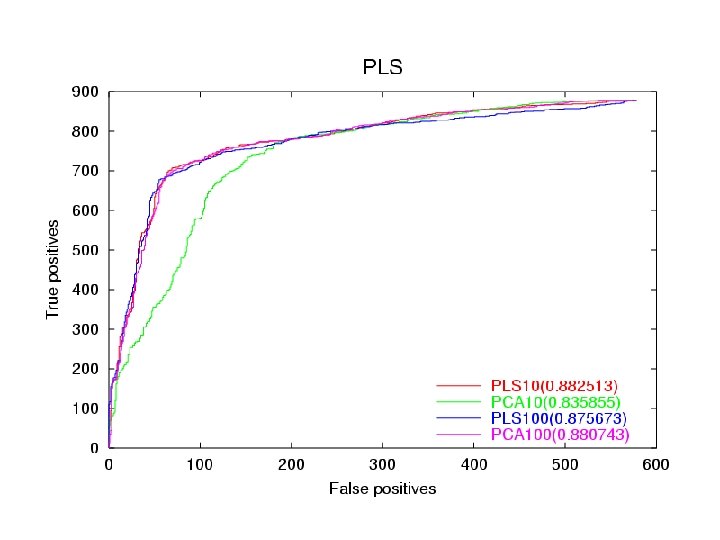
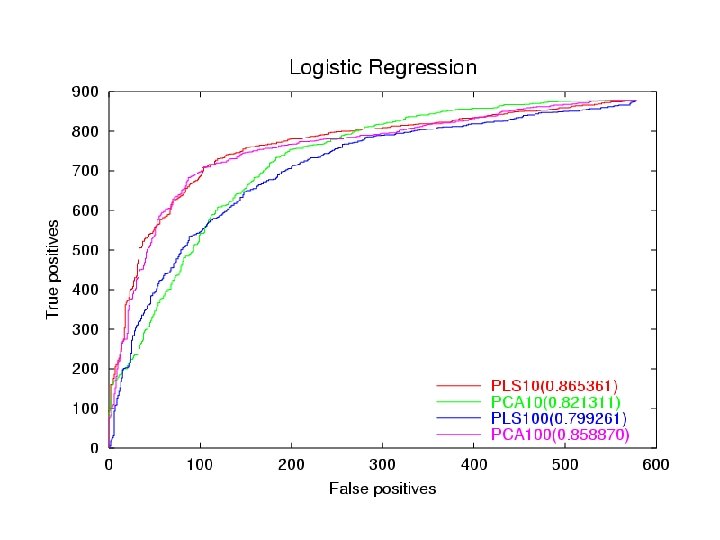
Dataset • • Training set is 26, 000 by 6000. Test is 1, 400 by 6000. Single output Very sparse… lots of 0’s Used ROC curve to rank results.
PLS: Overfitting 5 Dim Predict Training 0. 853 Predict Test 0. 862 10 Dim 0. 927 0. 870 20 Dim 0. 954 0. 866 100 Dim 0. 966 0. 820
Conclusion • • • PLS at dim 10 is equivalent to SVD at dim 100. But SVD is slightly better in the high dimensions. PLS tends to overfit after dim 10. PLS as a predictor works pretty well.