perf SONAR Performance Monitoring Framework Matt Zekauskas mattinternet

- Slides: 35

perf. SONAR Performance Monitoring Framework Matt Zekauskas, matt@internet 2. edu GENI Measurement Workshop June 26, 2009 Madison, Wisconsin

Credits • Jeff Boote, Jason Zurawski, Aaron Brown, Eric Boyd at Internet 2 • Lots of others at UDel, DANTE/GEANT, ESnet, RNP…

perf. SONAR Introduction • Most organizations perform monitoring and diagnostics of their own network • Networking is increasingly a crossdomain effort • Monitoring and diagnostics must also become a cross-domain effort

What is perf. SONAR • An architecture & a set of protocols • Services Oriented Architecture (SOA) • Web Services Interfaces • Protocols being standardized in the OGF NMCWG • Also • A collaboration • Production network operators focused on designing and building tools that they will deploy and use on their networks to provide monitoring and diagnostic capabilities to themselves and their user communities. • Several interoperable software implementations • Java & Perl • A Federated set of Deployed Measurement Infrastructures

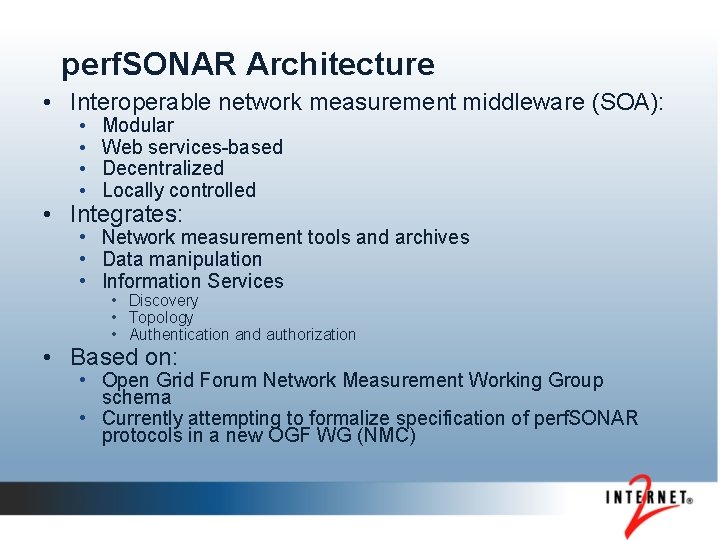
perf. SONAR Architecture • Interoperable network measurement middleware (SOA): • • Modular Web services-based Decentralized Locally controlled • Integrates: • Network measurement tools and archives • Data manipulation • Information Services • Discovery • Topology • Authentication and authorization • Based on: • Open Grid Forum Network Measurement Working Group schema • Currently attempting to formalize specification of perf. SONAR protocols in a new OGF WG (NMC)

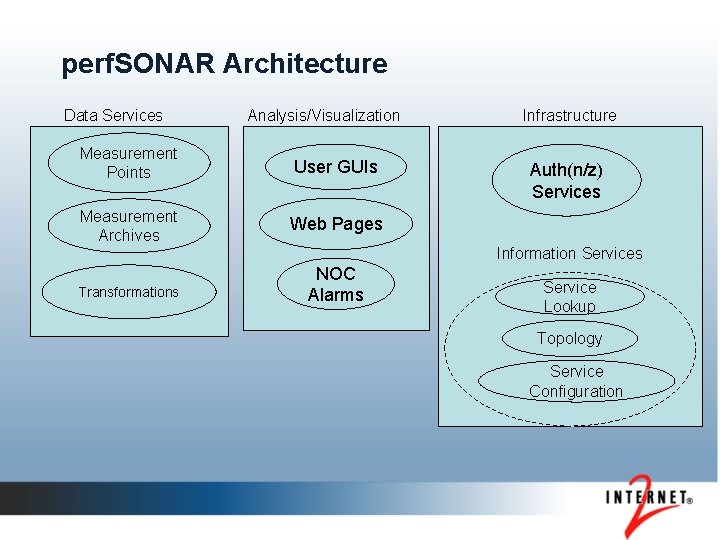
perf. SONAR Architecture Data Services Analysis/Visualization Measurement Points User GUIs Measurement Archives Web Pages Transformations Infrastructure Auth(n/z) Services Information Services NOC Alarms Service Lookup Topology Service Configuration

Decouple 3 phases of a Measurement Infrastructure

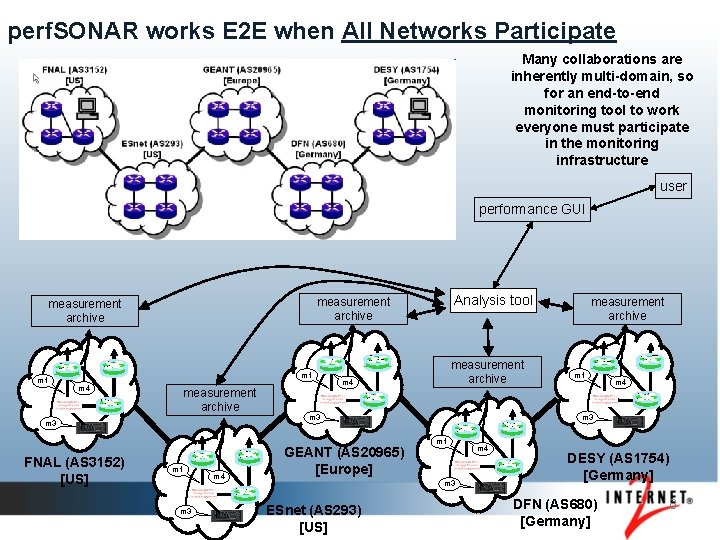
perf. SONAR works E 2 E when All Networks Participate Many collaborations are inherently multi-domain, so for an end-to-end monitoring tool to work everyone must participate in the monitoring infrastructure user performance GUI m 1 m 4 measurement archive m 3 FNAL (AS 3152) [US] Analysis tool measurement archive m 1 m 3 m 4 measurement archive m 4 m 1 m 3 ESnet (AS 293) [US] m 1 m 4 m 3 GEANT (AS 20965) [Europe] measurement archive m 4 DESY (AS 1754) [Germany] DFN (AS 680) [Germany] 8

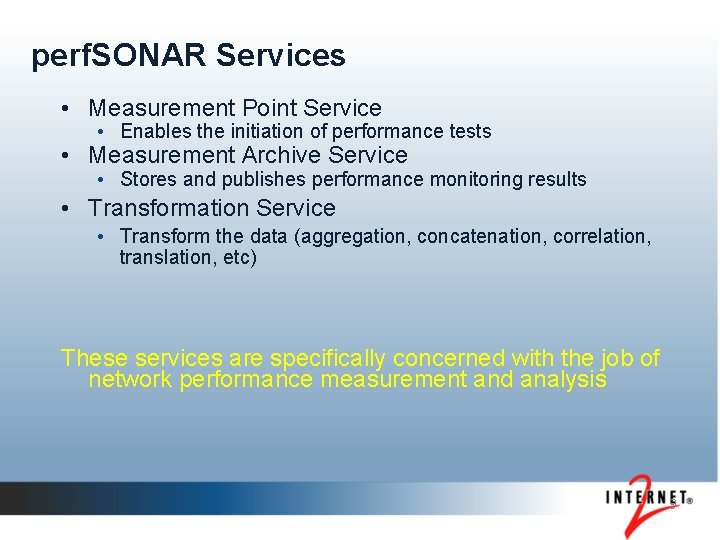
perf. SONAR Services • Measurement Point Service • Enables the initiation of performance tests • Measurement Archive Service • Stores and publishes performance monitoring results • Transformation Service • Transform the data (aggregation, concatenation, correlation, translation, etc) These services are specifically concerned with the job of network performance measurement and analysis 9

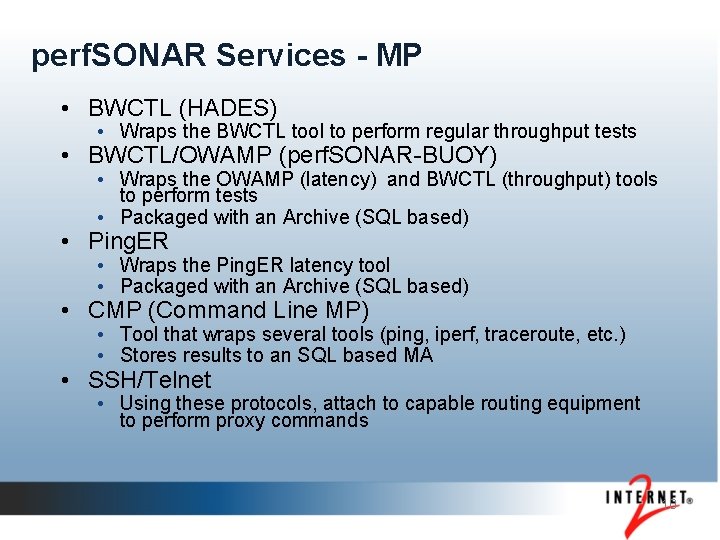
perf. SONAR Services - MP • BWCTL (HADES) • Wraps the BWCTL tool to perform regular throughput tests • BWCTL/OWAMP (perf. SONAR-BUOY) • Wraps the OWAMP (latency) and BWCTL (throughput) tools to perform tests • Packaged with an Archive (SQL based) • Ping. ER • Wraps the Ping. ER latency tool • Packaged with an Archive (SQL based) • CMP (Command Line MP) • Tool that wraps several tools (ping, iperf, traceroute, etc. ) • Stores results to an SQL based MA • SSH/Telnet • Using these protocols, attach to capable routing equipment to perform proxy commands 10

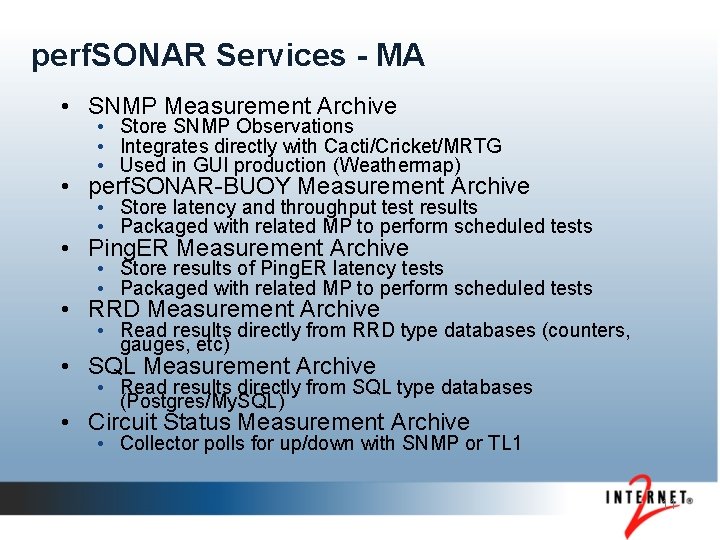
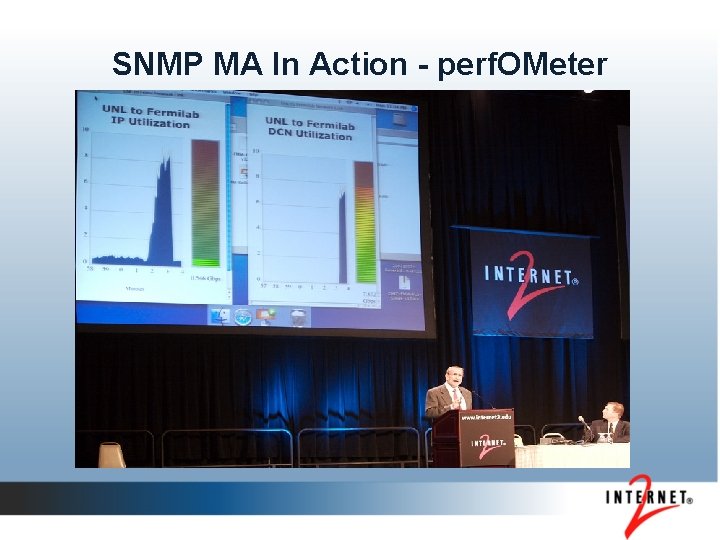
perf. SONAR Services - MA • SNMP Measurement Archive • Store SNMP Observations • Integrates directly with Cacti/Cricket/MRTG • Used in GUI production (Weathermap) • perf. SONAR-BUOY Measurement Archive • Store latency and throughput test results • Packaged with related MP to perform scheduled tests • Ping. ER Measurement Archive • Store results of Ping. ER latency tests • Packaged with related MP to perform scheduled tests • RRD Measurement Archive • Read results directly from RRD type databases (counters, gauges, etc) • SQL Measurement Archive • Read results directly from SQL type databases (Postgres/My. SQL) • Circuit Status Measurement Archive • Collector polls for up/down with SNMP or TL 1 11

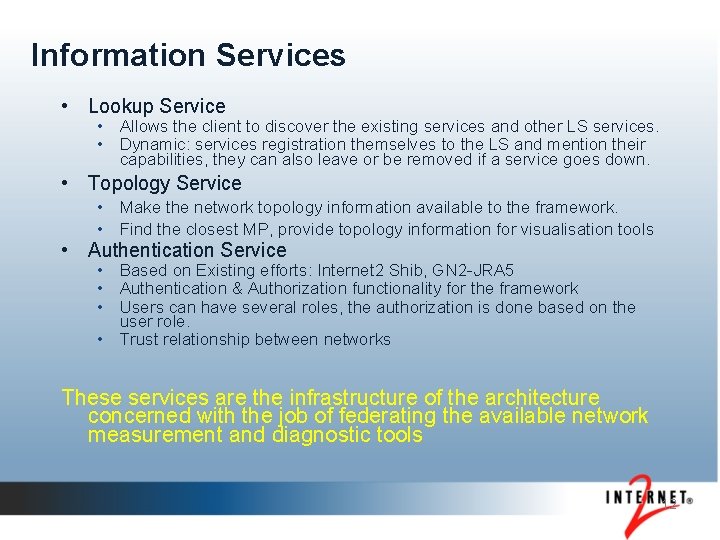
Information Services • Lookup Service • Allows the client to discover the existing services and other LS services. • Dynamic: services registration themselves to the LS and mention their capabilities, they can also leave or be removed if a service goes down. • Topology Service • Make the network topology information available to the framework. • Find the closest MP, provide topology information for visualisation tools • Authentication Service • Based on Existing efforts: Internet 2 Shib, GN 2 -JRA 5 • Authentication & Authorization functionality for the framework • Users can have several roles, the authorization is done based on the user role. • Trust relationship between networks These services are the infrastructure of the architecture concerned with the job of federating the available network measurement and diagnostic tools 12

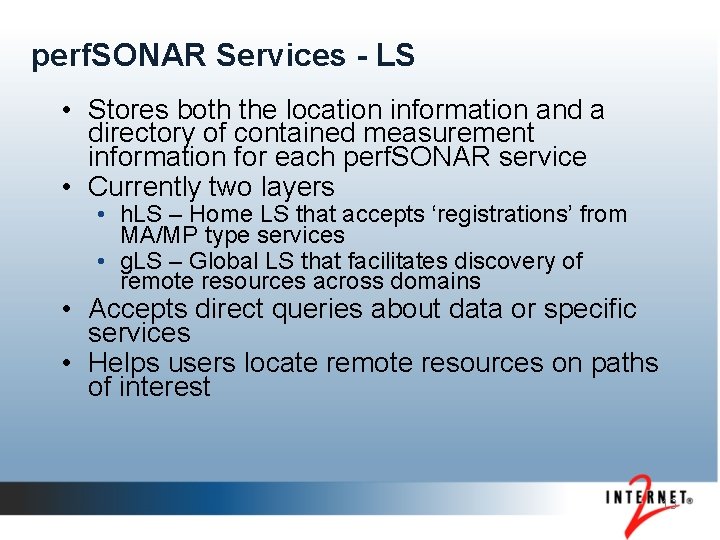
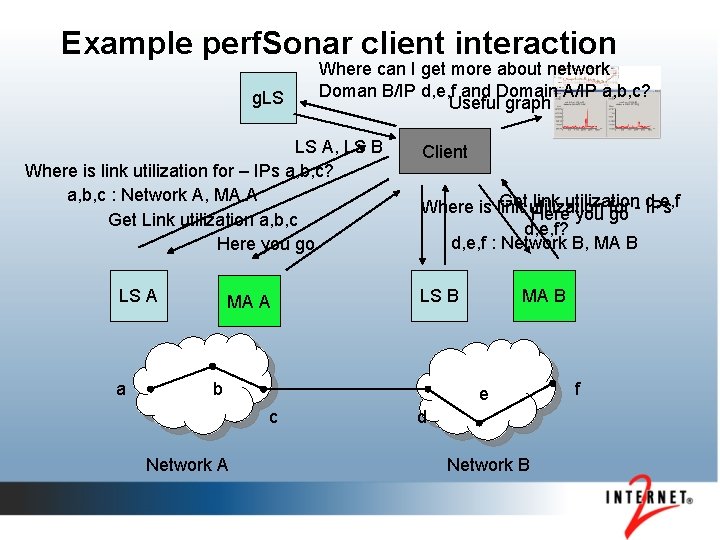
perf. SONAR Services - LS • Stores both the location information and a directory of contained measurement information for each perf. SONAR service • Currently two layers • h. LS – Home LS that accepts ‘registrations’ from MA/MP type services • g. LS – Global LS that facilitates discovery of remote resources across domains • Accepts direct queries about data or specific services • Helps users locate remote resources on paths of interest 13

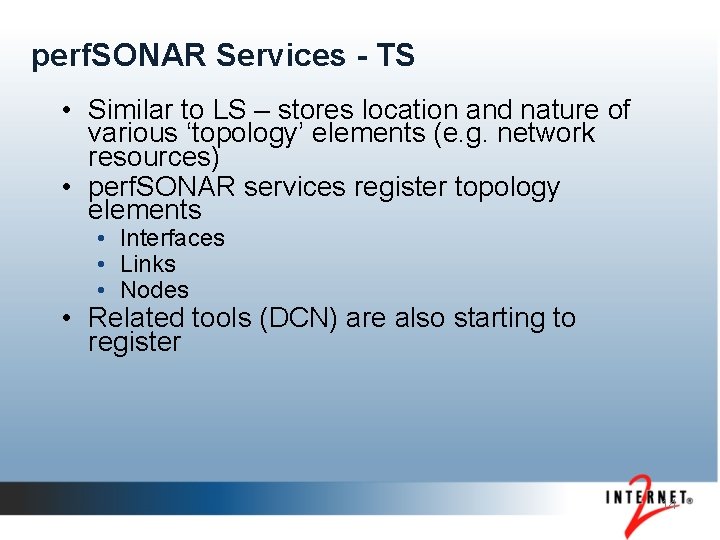
perf. SONAR Services - TS • Similar to LS – stores location and nature of various ‘topology’ elements (e. g. network resources) • perf. SONAR services register topology elements • Interfaces • Links • Nodes • Related tools (DCN) are also starting to register 14

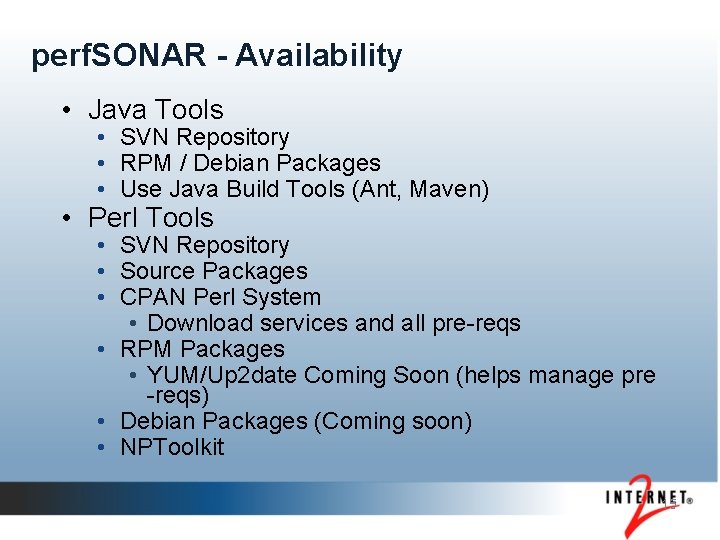
perf. SONAR - Availability • Java Tools • SVN Repository • RPM / Debian Packages • Use Java Build Tools (Ant, Maven) • Perl Tools • SVN Repository • Source Packages • CPAN Perl System • Download services and all pre-reqs • RPM Packages • YUM/Up 2 date Coming Soon (helps manage pre -reqs) • Debian Packages (Coming soon) • NPToolkit 15

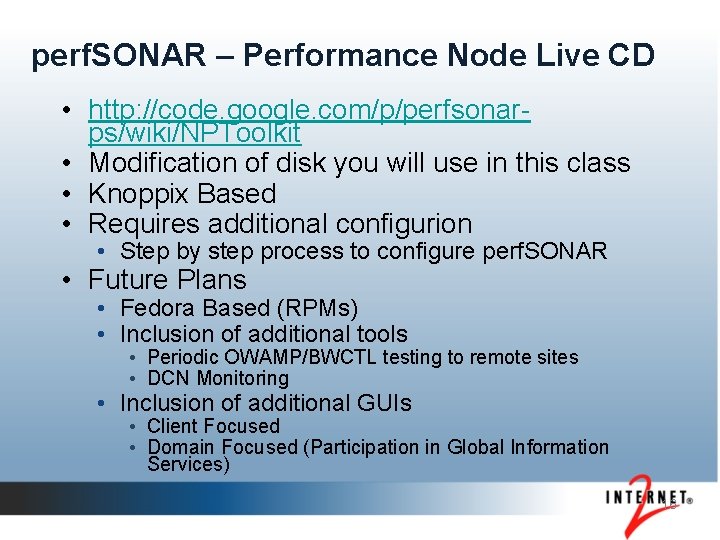
perf. SONAR – Performance Node Live CD • http: //code. google. com/p/perfsonarps/wiki/NPToolkit • Modification of disk you will use in this class • Knoppix Based • Requires additional configurion • Step by step process to configure perf. SONAR • Future Plans • Fedora Based (RPMs) • Inclusion of additional tools • Periodic OWAMP/BWCTL testing to remote sites • DCN Monitoring • Inclusion of additional GUIs • Client Focused • Domain Focused (Participation in Global Information Services) 16

Example perf. Sonar client interaction g. LS Where can I get more about network Doman B/IP d, e, f and Domain A/IP a, b, c? Useful graph LS A, LS B Where is link utilization for – IPs a, b, c? a, b, c : Network A, MA A Get Link utilization a, b, c Here you go LS A a MA A Client Get utilization link utilization d, e, f Where is link for Here you go IPs d, e, f? d, e, f : Network B, MA B LS B b e c Network A MA B d Network B f

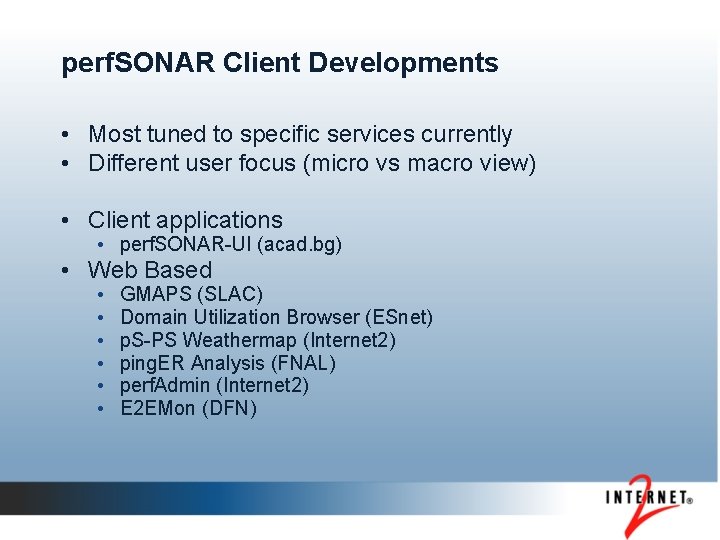
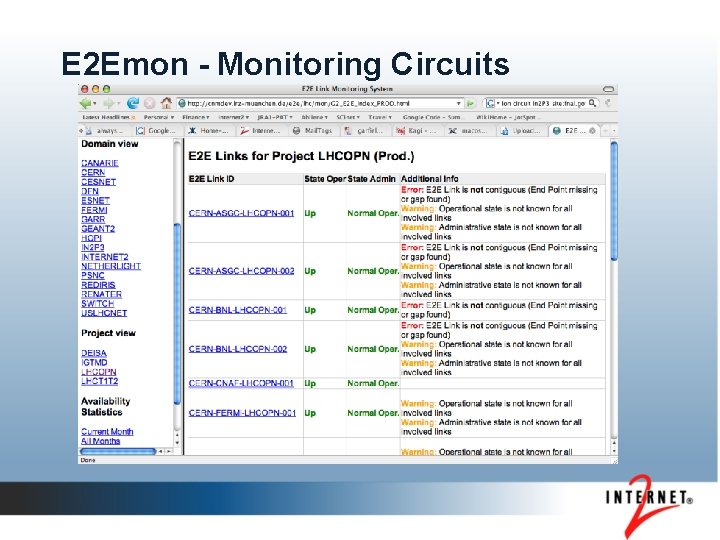
perf. SONAR Client Developments • Most tuned to specific services currently • Different user focus (micro vs macro view) • Client applications • perf. SONAR-UI (acad. bg) • Web Based • • • GMAPS (SLAC) Domain Utilization Browser (ESnet) p. S-PS Weathermap (Internet 2) ping. ER Analysis (FNAL) perf. Admin (Internet 2) E 2 EMon (DFN)

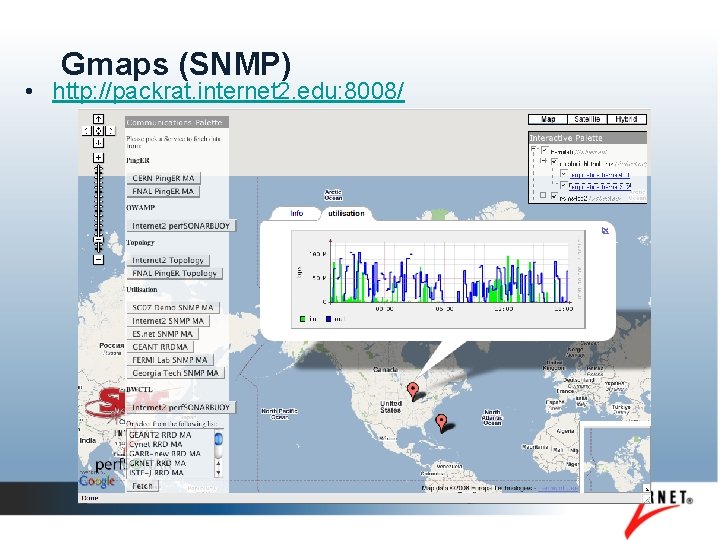
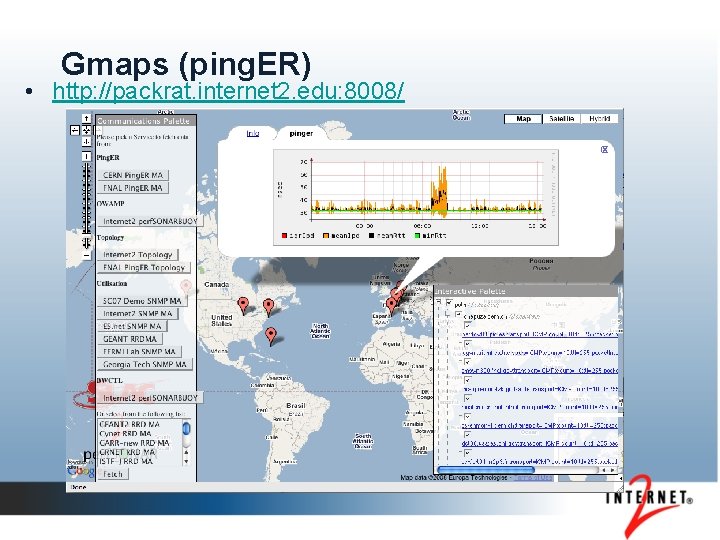
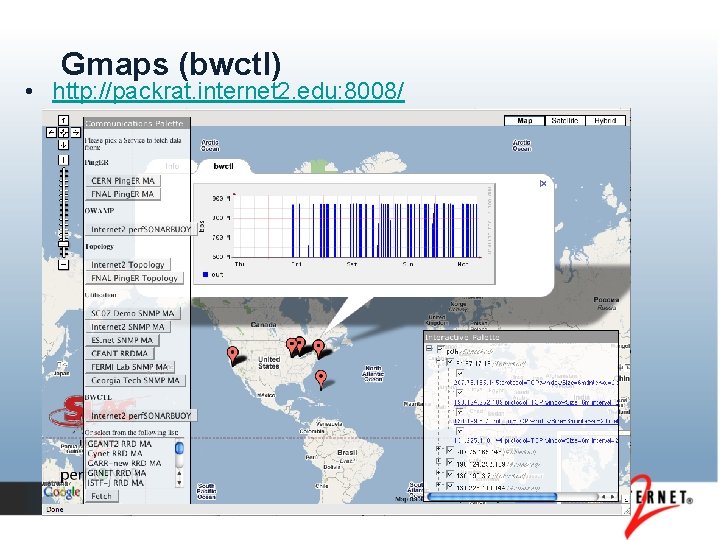
Data Views • These are very quick GUI’s we set up to show what is ‘possible’ • The fact that the data is available (and known due to the LS) means that analysis clients are more easy to write and tune for specific user communities

SNMP MA In Action - perf. OMeter

Gmaps (SNMP) • http: //packrat. internet 2. edu: 8008/

Gmaps (ping. ER) • http: //packrat. internet 2. edu: 8008/

Gmaps (bwctl) • http: //packrat. internet 2. edu: 8008/

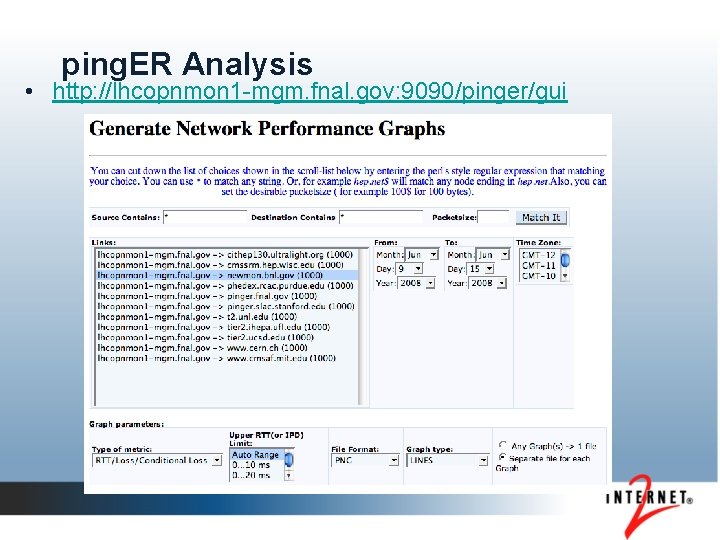
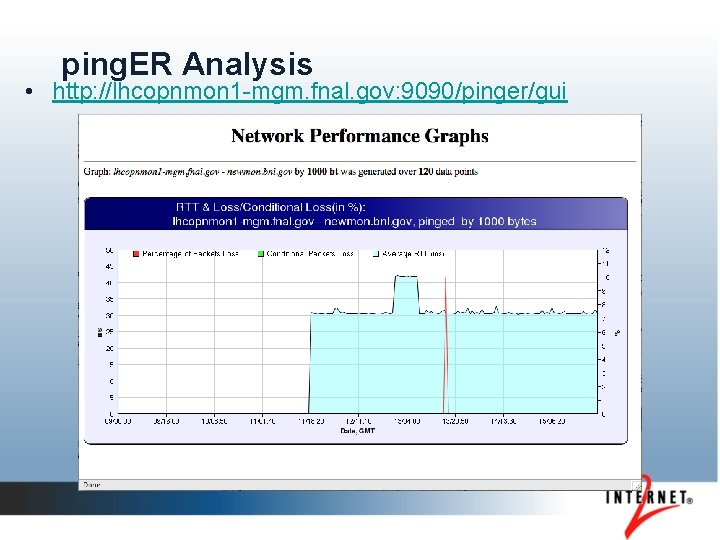
ping. ER Analysis • http: //lhcopnmon 1 -mgm. fnal. gov: 9090/pinger/gui

ping. ER Analysis • http: //lhcopnmon 1 -mgm. fnal. gov: 9090/pinger/gui

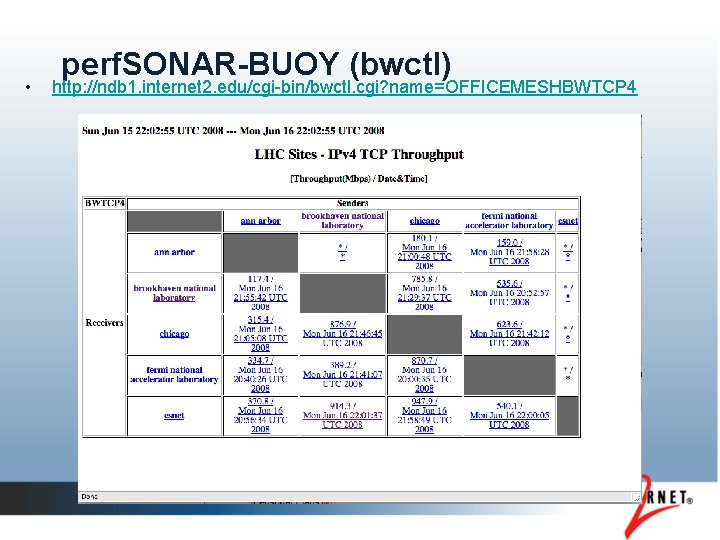
• perf. SONAR-BUOY (bwctl) http: //ndb 1. internet 2. edu/cgi-bin/bwctl. cgi? name=OFFICEMESHBWTCP 4

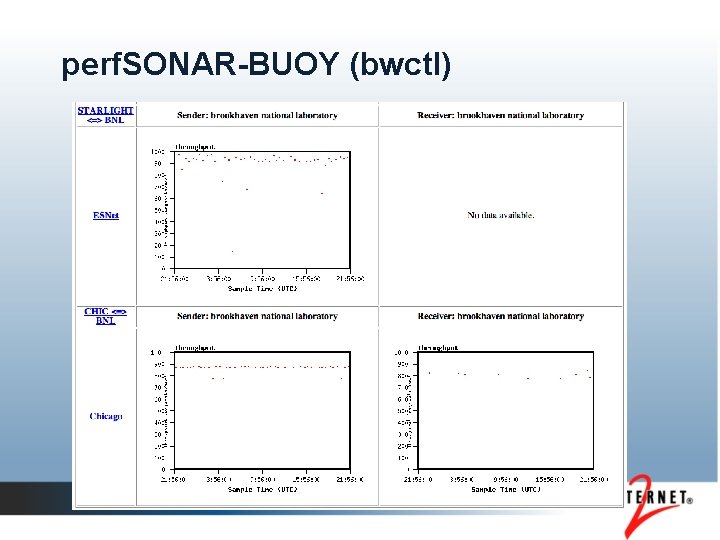
perf. SONAR-BUOY (bwctl)

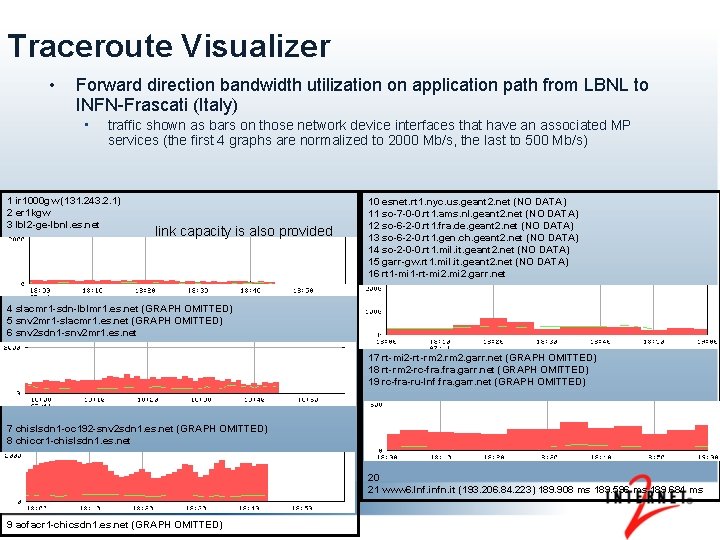
Traceroute Visualizer • Forward direction bandwidth utilization on application path from LBNL to INFN-Frascati (Italy) • traffic shown as bars on those network device interfaces that have an associated MP services (the first 4 graphs are normalized to 2000 Mb/s, the last to 500 Mb/s) 1 ir 1000 gw (131. 243. 2. 1) 2 er 1 kgw 3 lbl 2 -ge-lbnl. es. net link capacity is also provided 10 esnet. rt 1. nyc. us. geant 2. net (NO DATA) 11 so-7 -0 -0. rt 1. ams. nl. geant 2. net (NO DATA) 12 so-6 -2 -0. rt 1. fra. de. geant 2. net (NO DATA) 13 so-6 -2 -0. rt 1. gen. ch. geant 2. net (NO DATA) 14 so-2 -0 -0. rt 1. mil. it. geant 2. net (NO DATA) 15 garr-gw. rt 1. mil. it. geant 2. net (NO DATA) 16 rt 1 -mi 1 -rt-mi 2. garr. net 4 slacmr 1 -sdn-lblmr 1. es. net (GRAPH OMITTED) 5 snv 2 mr 1 -slacmr 1. es. net (GRAPH OMITTED) 6 snv 2 sdn 1 -snv 2 mr 1. es. net 17 rt-mi 2 -rt-rm 2. garr. net (GRAPH OMITTED) 18 rt-rm 2 -rc-fra. garr. net (GRAPH OMITTED) 19 rc-fra-ru-lnf. fra. garr. net (GRAPH OMITTED) 7 chislsdn 1 -oc 192 -snv 2 sdn 1. es. net (GRAPH OMITTED) 8 chiccr 1 -chislsdn 1. es. net 20 21 www 6. lnf. infn. it (193. 206. 84. 223) 189. 908 ms 189. 596 ms 189. 684 ms 9 aofacr 1 -chicsdn 1. es. net (GRAPH OMITTED)

E 2 Emon - Monitoring Circuits

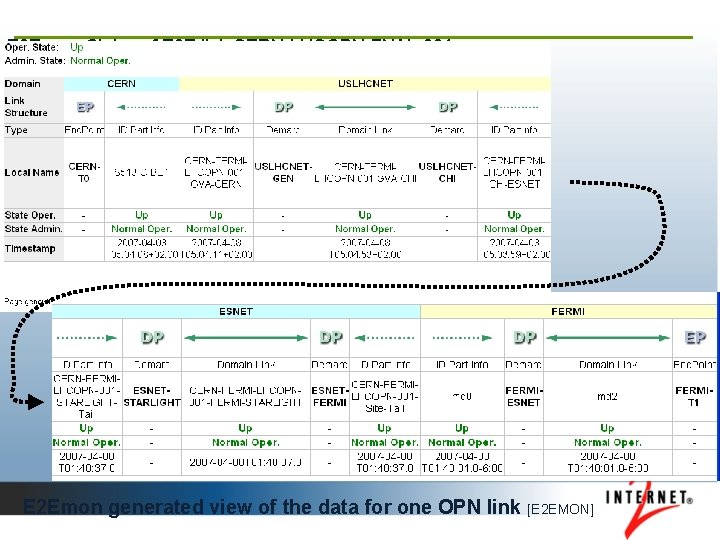
E 2 Emon: Status of E 2 E link CERN-LHCOPN-FNAL-001 E 2 Emon generated view of the data for one OPN link [E 2 EMON]

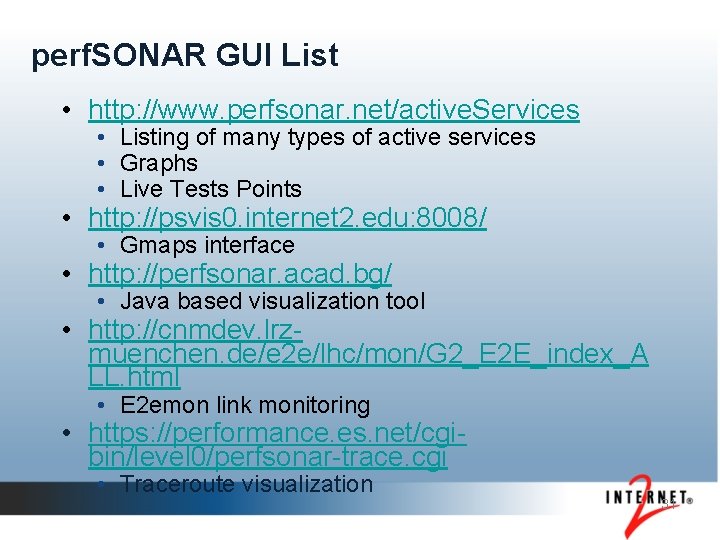
perf. SONAR GUI List • http: //www. perfsonar. net/active. Services • Listing of many types of active services • Graphs • Live Tests Points • http: //psvis 0. internet 2. edu: 8008/ • Gmaps interface • http: //perfsonar. acad. bg/ • Java based visualization tool • http: //cnmdev. lrzmuenchen. de/e 2 e/lhc/mon/G 2_E 2 E_index_A LL. html • E 2 emon link monitoring • https: //performance. es. net/cgibin/level 0/perfsonar-trace. cgi • Traceroute visualization 31

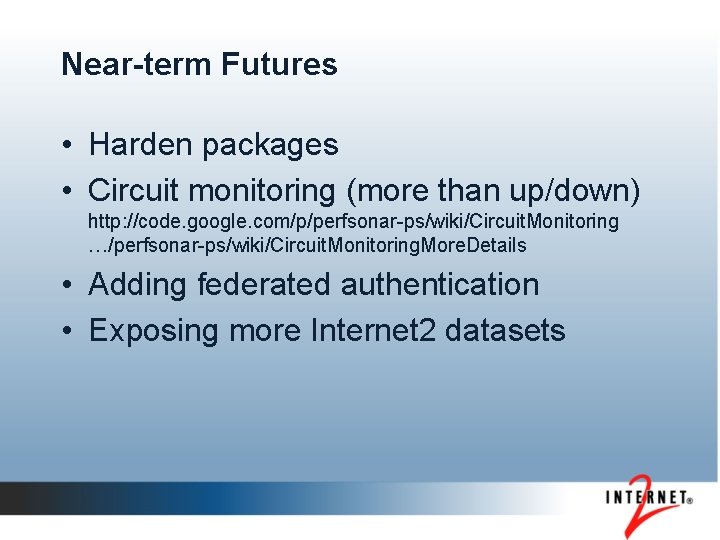
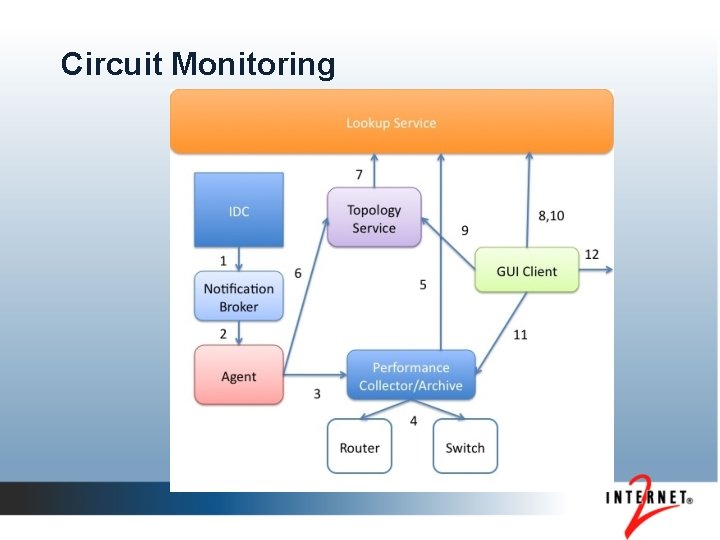
Near-term Futures • Harden packages • Circuit monitoring (more than up/down) http: //code. google. com/p/perfsonar-ps/wiki/Circuit. Monitoring …/perfsonar-ps/wiki/Circuit. Monitoring. More. Details • Adding federated authentication • Exposing more Internet 2 datasets

Circuit Monitoring

Conclusions Summary • Open Source licenses and development model • Interfaces for any application to consume the data • Partners are committed to supporting these tools • Potential GENI base, or provide supplemental data More information http: //www. internet 2. edu/performa nce/p. S-PS Internet 2 Community Performance WG https: //mail. internet 2. edu/wws/inf o/performance-announce
