perf SONAR Monitoring for LHCONE Shawn Mc KeeUniversity


- Slides: 34

perf. SONAR Monitoring for LHCONE Shawn Mc. Kee/University of Michigan LHCONE Meeting Ann Arbor, Michigan September 15 th, 2014

Overview of Talk T Status of perf. SONAR Monitoring for LHCONE T Debugging Process To-date T OSG Network Service q Overview of Datastore, OMD and mesh-configuration (Soichi) q OSG Subnet for monitoring on LHCONE? ? T Discussion LHCONE-Ann Arbor-Shawn Mc. Kee September 15, 2014 2

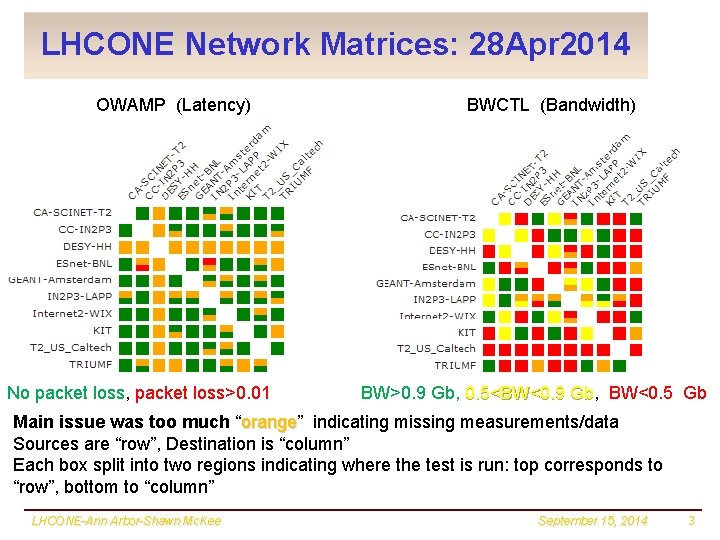
LHCONE Network Matrices: 28 Apr 2014 OWAMP (Latency) No packet loss, packet loss>0. 01 BWCTL (Bandwidth) BW>0. 9 Gb, 0. 5<BW<0. 9 Gb, Gb BW<0. 5 Gb Main issue was too much “orange” orange indicating missing measurements/data Sources are “row”, Destination is “column” Each box split into two regions indicating where the test is run: top corresponds to “row”, bottom to “column” LHCONE-Ann Arbor-Shawn Mc. Kee September 15, 2014 3

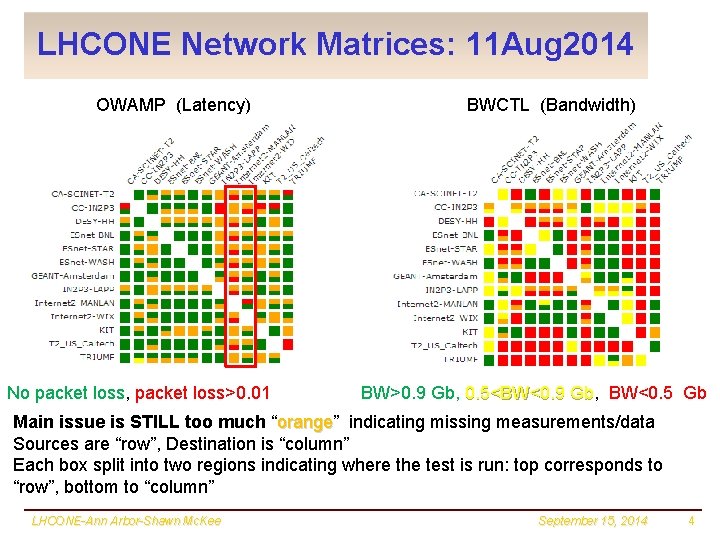
LHCONE Network Matrices: 11 Aug 2014 OWAMP (Latency) No packet loss, packet loss>0. 01 BWCTL (Bandwidth) BW>0. 9 Gb, 0. 5<BW<0. 9 Gb, Gb BW<0. 5 Gb Main issue is STILL too much “orange” orange indicating missing measurements/data Sources are “row”, Destination is “column” Each box split into two regions indicating where the test is run: top corresponds to “row”, bottom to “column” LHCONE-Ann Arbor-Shawn Mc. Kee September 15, 2014 4

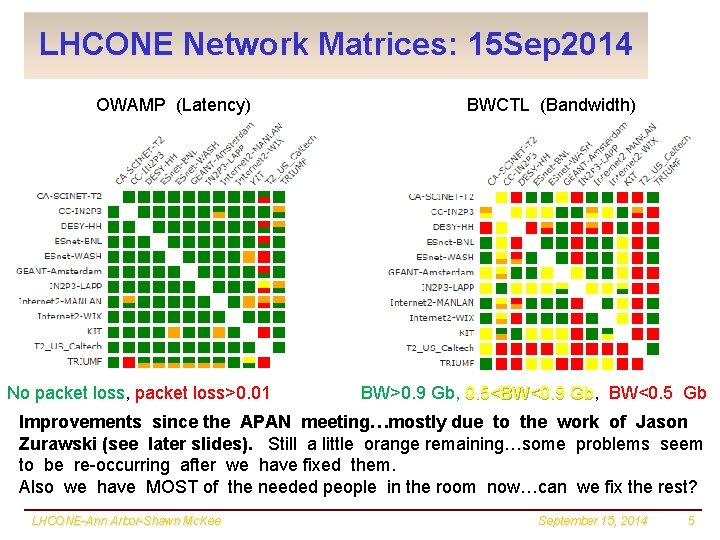
LHCONE Network Matrices: 15 Sep 2014 OWAMP (Latency) No packet loss, packet loss>0. 01 BWCTL (Bandwidth) BW>0. 9 Gb, 0. 5<BW<0. 9 Gb, Gb BW<0. 5 Gb Improvements since the APAN meeting…mostly due to the work of Jason Zurawski (see later slides). Still a little orange remaining…some problems seem to be re-occurring after we have fixed them. Also we have MOST of the needed people in the room now…can we fix the rest? LHCONE-Ann Arbor-Shawn Mc. Kee September 15, 2014 5

Monitoring the TA Link Outage Slides from Jason Zurawski/ESnet

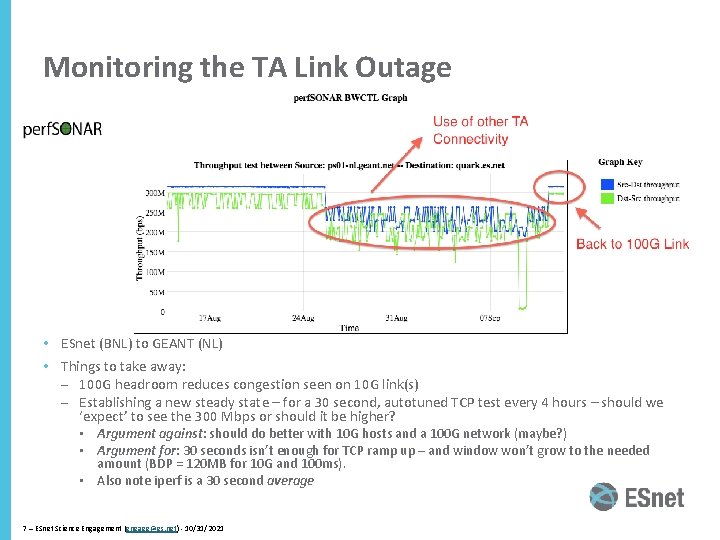
Monitoring the TA Link Outage • ESnet (BNL) to GEANT (NL) • Things to take away: – 100 G headroom reduces congestion seen on 10 G link(s) – Establishing a new steady state – for a 30 second, autotuned TCP test every 4 hours – should we ‘expect’ to see the 300 Mbps or should it be higher? • Argument against: should do better with 10 G hosts and a 100 G network (maybe? ) • Argument for: 30 seconds isn’t enough for TCP ramp up – and window won’t grow to the needed amount (BDP = 120 MB for 10 G and 100 ms). • Also note iperf is a 30 second average 7 – ESnet Science Engagement (engage@es. net) - 10/31/2021

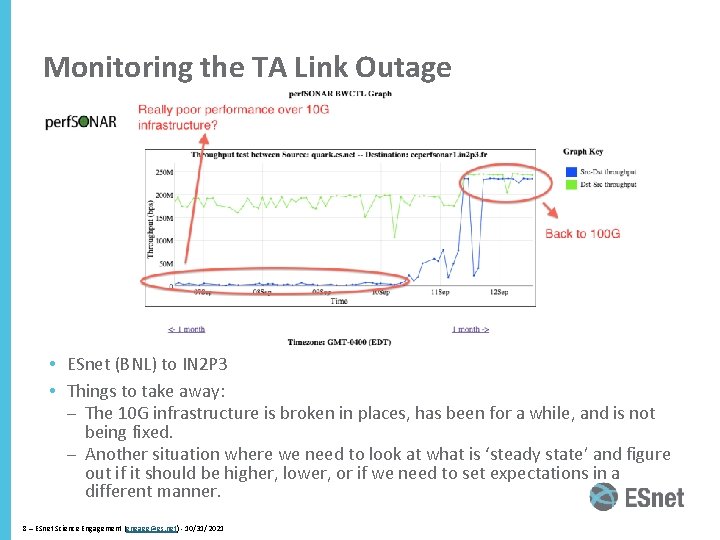
Monitoring the TA Link Outage • ESnet (BNL) to IN 2 P 3 • Things to take away: – The 10 G infrastructure is broken in places, has been for a while, and is not being fixed. – Another situation where we need to look at what is ‘steady state’ and figure out if it should be higher, lower, or if we need to set expectations in a different manner. 8 – ESnet Science Engagement (engage@es. net) - 10/31/2021

LHCONE Dashboard Slides

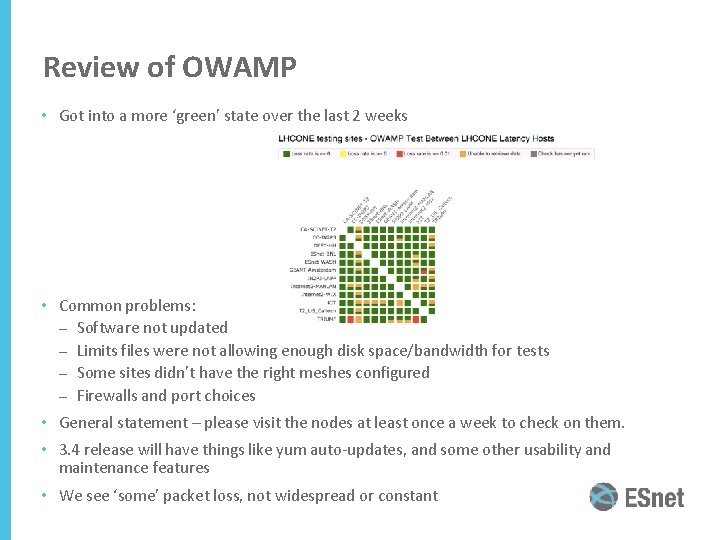
Review of OWAMP • Got into a more ‘green’ state over the last 2 weeks • Common problems: – Software not updated – Limits files were not allowing enough disk space/bandwidth for tests – Some sites didn’t have the right meshes configured – Firewalls and port choices • General statement – please visit the nodes at least once a week to check on them. • 3. 4 release will have things like yum auto-updates, and some other usability and maintenance features • We see ‘some’ packet loss, not widespread or constant

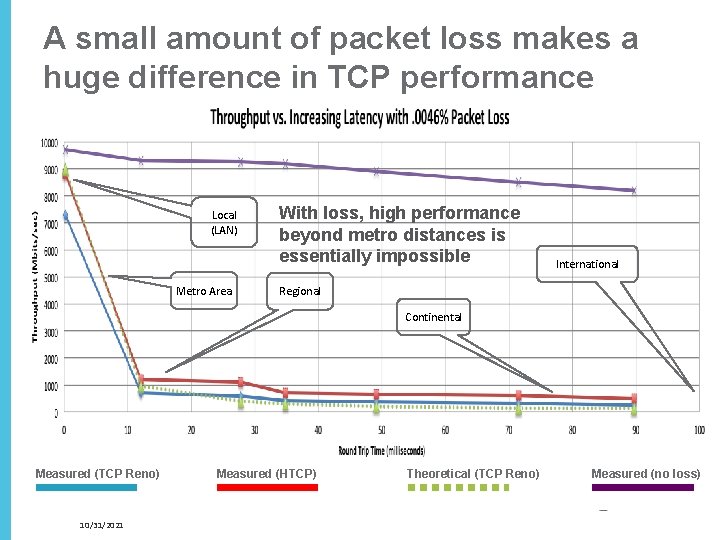
A small amount of packet loss makes a huge difference in TCP performance Local (LAN) Metro Area With loss, high performance beyond metro distances is essentially impossible International Regional Continental Measured (TCP Reno) 10/31/2021 Measured (HTCP) Theoretical (TCP Reno) Measured (no loss)

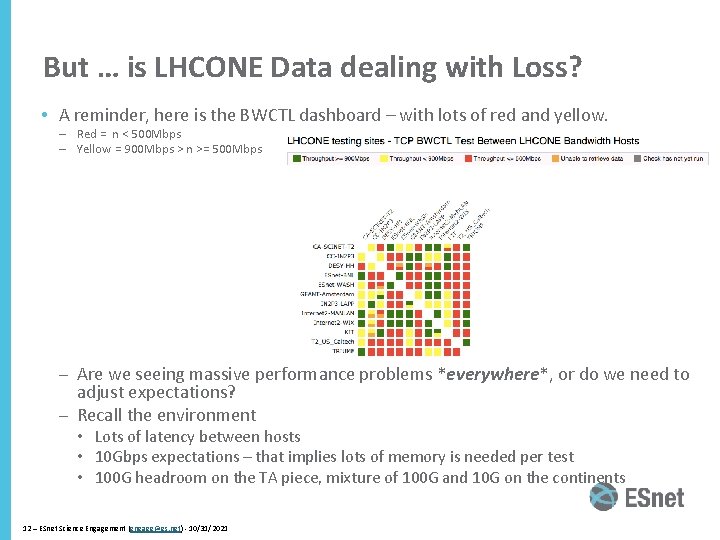
But … is LHCONE Data dealing with Loss? • A reminder, here is the BWCTL dashboard – with lots of red and yellow. – – Red = n < 500 Mbps Yellow = 900 Mbps > n >= 500 Mbps – Are we seeing massive performance problems *everywhere*, or do we need to adjust expectations? – Recall the environment • Lots of latency between hosts • 10 Gbps expectations – that implies lots of memory is needed per test • 100 G headroom on the TA piece, mixture of 100 G and 10 G on the continents 12 – ESnet Science Engagement (engage@es. net) - 10/31/2021

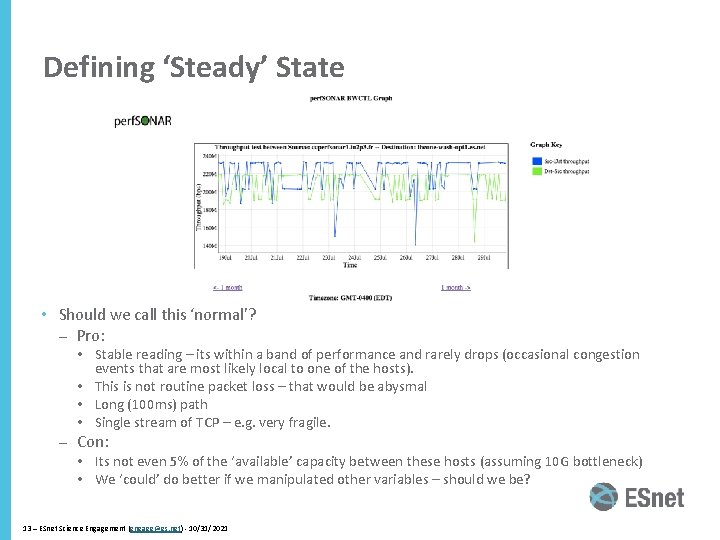
Defining ‘Steady’ State • Should we call this ‘normal’? – Pro: • Stable reading – its within a band of performance and rarely drops (occasional congestion events that are most likely local to one of the hosts). • This is not routine packet loss – that would be abysmal • Long (100 ms) path • Single stream of TCP – e. g. very fragile. – Con: • Its not even 5% of the ‘available’ capacity between these hosts (assuming 10 G bottleneck) • We ‘could’ do better if we manipulated other variables – should we be? 13 – ESnet Science Engagement (engage@es. net) - 10/31/2021

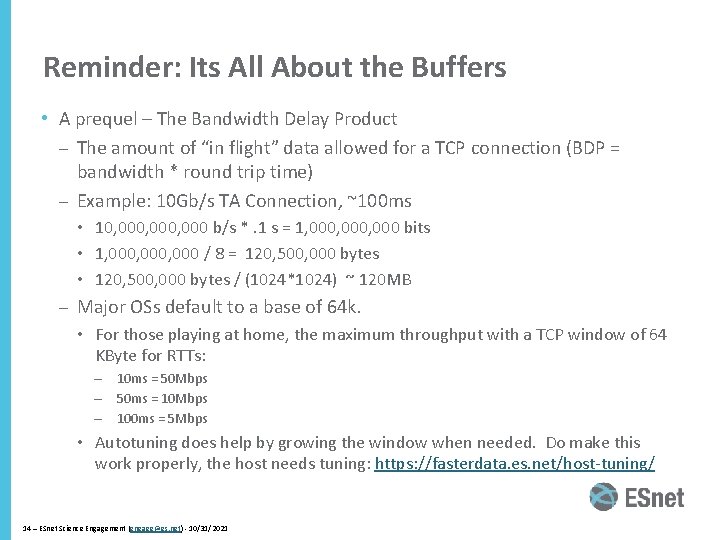
Reminder: Its All About the Buffers • A prequel – The Bandwidth Delay Product – The amount of “in flight” data allowed for a TCP connection (BDP = bandwidth * round trip time) – Example: 10 Gb/s TA Connection, ~100 ms • 10, 000, 000 b/s *. 1 s = 1, 000, 000 bits • 1, 000, 000 / 8 = 120, 500, 000 bytes • 120, 500, 000 bytes / (1024*1024) ~ 120 MB – Major OSs default to a base of 64 k. • For those playing at home, the maximum throughput with a TCP window of 64 KByte for RTTs: – 10 ms = 50 Mbps – 50 ms = 10 Mbps – 100 ms = 5 Mbps • Autotuning does help by growing the window when needed. Do make this work properly, the host needs tuning: https: //fasterdata. es. net/host-tuning/ 14 – ESnet Science Engagement (engage@es. net) - 10/31/2021

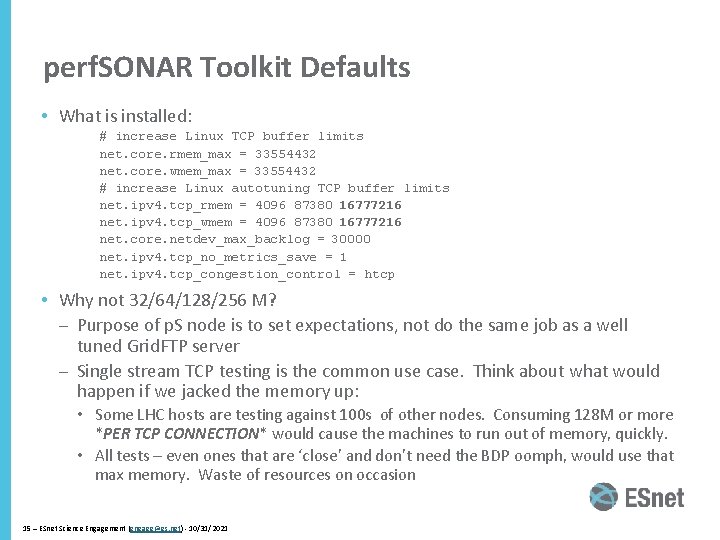
perf. SONAR Toolkit Defaults • What is installed: # increase Linux TCP buffer limits net. core. rmem_max = 33554432 net. core. wmem_max = 33554432 # increase Linux autotuning TCP buffer limits net. ipv 4. tcp_rmem = 4096 87380 16777216 net. ipv 4. tcp_wmem = 4096 87380 16777216 net. core. netdev_max_backlog = 30000 net. ipv 4. tcp_no_metrics_save = 1 net. ipv 4. tcp_congestion_control = htcp • Why not 32/64/128/256 M? – Purpose of p. S node is to set expectations, not do the same job as a well tuned Grid. FTP server – Single stream TCP testing is the common use case. Think about what would happen if we jacked the memory up: • Some LHC hosts are testing against 100 s of other nodes. Consuming 128 M or more *PER TCP CONNECTION* would cause the machines to run out of memory, quickly. • All tests – even ones that are ‘close’ and don’t need the BDP oomph, would use that max memory. Waste of resources on occasion 15 – ESnet Science Engagement (engage@es. net) - 10/31/2021

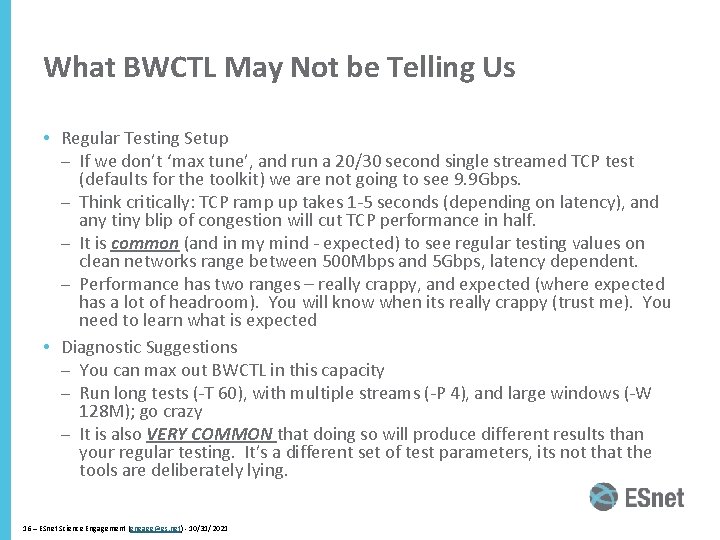
What BWCTL May Not be Telling Us • Regular Testing Setup – If we don’t ‘max tune’, and run a 20/30 second single streamed TCP test (defaults for the toolkit) we are not going to see 9. 9 Gbps. – Think critically: TCP ramp up takes 1 -5 seconds (depending on latency), and any tiny blip of congestion will cut TCP performance in half. – It is common (and in my mind - expected) to see regular testing values on clean networks range between 500 Mbps and 5 Gbps, latency dependent. – Performance has two ranges – really crappy, and expected (where expected has a lot of headroom). You will know when its really crappy (trust me). You need to learn what is expected • Diagnostic Suggestions – You can max out BWCTL in this capacity – Run long tests (-T 60), with multiple streams (-P 4), and large windows (-W 128 M); go crazy – It is also VERY COMMON that doing so will produce different results than your regular testing. It’s a different set of test parameters, its not that the tools are deliberately lying. 16 – ESnet Science Engagement (engage@es. net) - 10/31/2021

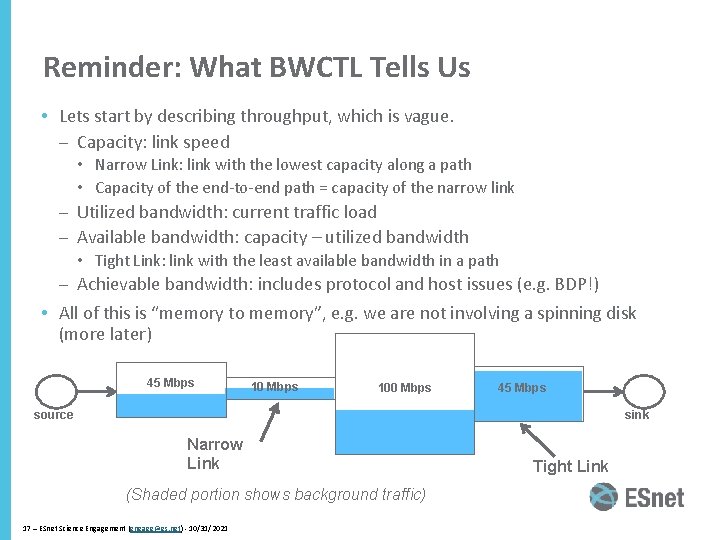
Reminder: What BWCTL Tells Us • Lets start by describing throughput, which is vague. – Capacity: link speed • Narrow Link: link with the lowest capacity along a path • Capacity of the end-to-end path = capacity of the narrow link – Utilized bandwidth: current traffic load – Available bandwidth: capacity – utilized bandwidth • Tight Link: link with the least available bandwidth in a path – Achievable bandwidth: includes protocol and host issues (e. g. BDP!) • All of this is “memory to memory”, e. g. we are not involving a spinning disk (more later) 45 Mbps 100 Mbps 45 Mbps source sink Narrow Link (Shaded portion shows background traffic) 17 – ESnet Science Engagement (engage@es. net) - 10/31/2021 Tight Link

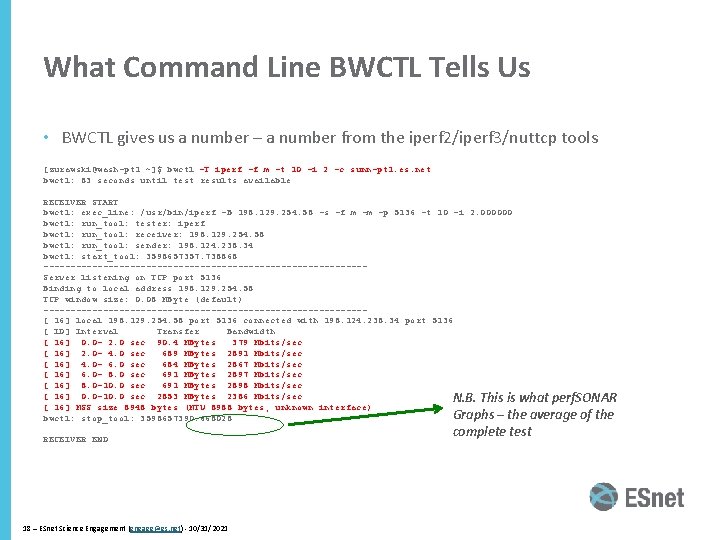
What Command Line BWCTL Tells Us • BWCTL gives us a number – a number from the iperf 2/iperf 3/nuttcp tools [zurawski@wash-pt 1 ~]$ bwctl -T iperf -f m -t 10 -i 2 -c sunn-pt 1. es. net bwctl: 83 seconds until test results available RECEIVER START bwctl: exec_line: /usr/bin/iperf -B 198. 129. 254. 58 -s -f m -m -p 5136 -t 10 -i 2. 000000 bwctl: run_tool: tester: iperf bwctl: run_tool: receiver: 198. 129. 254. 58 bwctl: run_tool: sender: 198. 124. 238. 34 bwctl: start_tool: 3598657357. 738868 ------------------------------Server listening on TCP port 5136 Binding to local address 198. 129. 254. 58 TCP window size: 0. 08 MByte (default) ------------------------------[ 16] local 198. 129. 254. 58 port 5136 connected with 198. 124. 238. 34 port 5136 [ ID] Interval Transfer Bandwidth [ 16] 0. 0 - 2. 0 sec 90. 4 MBytes 379 Mbits/sec [ 16] 2. 0 - 4. 0 sec 689 MBytes 2891 Mbits/sec [ 16] 4. 0 - 6. 0 sec 684 MBytes 2867 Mbits/sec [ 16] 6. 0 - 8. 0 sec 691 MBytes 2897 Mbits/sec [ 16] 8. 0 -10. 0 sec 691 MBytes 2898 Mbits/sec [ 16] 0. 0 -10. 0 sec 2853 MBytes 2386 Mbits/sec N. B. This is what perf. SONAR [ 16] MSS size 8948 bytes (MTU 8988 bytes, unknown interface) Graphs – the average of the bwctl: stop_tool: 3598657390. 668028 RECEIVER END 18 – ESnet Science Engagement (engage@es. net) - 10/31/2021 complete test

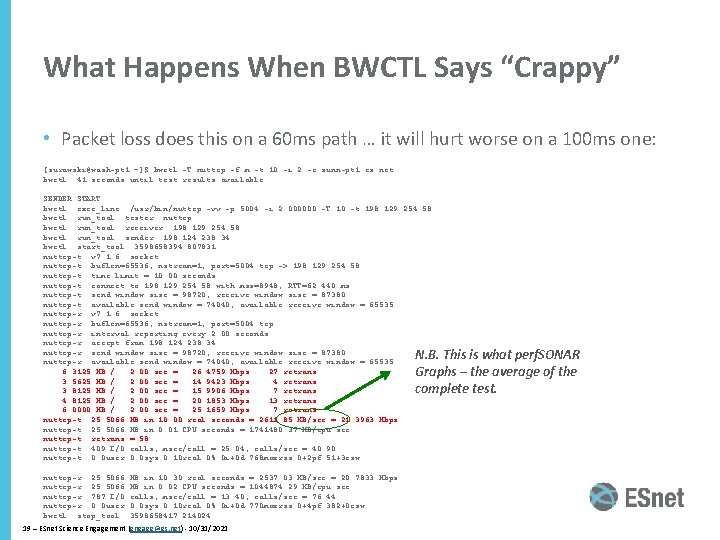
What Happens When BWCTL Says “Crappy” • Packet loss does this on a 60 ms path … it will hurt worse on a 100 ms one: [zurawski@wash-pt 1 ~]$ bwctl -T nuttcp -f m -t 10 -i 2 -c sunn-pt 1. es. net bwctl: 41 seconds until test results available SENDER START bwctl: exec_line: /usr/bin/nuttcp -vv -p 5004 -i 2. 000000 -T 10 -t 198. 129. 254. 58 bwctl: run_tool: tester: nuttcp bwctl: run_tool: receiver: 198. 129. 254. 58 bwctl: run_tool: sender: 198. 124. 238. 34 bwctl: start_tool: 3598658394. 807831 nuttcp-t: v 7. 1. 6: socket nuttcp-t: buflen=65536, nstream=1, port=5004 tcp -> 198. 129. 254. 58 nuttcp-t: time limit = 10. 00 seconds nuttcp-t: connect to 198. 129. 254. 58 with mss=8948, RTT=62. 440 ms nuttcp-t: send window size = 98720, receive window size = 87380 nuttcp-t: available send window = 74040, available receive window = 65535 nuttcp-r: v 7. 1. 6: socket nuttcp-r: buflen=65536, nstream=1, port=5004 tcp nuttcp-r: interval reporting every 2. 00 seconds nuttcp-r: accept from 198. 124. 238. 34 nuttcp-r: send window size = 98720, receive window size = 87380 nuttcp-r: available send window = 74040, available receive window = 65535 6. 3125 MB / 2. 00 sec = 26. 4759 Mbps 27 retrans 3. 5625 MB / 2. 00 sec = 14. 9423 Mbps 4 retrans 3. 8125 MB / 2. 00 sec = 15. 9906 Mbps 7 retrans 4. 8125 MB / 2. 00 sec = 20. 1853 Mbps 13 retrans 6. 0000 MB / 2. 00 sec = 25. 1659 Mbps 7 retrans nuttcp-t: 25. 5066 MB in 10. 00 real seconds = 2611. 85 KB/sec = 21. 3963 Mbps nuttcp-t: 25. 5066 MB in 0. 01 CPU seconds = 1741480. 37 KB/cpu sec nuttcp-t: retrans = 58 nuttcp-t: 409 I/O calls, msec/call = 25. 04, calls/sec = 40. 90 nuttcp-t: 0. 0 user 0. 0 sys 0: 10 real 0% 0 i+0 d 768 maxrss 0+2 pf 51+3 csw N. B. This is what perf. SONAR Graphs – the average of the complete test. nuttcp-r: 25. 5066 nuttcp-r: 787 I/O nuttcp-r: 0. 0 user bwctl: stop_tool: MB in 10. 30 real seconds = 2537. 03 KB/sec = 20. 7833 Mbps MB in 0. 02 CPU seconds = 1044874. 29 KB/cpu sec calls, msec/call = 13. 40, calls/sec = 76. 44 0. 0 sys 0: 10 real 0% 0 i+0 d 770 maxrss 0+4 pf 382+0 csw 3598658417. 214024 19 – ESnet Science Engagement (engage@es. net) - 10/31/2021

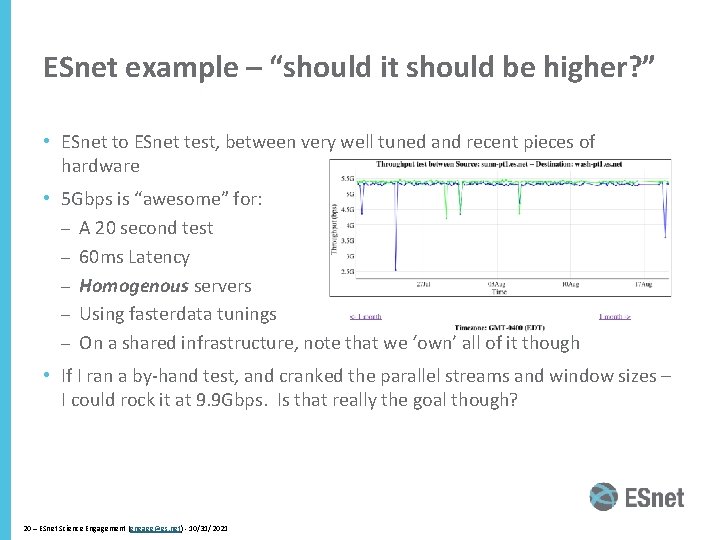
ESnet example – “should it should be higher? ” • ESnet to ESnet test, between very well tuned and recent pieces of hardware • 5 Gbps is “awesome” for: – A 20 second test – 60 ms Latency – Homogenous servers – Using fasterdata tunings – On a shared infrastructure, note that we ‘own’ all of it though • If I ran a by-hand test, and cranked the parallel streams and window sizes – I could rock it at 9. 9 Gbps. Is that really the goal though? 20 – ESnet Science Engagement (engage@es. net) - 10/31/2021

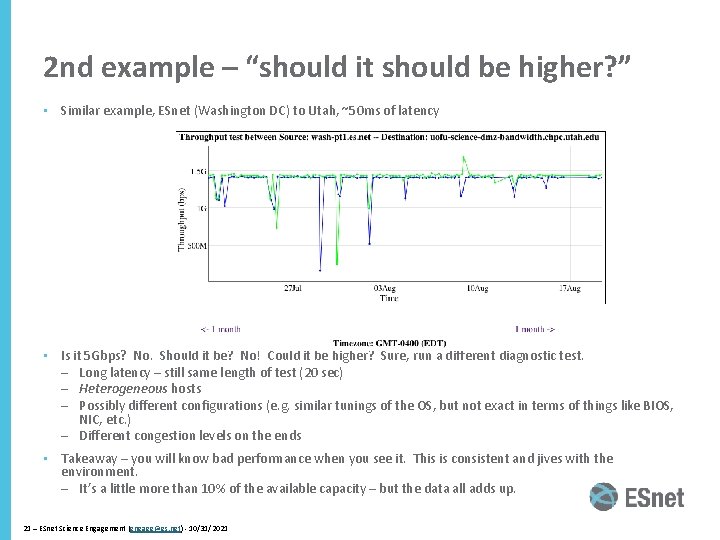
2 nd example – “should it should be higher? ” • Similar example, ESnet (Washington DC) to Utah, ~50 ms of latency • Is it 5 Gbps? No. Should it be? No! Could it be higher? Sure, run a different diagnostic test. – Long latency – still same length of test (20 sec) – Heterogeneous hosts – Possibly different configurations (e. g. similar tunings of the OS, but not exact in terms of things like BIOS, NIC, etc. ) – Different congestion levels on the ends • Takeaway – you will know bad performance when you see it. This is consistent and jives with the environment. – It’s a little more than 10% of the available capacity – but the data all adds up. 21 – ESnet Science Engagement (engage@es. net) - 10/31/2021

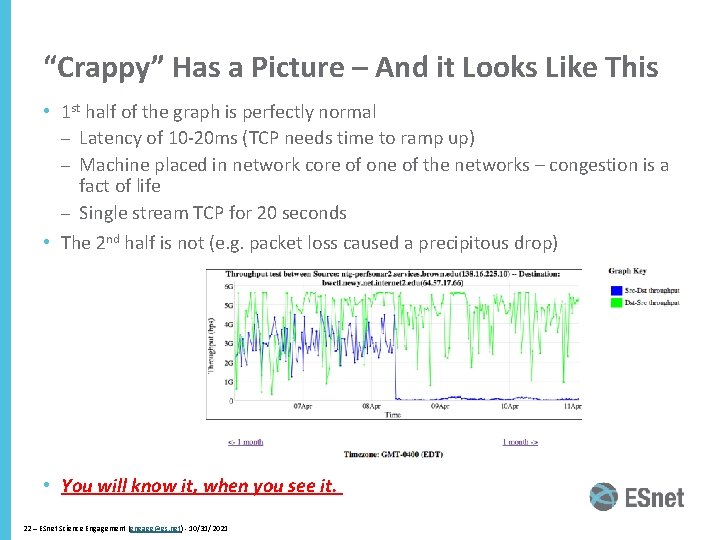
“Crappy” Has a Picture – And it Looks Like This • 1 st half of the graph is perfectly normal – Latency of 10 -20 ms (TCP needs time to ramp up) – Machine placed in network core of one of the networks – congestion is a fact of life – Single stream TCP for 20 seconds • The 2 nd half is not (e. g. packet loss caused a precipitous drop) • You will know it, when you see it. 22 – ESnet Science Engagement (engage@es. net) - 10/31/2021

Re-Setting Expectations • Will we see 10 Gbps on a regular test? – Sure, if we jack up the number of parallel streams, increase the sysctl setting for buffers, manually supply a window size, and run a 60 second test so we can get enough high values to improve the average • Is that worth it? – No. Lets say that again - NO • Alternatives: 1. Slightly increase the window size of hosts at the sysctl level? 2. Use set window sizes for tests in the mesh (this would be preferred to prior – can limit this to be used only in this mesh, and not others nodes participate in) 3. Re-set the expectations in the dashboard (lower thresholds to define a better green vs. yellow vs. red) 23 – ESnet Science Engagement (engage@es. net) - 10/31/2021

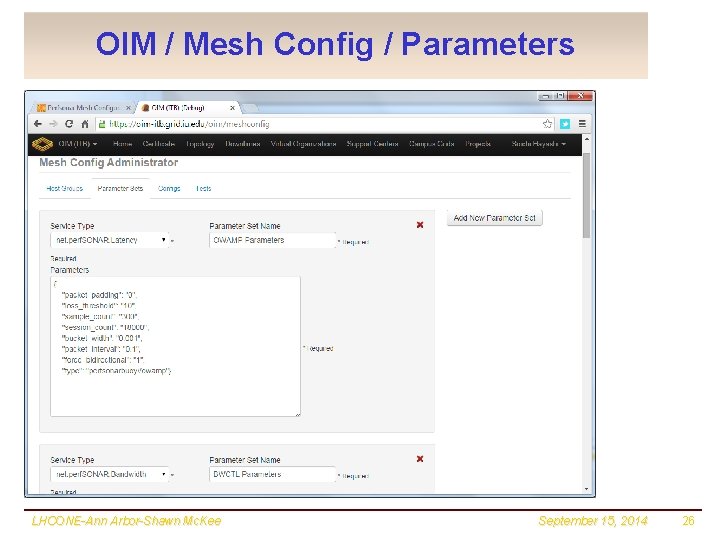
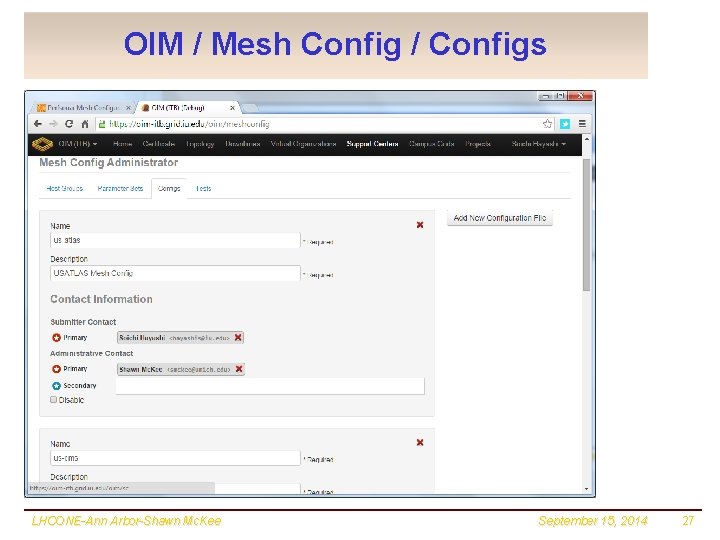
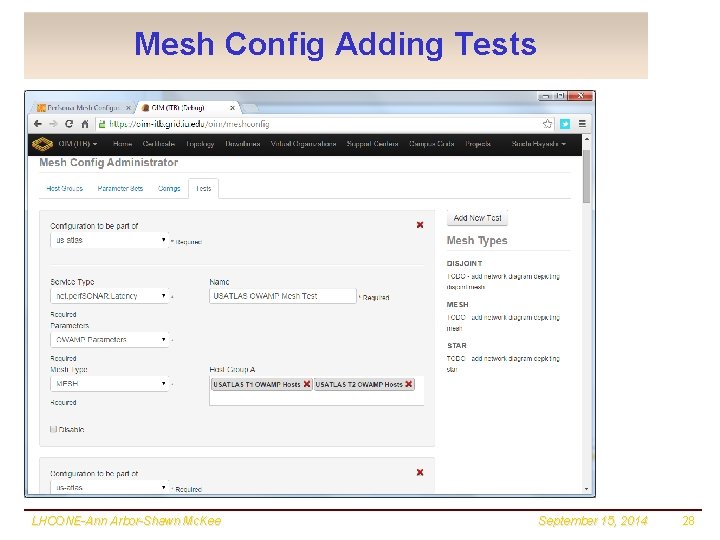
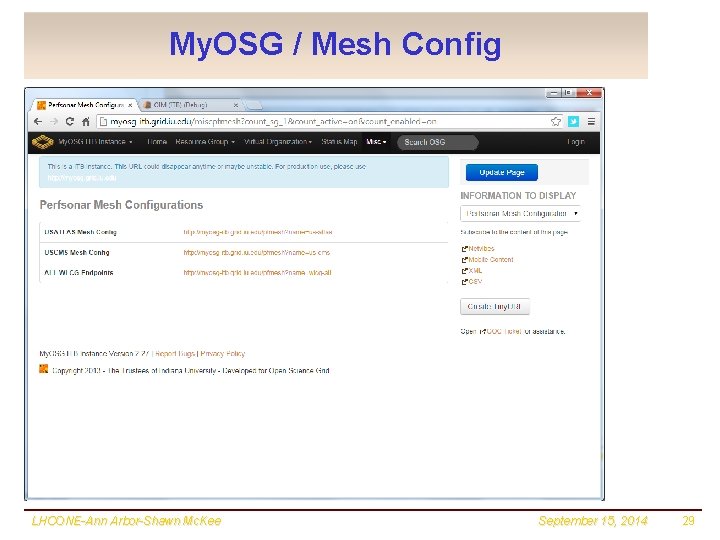
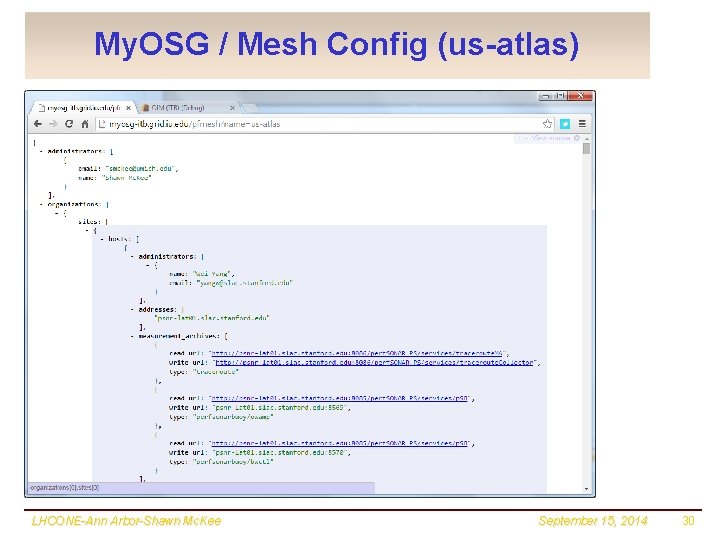
OSG Network Service T Open Science Grid (OSG) is deploying a network service for WLCG (and LHCONE). It consists of: q A datastore based upon Esmond (new MA in perf. SONAR v 3. 4) q A GUI using Ma. DDash q A service monitoring component built on OMD q A “mesh-creation-configuration” utility built on registered information in OIM and GOCDB T Demo on how the mesh-creation works (have to use slides for this since we need X 509 credentials) LHCONE-Ann Arbor-Shawn Mc. Kee September 15, 2014 24

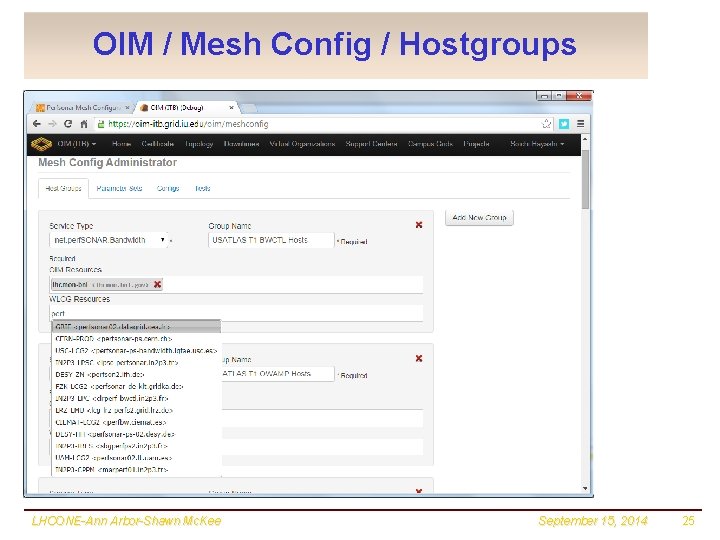
OIM / Mesh Config / Hostgroups LHCONE-Ann Arbor-Shawn Mc. Kee September 15, 2014 25

OIM / Mesh Config / Parameters LHCONE-Ann Arbor-Shawn Mc. Kee September 15, 2014 26

OIM / Mesh Config / Configs LHCONE-Ann Arbor-Shawn Mc. Kee September 15, 2014 27

Mesh Config Adding Tests LHCONE-Ann Arbor-Shawn Mc. Kee September 15, 2014 28

My. OSG / Mesh Config LHCONE-Ann Arbor-Shawn Mc. Kee September 15, 2014 29

My. OSG / Mesh Config (us-atlas) LHCONE-Ann Arbor-Shawn Mc. Kee September 15, 2014 30

Issue for LHCONE Monitoring T OSG has assigned a subnet for LHC related monitoring and the network service components: q 129. 79. 53. 0/24 T Right now OSG is not participating in LHCONE…but if we want it to host the “production” monitoring services for WLCG and LHCONE it needs to. q What is the best way forward? Can we get this subnet “joined” (peering) with LHCONE? Is this within the AUP? T Discussion after next slide… LHCONE-Ann Arbor-Shawn Mc. Kee September 15, 2014 31

Discussion/Questions/Comments? There is a lot to consider. I hope we have time for questions, discussion and comments. LHCONE-Ann Arbor-Shawn Mc. Kee September 15, 2014 32

Useful URLs T LHCOPN instructions for perf. SONAR-PS (out-of-date): q https: //twiki. cern. ch/twiki/bin/view/LHCOPN/Perfsonar. PS T LHCONE “initial” monitoring setup page q https: //twiki. cern. ch/twiki/bin/view/LCG/Perfsonar. Deployment T Open Science Grid Networking URL q https: //www. opensciencegrid. org/bin/view/Documentation/Networking. In. OSG T perf. SONAR tools, tips and best practices q http: //www. usatlas. bnl. gov/twiki/bin/view/Projects/LHCperf. SONAR T Ma. DDash Monitoring q http: //maddash. aglt 2. org/maddashwebui/index. cgi? dashboard=LHCONE%20 testing%20 sites T OMD Monitoring q https: //maddash. aglt 2. org/WLCGperf. SONAR/check_mk/index. py? st art_url=%2 FWLCGperf. SONAR%2 Fcheck_mk%2 Fview. py%3 Fview _name%3 Dhostgroups LHCONE-Ann Arbor-Shawn Mc. Kee September 15, 2014 33

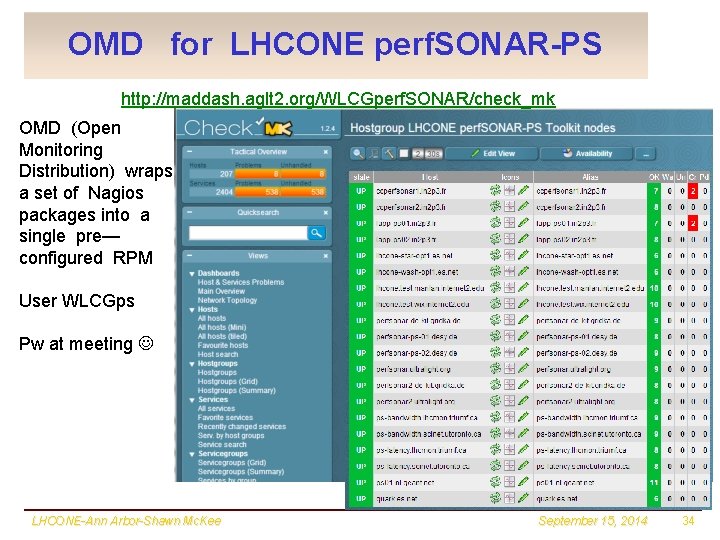
OMD for LHCONE perf. SONAR-PS http: //maddash. aglt 2. org/WLCGperf. SONAR/check_mk OMD (Open Monitoring Distribution) wraps a set of Nagios packages into a single pre— configured RPM User WLCGps Pw at meeting LHCONE-Ann Arbor-Shawn Mc. Kee September 15, 2014 34