Perceptieeffecten van geografische variantie in microprosodische eigenschappen Marie
prosodische eigenschappen Marie Nilsenová Communicatie- en informatie Wetenschappen Faculteit")

 reading the same")
 Weight (kg) Length (cm) NL-fem-1 25 65 173 NL-fem-2")
 Weight (kg) Length (cm) NL-masc-1 41 88 184 NL-masc-2")

 • Purpose of the reversed")
 Dutch Flemish Total Normal speech condition Reversed speech condition Male 10 27")
: the average")
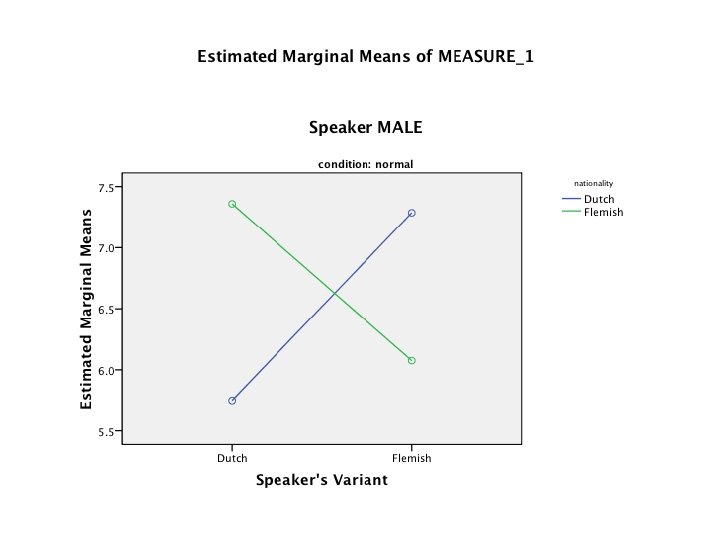
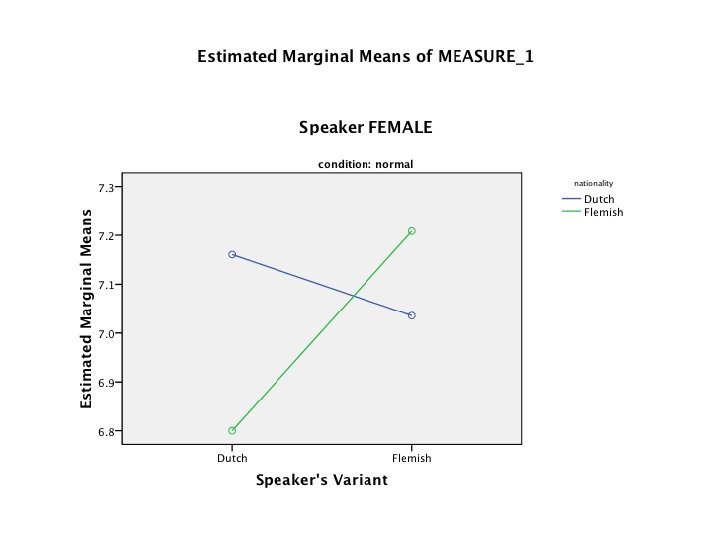
 • Normal condition (AD): interaction effect between speakers’ variant and gender, and")
 • Normal speech condition: interaction effect of speaker’s variant and listener’s variant")


- Slides: 15
Perceptie-effecten van geografische variantie in (micro-)prosodische eigenschappen Marie Nilsenová Communicatie- en informatie Wetenschappen Faculteit Geesteswetenschappen Universiteit van Tilburg
Background • Clear correlation between age, body size and F 0, as well as timbre (Greisbach 1999, Kraus, Freyberg & Morsella 2002) • Listeners should be able to exploit that knowledge, eg reflecting on the Frequency Code: deeper <-> bigger/taller • But listener estimates not as good as could be expected, also correlation not always perfect (Cohen et al 1980, Gunter & Manning 1982, van Dommelen & Moxness 1995) • Free (non-linguistic) variation with social, geographical distribution? • Expectation: listeners should perform better when estimating speakers in their own variant compared to another variant
Methodology • 16 speakers (8 male, 8 female/8 B-Dutch, 8 B-Flemish) reading the same short text (newspaper article) • 2 groups of participants - Dutch, Flemish • Task: estimate speaker’s length, weight, age and the ‘pleasantness’ of the voice (operationalized as 3 properties; Cronbach’s >. 65); fixed time • Also report if speaker Dutch or Flemish
Speaker comparison: Female Age (years) Weight (kg) Length (cm) NL-fem-1 25 65 173 NL-fem-2 40 60 174 NL-fem-3 57 63 163 NL-fem-4 56 65 178 VL-fem-1 38 60 169 VL-fem-2 31 68 180 VL-fem-3 34 56 163 VL-fem-4 36 56 169
Speaker comparison: Male Age (years) Weight (kg) Length (cm) NL-masc-1 41 88 184 NL-masc-2 34 72 184 NL-masc-3 29 83 190 NL-masc-4 25 83 174 VL-masc-1 32 79 185 VL-masc-2 41 65 180 VL-masc-3 28 78 188 VL-masc-4 37 63 168
Questionnaire • Wat vindt u van deze stem? Plezierig Vriendelijk Aangenaam Wat is volgens u de leeftijd van de spreker? Wat is volgens u de lengte van de spreker? Wat is volgens u het gewicht van de spreker? De spreker is Vlaams Nederlands Onplezierig Onvriendelijk Vervelend jaar cm kg
Design • Two conditions: normal and reversed speech (Audacity) • Purpose of the reversed speech condition: – to assure that speakers do not adapt to the variant they hear based on previous experience; – also, to examine if adaptation to own variant also relevant for perception of an ‘unknown’ language
Participants (N=179) Dutch Flemish Total Normal speech condition Reversed speech condition Male 10 27 Female 25 41 Male 9 13 Female 18 36 62 117
Measure of accuracy • Index of accuracy (Kraus, Freyberg & Morsella 2002): the average of the absolute difference between estimated and actual values (AD) - the mean of the absolute differences between judges’ estimates of speakers’ values on an attribute and the speakers’ actual value • The AD measure indexes judges’ average error in estimating a particular attribute • It answers the question “How close is the average estimate of attribute X to the actual value of X? ” • Absolute accuracy - the sum of the absolute difference between estimated and actual values (AA)
Results (Length) • Normal condition (AD): interaction effect between speakers’ variant and gender, and listeners’ variant (p<. 05, partial eta squared =. 127) in the predicted direction • Reversed condition (AD): main effect of speakers’ variant (p<. 05, partial eta squared =. 058): Dutch speakers estimated more accurately than Flemish speakers
Results (Pleasantness) • Normal speech condition: interaction effect of speaker’s variant and listener’s variant (p<. 01, partial eta squared =. 135) listeners prefered their own variant • Reversed speech condition: clear main effect of speaker’s variant (p<. 001, partial eta squared =. 535) - reversed Flemish prefered to reversed Dutch
Conclusion • Accuracy of length estimation higher in normal speech condition for own variant • Result not translated into the reversed speech condition • Clear preference for speakers of own variant • Listeners generally reported that estimating weight difficult • Other measures of accuracy to explore the directions of the accuracy judgments
Thanks to: Hanne Kloots Machiel Debets Julia Hirschberg Marc Swerts