OPTIMIZATION OF THE STOCKING DENSITY AND SIZE OF

- Slides: 28
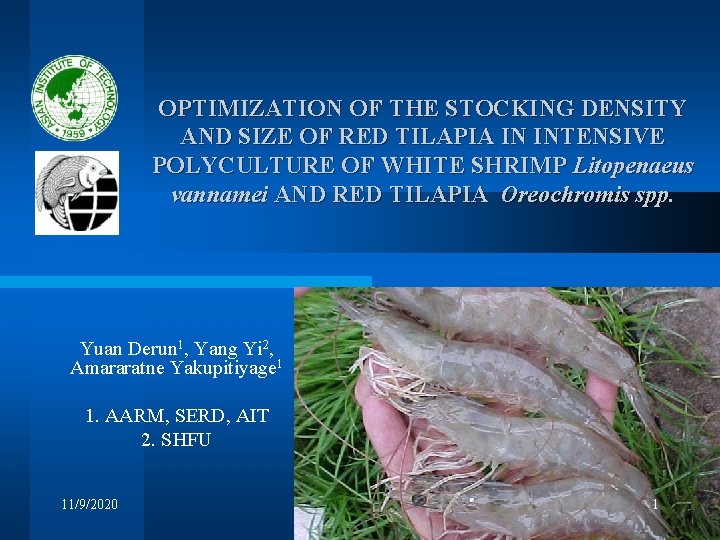
OPTIMIZATION OF THE STOCKING DENSITY AND SIZE OF RED TILAPIA IN INTENSIVE POLYCULTURE OF WHITE SHRIMP Litopenaeus vannamei AND RED TILAPIA Oreochromis spp. Yuan Derun 1, Yang Yi 2, Amararatne Yakupitiyage 1 1. AARM, SERD, AIT 2. SHFU 11/9/2020 1
Travel funding for this presentation was provided by Aquaculture Collaborative Research Support Program Aquaculture CRSP USAID The Aquaculture CRSP is funded in part by United States Agency for International Development (USAID) Grant No. LAG-G-00 -96 -90015 -00 and by participating institutions. The opinions expressed herein are those of the authors and do not necessarily reflect the views of the US Agency for International Development. 2020/11/9 2
Introduction Ø Shrimp culture has been one of the most active and important sector in aquaculture in past two to three decades. Ø Production increased from 87, 831 metric tons (MT) in 1981 to about 2 million MT in 2005 (FAO, 2006). 11/9/2020 3
Introduction Ø 11/9/2020 Despite the benefits, it has long been associated with environmental issues (Pruder, 1992; Phillips et al. , 1993; Lin, 1995; Boyd and Clay, 1998; Fast and Menasveta, 2000; Lin, 2000). 4
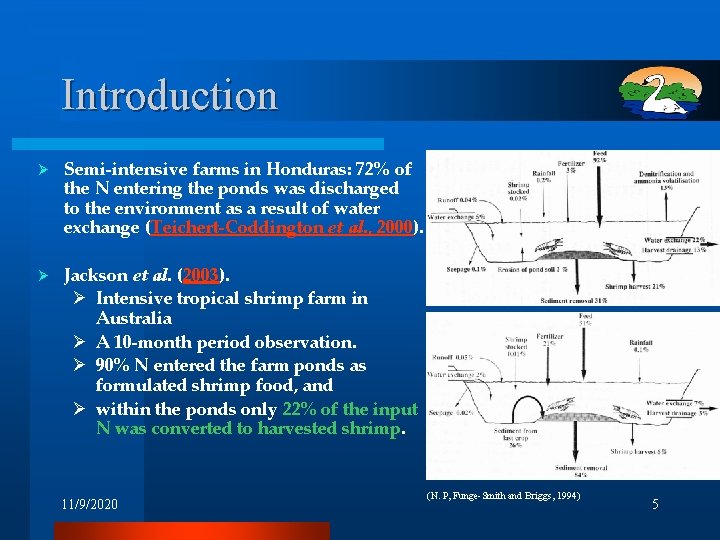
Introduction Ø Semi-intensive farms in Honduras: 72% of the N entering the ponds was discharged to the environment as a result of water exchange (Teichert-Coddington et al. , 2000). Ø Jackson et al. (2003). Ø Intensive tropical shrimp farm in Australia Ø A 10 -month period observation. Ø 90% N entered the farm ponds as formulated shrimp food, and Ø within the ponds only 22% of the input N was converted to harvested shrimp. 11/9/2020 (N. P, Funge-Smith and Briggs, 1994) 5
Introduction – the Problem Ø Negative environmental impacts Ø Economic loss of costly nutrients, thereby reducing farm profitability (Burford et al. , 2001). 11/9/2020 6
Introduction Ø Need to develop culture technology/systems with increased waste assimilating capacity: Øto transfer the excessive nutrients into harvestable aquatic products and Øto avoid uncontrolled effluent discharge. 11/9/2020 7
Introduction Ø Polyculture: Centuries old (Lin, 1969; Lin, 1982); Worldwide practice (Hepher and Milstein, 1989). Ø The rationale: Ø complementary to each other, Ø more efficient utilization of food available in the pond. Ø A possible solution/alternative? 11/9/2020 8
Introduction Shrimp polyculture: old practice Ø Been cultured with fish (milk fish, mullet, tilapias, other shrimp, Glacilaria seaweed, bivalves etc. Ø Purposes: Ø Ø To increase overall production Ø To earn extra income Ø To control water quality, and Ø To spread culture risks. 11/9/2020 9
Introduction Ø The researches and practices were however mainly based on extensive and semi-intensive systems. Ø Few attempts have been made to polyculture shrimp intensively. 11/9/2020 10
Introduction Akiyama and Anggawati (1999) observed two cycles of shrimp production in ponds in Ecuador and found that yields of shrimp increased when red tilapia (Oreochromis spp. ) were stocked into existing shrimp ponds. Ø It was believed that red tilapia assisted shrimp performance by improving and stabilizing the water quality, by foraging and cleaning the pond bottom and by having a probiotic type effect in the pond environment. Ø 11/9/2020 11
Introduction Ø A preliminary study of intensive shrimp/tilapia polyculture conducted by Yang Yi et al. (2002) in Thailand demonstrated positive specific interaction and mutual benefit between two co-cultured species. P. monodon in such an intensive polyculture system seemed to have the similar survival rates and FCR to those in monoculture controls. 11/9/2020 12
Introduction l However, questions still remain: – how shrimp would respond to the interaction of tilapia socking density and size – at what stoking density and size tilapia should best benefit shrimp production. l Furthermore, few studies done on polyculture aspect of L. vannamei, - the dominant species in shrimp culture worldwide. 11/9/2020 13
Introduction l The objective was: – To assess the effects of addition of red tilapia Oreochromis spp. at different densities and sizes on: • shrimp growth, • water quality and • nutrient recovery in intensive culture of white shrimp Litopenaeus vannamei. 11/9/2020 14
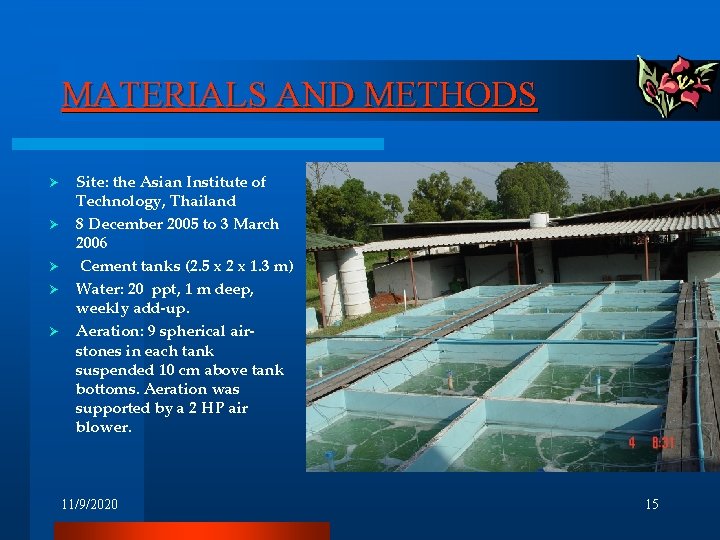
MATERIALS AND METHODS Ø Ø Ø Site: the Asian Institute of Technology, Thailand 8 December 2005 to 3 March 2006 Cement tanks (2. 5 x 2 x 1. 3 m) Water: 20 ppt, 1 m deep, weekly add-up. Aeration: 9 spherical airstones in each tank suspended 10 cm above tank bottoms. Aeration was supported by a 2 HP air blower. 11/9/2020 15
MATERIALS AND METHODS l L. Vannamei post-larvae: 0. 06 g, 60 pcs m-2. l 2 x 3 factorial design: Two different sizes of red tilapia (small at 13. 8± 0. 2 and large at 41. 9± 0. 3 g respectively) were added to the shrimp tanks at three different densities (0. 4, 0. 8 or 1. 2 fish m-2 ) two weeks after shrimp were stocked. l Shrimp were fed with commercial shrimp pellets of different sizes following a fixed feeding scheme. 11/9/2020 16
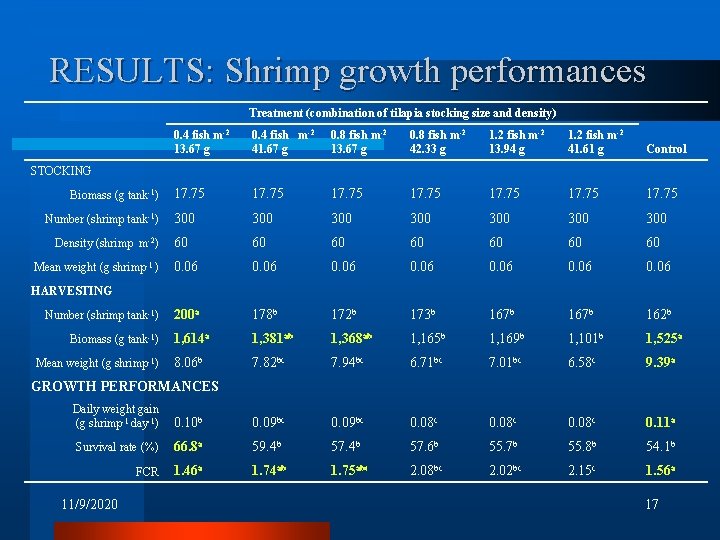
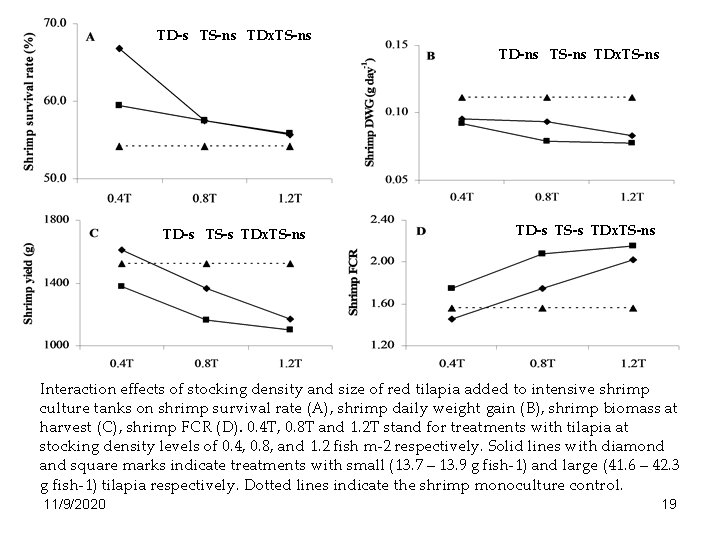
RESULTS: Shrimp growth performances Treatment (combination of tilapia stocking size and density) 0. 4 fish m-2 13. 67 g 0. 4 fish m-2 41. 67 g 0. 8 fish m-2 13. 67 g 0. 8 fish m-2 42. 33 g 1. 2 fish m-2 13. 94 g 1. 2 fish m-2 41. 61 g Control 17. 75 17. 75 300 300 60 60 0. 06 0. 06 200 a 178 b 172 b 173 b 167 b 162 b 1, 614 a 1, 381 ab 1, 368 ab 1, 165 b 1, 169 b 1, 101 b 1, 525 a 8. 06 b 7. 82 bc 7. 94 bc 6. 71 bc 7. 01 bc 6. 58 c 9. 39 a STOCKING Biomass (g tank-1) Number (shrimp tank-1) Density (shrimp m-2) Mean weight (g shrimp-1 ) HARVESTING Number (shrimp tank-1) Biomass (g tank-1) Mean weight (g shrimp-1) GROWTH PERFORMANCES Daily weight gain (g shrimp-1 day-1) 0. 10 b 0. 09 bc 0. 08 c 0. 11 a Survival rate (%) 66. 8 a 59. 4 b 57. 6 b 55. 7 b 55. 8 b 54. 1 b FCR 1. 46 a 1. 74 ab 1. 75 abc 2. 08 bc 2. 02 bc 2. 15 c 1. 56 a 11/9/2020 17
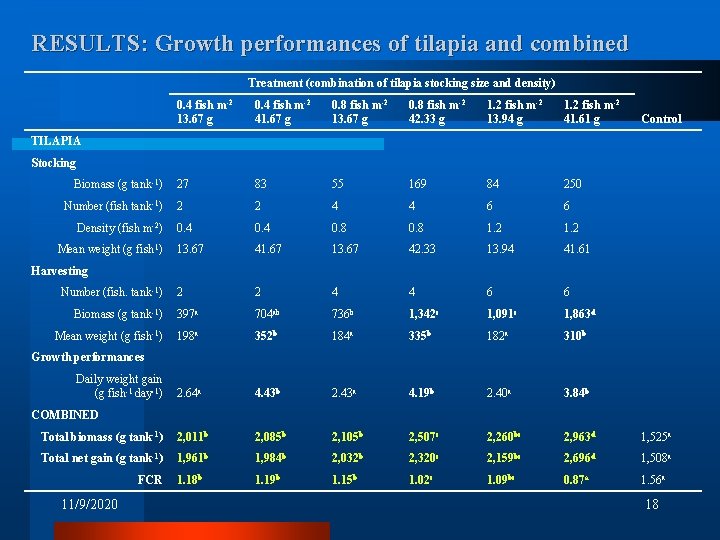
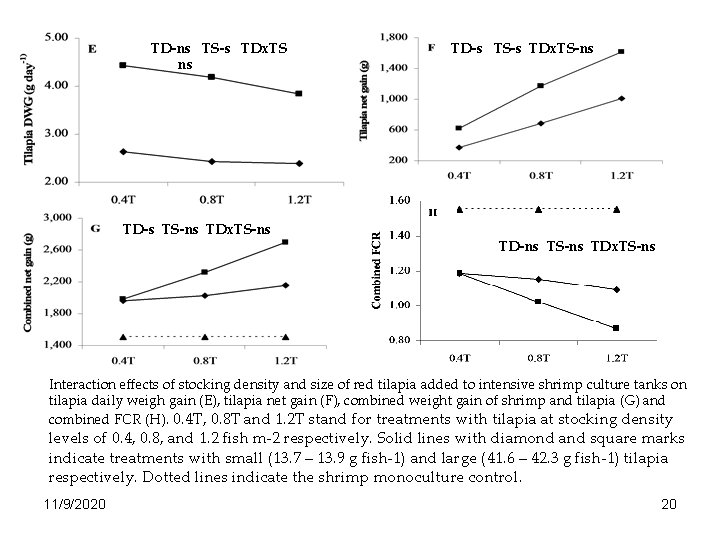
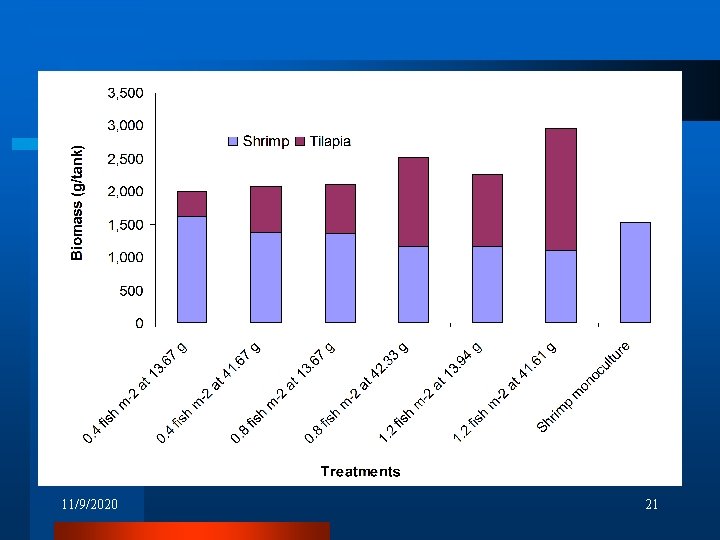
RESULTS: Growth performances of tilapia and combined Treatment (combination of tilapia stocking size and density) 0. 4 fish m-2 13. 67 g 0. 4 fish m-2 41. 67 g 0. 8 fish m-2 13. 67 g 0. 8 fish m-2 42. 33 g 1. 2 fish m-2 13. 94 g 1. 2 fish m-2 41. 61 g 27 83 55 169 84 250 2 2 4 4 6 6 0. 4 0. 8 1. 2 13. 67 41. 67 13. 67 42. 33 13. 94 41. 61 2 2 4 4 6 6 Biomass (g tank-1) 397 a 704 ab 736 b 1, 342 c 1, 091 c 1, 863 d Mean weight (g fish-1) 198 a 352 b 184 a 335 b 182 a 310 b 2. 64 a 4. 43 b 2. 43 a 4. 19 b 2. 40 a 3. 84 b Total biomass (g tank-1) 2, 011 b 2, 085 b 2, 105 b 2, 507 c 2, 260 bc 2, 963 d 1, 525 a Total net gain (g tank-1) 1, 961 b 1, 984 b 2, 032 b 2, 320 c 2, 159 bc 2, 696 d 1, 508 a 1. 18 b 1. 19 b 1. 15 b 1. 02 c 1. 09 bc 0. 87 a 1. 56 a Control TILAPIA Stocking Biomass (g tank-1) Number (fish tank-1) Density (fish m-2) Mean weight (g fish 1) Harvesting Number (fish. tank-1) Growth performances Daily weight gain (g fish-1 day-1) COMBINED FCR 11/9/2020 18
TD-s TS-ns TDx. TS-ns TD-ns TS-ns TDx. TS-ns TD-s TS-s TDx. TS-ns Interaction effects of stocking density and size of red tilapia added to intensive shrimp culture tanks on shrimp survival rate (A), shrimp daily weight gain (B), shrimp biomass at harvest (C), shrimp FCR (D). 0. 4 T, 0. 8 T and 1. 2 T stand for treatments with tilapia at stocking density levels of 0. 4, 0. 8, and 1. 2 fish m-2 respectively. Solid lines with diamond and square marks indicate treatments with small (13. 7 – 13. 9 g fish-1) and large (41. 6 – 42. 3 g fish-1) tilapia respectively. Dotted lines indicate the shrimp monoculture control. 11/9/2020 19
TD-ns TS-s TDx. TS ns TD-s TS-ns TDx. TS-ns TD-s TS-s TDx. TS-ns TD-ns TS-ns TDx. TS-ns Interaction effects of stocking density and size of red tilapia added to intensive shrimp culture tanks on tilapia daily weigh gain (E), tilapia net gain (F), combined weight gain of shrimp and tilapia (G) and combined FCR (H). 0. 4 T, 0. 8 T and 1. 2 T stand for treatments with tilapia at stocking density levels of 0. 4, 0. 8, and 1. 2 fish m-2 respectively. Solid lines with diamond and square marks indicate treatments with small (13. 7 – 13. 9 g fish-1) and large (41. 6 – 42. 3 g fish-1) tilapia respectively. Dotted lines indicate the shrimp monoculture control. 11/9/2020 20
11/9/2020 21
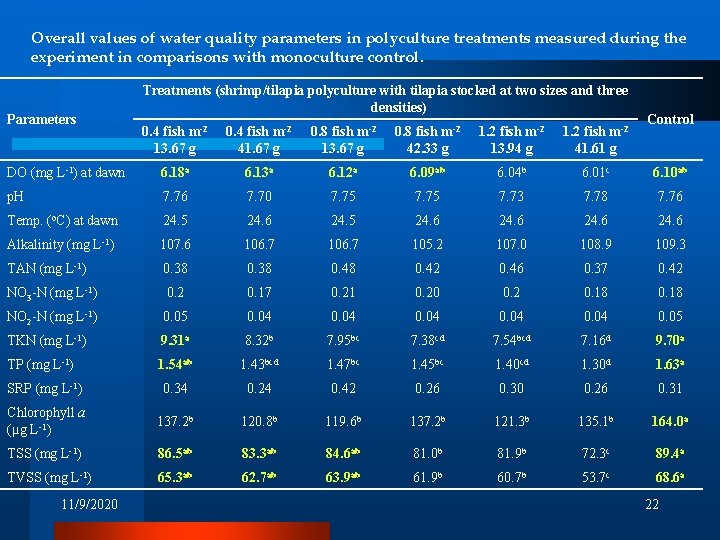
Overall values of water quality parameters in polyculture treatments measured during the experiment in comparisons with monoculture control. Parameters Treatments (shrimp/tilapia polyculture with tilapia stocked at two sizes and three densities) Control 0. 4 fish m-2 13. 67 g 0. 4 fish m-2 41. 67 g 0. 8 fish m-2 13. 67 g 0. 8 fish m-2 42. 33 g 1. 2 fish m-2 13. 94 g 1. 2 fish m-2 41. 61 g DO (mg L-1) at dawn 6. 18 a 6. 13 a 6. 12 a 6. 09 ab 6. 04 b 6. 01 c 6. 10 ab p. H 7. 76 7. 70 7. 75 7. 73 7. 78 7. 76 Temp. (o. C) at dawn 24. 5 24. 6 Alkalinity (mg L-1) 107. 6 106. 7 105. 2 107. 0 108. 9 109. 3 TAN (mg L-1) 0. 38 0. 48 0. 42 0. 46 0. 37 0. 42 NO 3 -N (mg L-1) 0. 2 0. 17 0. 21 0. 20 0. 2 0. 18 NO 2 -N (mg L-1) 0. 05 0. 04 0. 05 TKN (mg L-1) 9. 31 a 8. 32 b 7. 95 bc 7. 38 cd 7. 54 bcd 7. 16 d 9. 70 a TP (mg L-1) 1. 54 ab 1. 43 bcd 1. 47 bc 1. 45 bc 1. 40 cd 1. 30 d 1. 63 a SRP (mg L-1) 0. 34 0. 24 0. 42 0. 26 0. 30 0. 26 0. 31 Chlorophyll a (µg L-1) 137. 2 b 120. 8 b 119. 6 b 137. 2 b 121. 3 b 135. 1 b 164. 0 a TSS (mg L-1) 86. 5 ab 83. 3 ab 84. 6 ab 81. 0 b 81. 9 b 72. 3 c 89. 4 a TVSS (mg L-1) 65. 3 ab 62. 7 ab 63. 9 ab 61. 9 b 60. 7 b 53. 7 c 68. 6 a 11/9/2020 22
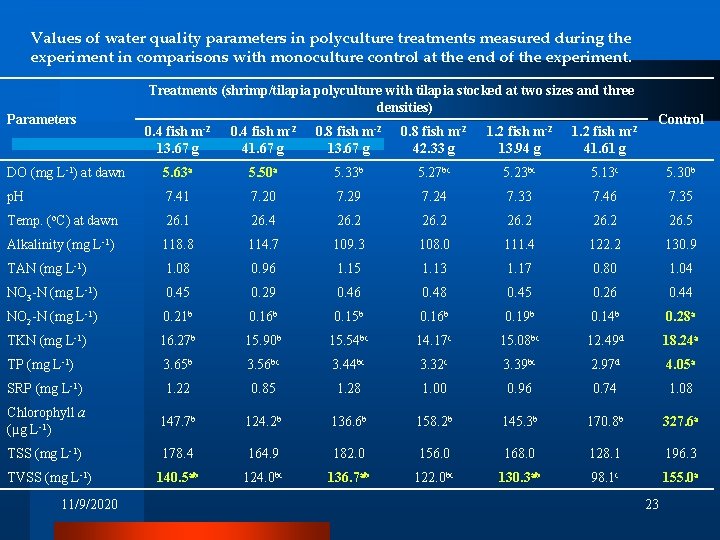
Values of water quality parameters in polyculture treatments measured during the experiment in comparisons with monoculture control at the end of the experiment. Parameters Treatments (shrimp/tilapia polyculture with tilapia stocked at two sizes and three densities) Control 0. 4 fish m-2 13. 67 g 0. 4 fish m-2 41. 67 g 0. 8 fish m-2 13. 67 g 0. 8 fish m-2 42. 33 g 1. 2 fish m-2 13. 94 g 1. 2 fish m-2 41. 61 g DO (mg L-1) at dawn 5. 63 a 5. 50 a 5. 33 b 5. 27 bc 5. 23 bc 5. 13 c 5. 30 b p. H 7. 41 7. 20 7. 29 7. 24 7. 33 7. 46 7. 35 Temp. (o. C) at dawn 26. 1 26. 4 26. 2 26. 5 Alkalinity (mg L-1) 118. 8 114. 7 109. 3 108. 0 111. 4 122. 2 130. 9 TAN (mg L-1) 1. 08 0. 96 1. 15 1. 13 1. 17 0. 80 1. 04 NO 3 -N (mg L-1) 0. 45 0. 29 0. 46 0. 48 0. 45 0. 26 0. 44 NO 2 -N (mg L-1) 0. 21 b 0. 16 b 0. 15 b 0. 16 b 0. 19 b 0. 14 b 0. 28 a TKN (mg L-1) 16. 27 b 15. 90 b 15. 54 bc 14. 17 c 15. 08 bc 12. 49 d 18. 24 a TP (mg L-1) 3. 65 b 3. 56 bc 3. 44 bc 3. 32 c 3. 39 bc 2. 97 d 4. 05 a SRP (mg L-1) 1. 22 0. 85 1. 28 1. 00 0. 96 0. 74 1. 08 Chlorophyll a (µg L-1) 147. 7 b 124. 2 b 136. 6 b 158. 2 b 145. 3 b 170. 8 b 327. 6 a TSS (mg L-1) 178. 4 164. 9 182. 0 156. 0 168. 0 128. 1 196. 3 140. 5 ab 124. 0 bc 136. 7 ab 122. 0 bc 130. 3 ab 98. 1 c 155. 0 a TVSS (mg L-1) 11/9/2020 23
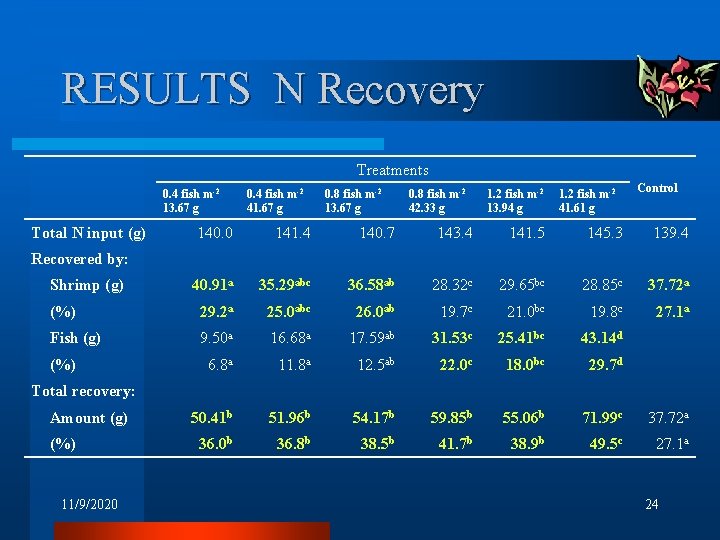
RESULTS N Recovery Treatments 0. 4 fish m-2 13. 67 g Total N input (g) 0. 4 fish m-2 41. 67 g 0. 8 fish m-2 13. 67 g 0. 8 fish m-2 42. 33 g 1. 2 fish m-2 13. 94 g 1. 2 fish m-2 41. 61 g Control 140. 0 141. 4 140. 7 143. 4 141. 5 145. 3 139. 4 40. 91 a 35. 29 abc 36. 58 ab 28. 32 c 29. 65 bc 28. 85 c 37. 72 a (%) 29. 2 a 25. 0 abc 26. 0 ab 19. 7 c 21. 0 bc 19. 8 c 27. 1 a Fish (g) 9. 50 a 16. 68 a 17. 59 ab 31. 53 c 25. 41 bc 43. 14 d 6. 8 a 11. 8 a 12. 5 ab 22. 0 c 18. 0 bc 29. 7 d 50. 41 b 51. 96 b 54. 17 b 59. 85 b 55. 06 b 71. 99 c 37. 72 a 36. 0 b 36. 8 b 38. 5 b 41. 7 b 38. 9 b 49. 5 c 27. 1 a Recovered by: Shrimp (g) (%) Total recovery: Amount (g) (%) 11/9/2020 24
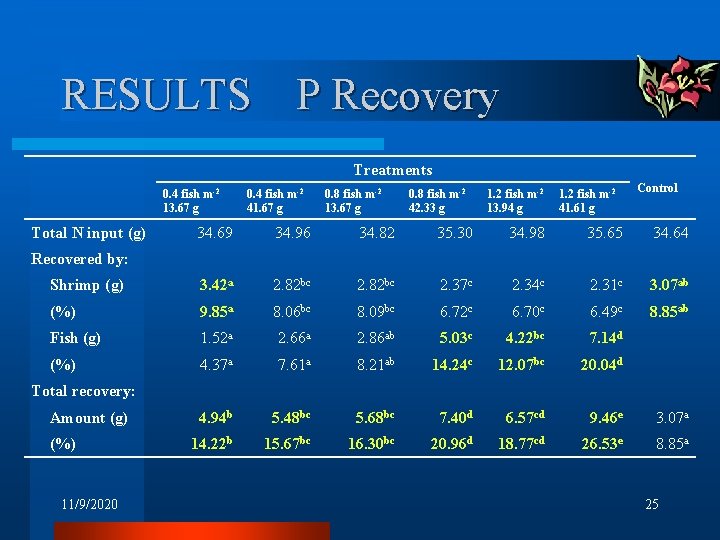
RESULTS P Recovery Treatments 0. 4 fish m-2 13. 67 g Total N input (g) 0. 4 fish m-2 41. 67 g 0. 8 fish m-2 13. 67 g 0. 8 fish m-2 42. 33 g 1. 2 fish m-2 13. 94 g 1. 2 fish m-2 41. 61 g Control 34. 69 34. 96 34. 82 35. 30 34. 98 35. 65 34. 64 Shrimp (g) 3. 42 a 2. 82 bc 2. 37 c 2. 34 c 2. 31 c 3. 07 ab (%) 9. 85 a 8. 06 bc 8. 09 bc 6. 72 c 6. 70 c 6. 49 c 8. 85 ab Fish (g) 1. 52 a 2. 66 a 2. 86 ab 5. 03 c 4. 22 bc 7. 14 d (%) 4. 37 a 7. 61 a 8. 21 ab 14. 24 c 12. 07 bc 20. 04 d 4. 94 b 5. 48 bc 5. 68 bc 7. 40 d 6. 57 cd 9. 46 e 3. 07 a 14. 22 b 15. 67 bc 16. 30 bc 20. 96 d 18. 77 cd 26. 53 e 8. 85 a Recovered by: Total recovery: Amount (g) (%) 11/9/2020 25
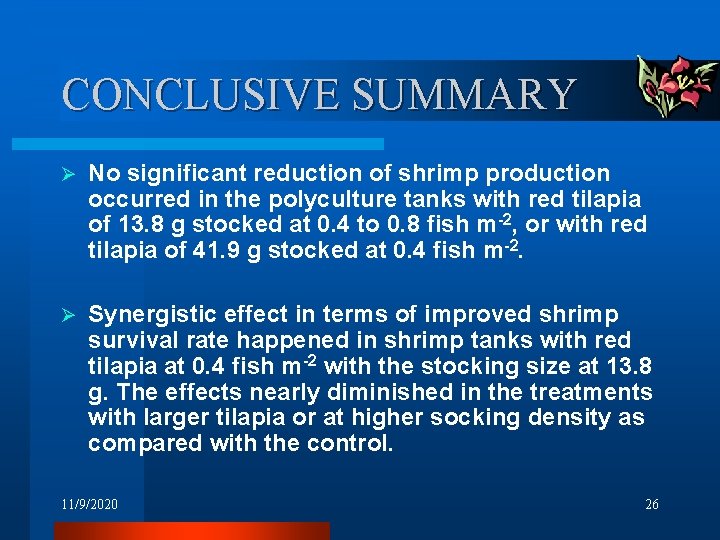
CONCLUSIVE SUMMARY Ø No significant reduction of shrimp production occurred in the polyculture tanks with red tilapia of 13. 8 g stocked at 0. 4 to 0. 8 fish m-2, or with red tilapia of 41. 9 g stocked at 0. 4 fish m-2. Ø Synergistic effect in terms of improved shrimp survival rate happened in shrimp tanks with red tilapia at 0. 4 fish m-2 with the stocking size at 13. 8 g. The effects nearly diminished in the treatments with larger tilapia or at higher socking density as compared with the control. 11/9/2020 26
CONCLUSIVE SUMMARY Ø Increasing tilapia stocking density from 0. 4 to 1. 2 fish m-2 and stocking size from 13. 8 to 41. 9 g in polyculture negatively affected shrimp production performances, but remarkably increased overall nutrient utilization and total production. Ø The study demonstrated that white shrimp could be cultured intensively with red tilapia in a polyculture system. With proper stocking size and density of red tilapia, the polyculture system could achieve a similar shrimp production level comparable to that of monoculture without extra feed inputs, and produce tilapia as an additional crop. 11/9/2020 27
Thank You !!! 11/9/2020 28