Novartis QSE Quantitative assessment of adverse events in

- Slides: 28
Novartis QSE Quantitative assessment of adverse events in clinical trials: comparison of methods at interim and final analysis V Jehl, in collaboration with N Hollaender, J Gonzalez. Maffe Basel October 29, 2019
Disclaimer The views and opinions expressed in this presentation are those of the authors and do not necessarily reflect the official policy or position of Novartis or any of its officers. 2 PSI Basel 29 OCT 2019
Objective • Compare different methods to estimate the probability of occurrence of a selected adverse event (AE) • Particular focus • Early safety interim analysis (IA) for data monitoring committee (DMC) when limited knowledge about safety drug profile • Competing event (CE) 3 PSI Basel 29 OCT 2019
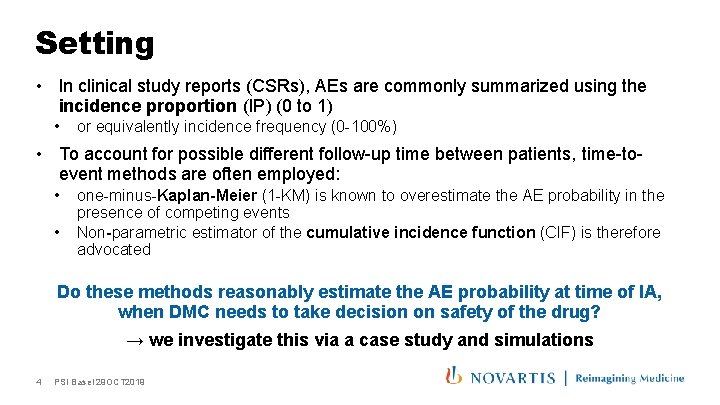
Setting • In clinical study reports (CSRs), AEs are commonly summarized using the incidence proportion (IP) (0 to 1) • or equivalently incidence frequency (0 -100%) • To account for possible different follow-up time between patients, time-toevent methods are often employed: • • one-minus-Kaplan-Meier (1 -KM) is known to overestimate the AE probability in the presence of competing events Non-parametric estimator of the cumulative incidence function (CIF) is therefore advocated Do these methods reasonably estimate the AE probability at time of IA, when DMC needs to take decision on safety of the drug? → we investigate this via a case study and simulations 4 PSI Basel 29 OCT 2019
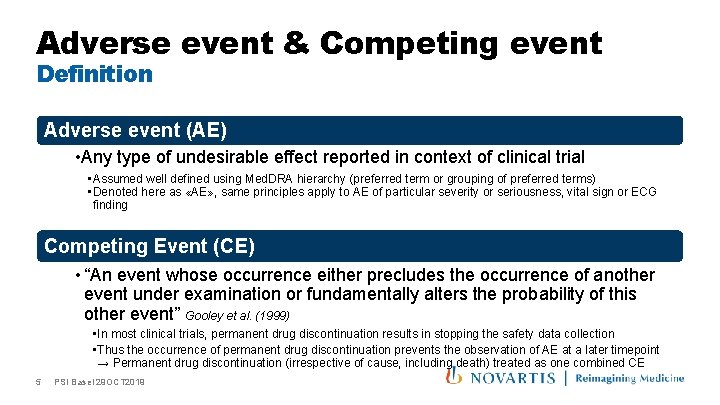
Adverse event & Competing event Definition Adverse event (AE) • Any type of undesirable effect reported in context of clinical trial • Assumed well defined using Med. DRA hierarchy (preferred term or grouping of preferred terms) • Denoted here as «AE» , same principles apply to AE of particular severity or seriousness, vital sign or ECG finding Competing Event (CE) • “An event whose occurrence either precludes the occurrence of another event under examination or fundamentally alters the probability of this other event” Gooley et al. (1999) • In most clinical trials, permanent drug discontinuation results in stopping the safety data collection • Thus the occurrence of permanent drug discontinuation prevents the observation of AE at a later timepoint → Permanent drug discontinuation (irrespective of cause, including death) treated as one combined CE 5 PSI Basel 29 OCT 2019
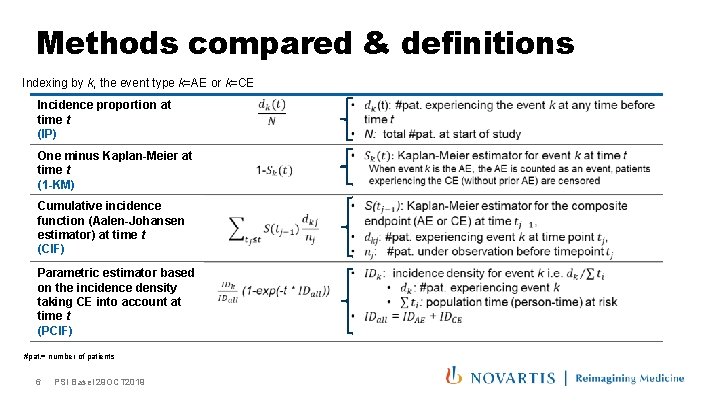
Methods compared & definitions Indexing by k, the event type k=AE or k=CE Incidence proportion at time t (IP) One minus Kaplan-Meier at time t (1 -KM) Cumulative incidence function (Aalen-Johansen estimator) at time t (CIF) Parametric estimator based on the incidence density taking CE into account at time t (PCIF) #pat. = number of patients 6 PSI Basel 29 OCT 2019
Case study
Case study (1/5) a phase III study in breast cancer study • AE: most commonly observed AE - stomatitis • Stomatitis is defined as a Grouping of Preferred Terms in Med. DRA • Mostly occurring within first 56 days of study treatment • At CSR, 321 patients out of 482 reported stomatitis (IPAE=0. 67) • CE • Permanent discontinuation from study treatment including death • Per protocol, safety reported up to 28 days after last dose intake • At CSR, 117 patients out of 482 had a CE without prior AE (IPCE=0. 24) • Follow-up time for study • Driven by primary efficacy endpoint (progression-free-survival): until sufficient number of PFS events to achieve pre-specified power i. e. irrespective of safety • Individual treatment duration: until disease progression, toxicity or cut-off date for primary analysis • Median exposure time 168 days (range: 7 to 703) 8 PSI Basel 29 OCT 2019
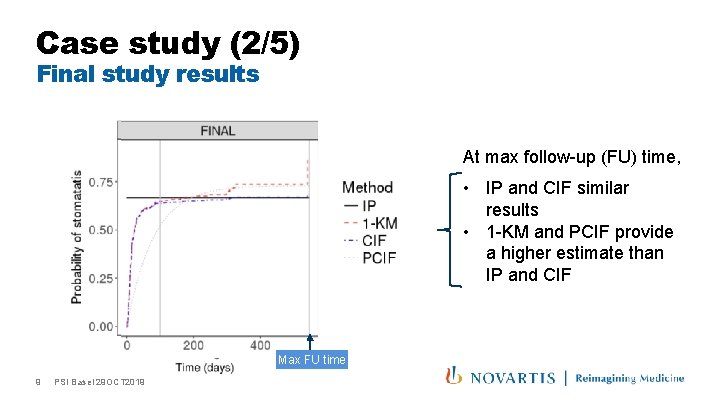
Case study (2/5) Final study results At max follow-up (FU) time, • IP and CIF similar results • 1 -KM and PCIF provide a higher estimate than IP and CIF Max FU time 9 PSI Basel 29 OCT 2019
Case study (3/5) • We now «introduce» an interim analysis (IA) 180 days after the first patient enrolled (i. e. Typical DMC situation) • What can the DMC say about the risk of stomatitis at that point in time? • Note: this IA did not exist in the considered study but was re-analyzed for the purpose of this investigational work 10 PSI Basel 29 OCT 2019
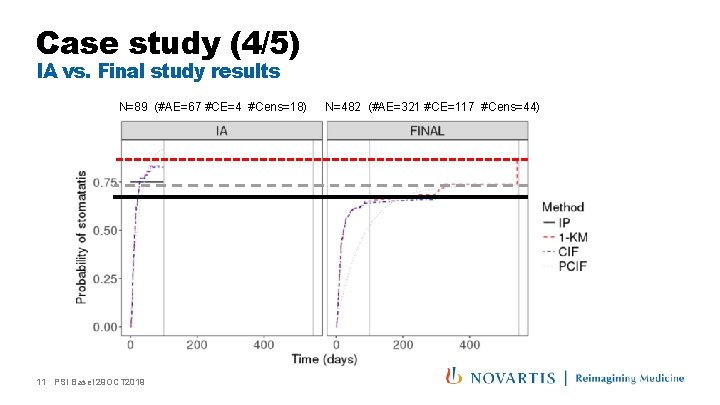
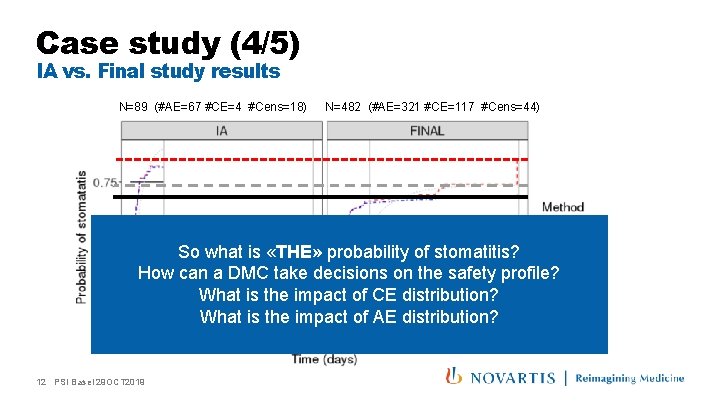
Case study (4/5) IA vs. Final study results N=89 (#AE=67 #CE=4 #Cens=18) 11 PSI Basel 29 OCT 2019 N=482 (#AE=321 #CE=117 #Cens=44)
Case study (4/5) IA vs. Final study results N=89 (#AE=67 #CE=4 #Cens=18) N=482 (#AE=321 #CE=117 #Cens=44) So what is «THE» probability of stomatitis? How can a DMC take decisions on the safety profile? What is the impact of CE distribution? What is the impact of AE distribution? 12 PSI Basel 29 OCT 2019
Objective - revisited • Compare different methods to estimate the probability of occurrence of a selected adverse event (AE) • Particular focus • Early safety interim analysis (IA) for data monitoring committee (DMC) when limited knowledge about safety drug profile • Competing event (CE) • Investigate impact of AE and CE hazard function distribution • We model hazards using Weibull distributions 13 PSI Basel 29 OCT 2019
Simulation study
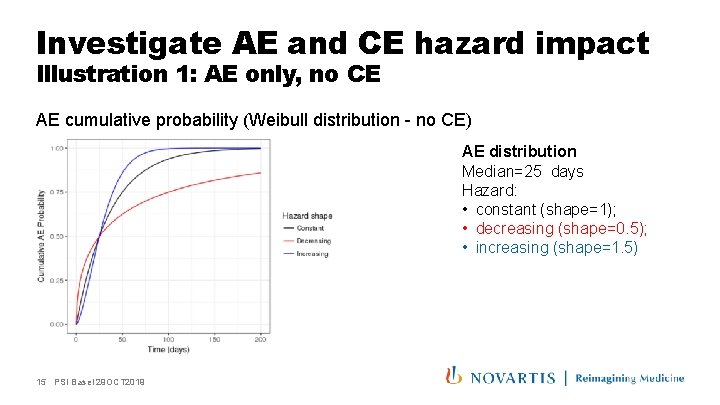
Investigate AE and CE hazard impact Illustration 1: AE only, no CE AE cumulative probability (Weibull distribution - no CE) AE distribution Median=25 days Hazard: • constant (shape=1); • decreasing (shape=0. 5); • increasing (shape=1. 5) 15 PSI Basel 29 OCT 2019
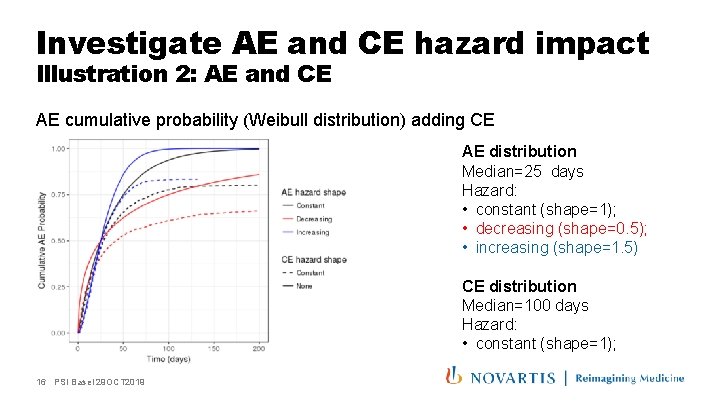
Investigate AE and CE hazard impact Illustration 2: AE and CE AE cumulative probability (Weibull distribution) adding CE AE distribution Median=25 days Hazard: • constant (shape=1); • decreasing (shape=0. 5); • increasing (shape=1. 5) CE distribution Median=100 days Hazard: • constant (shape=1); 16 PSI Basel 29 OCT 2019
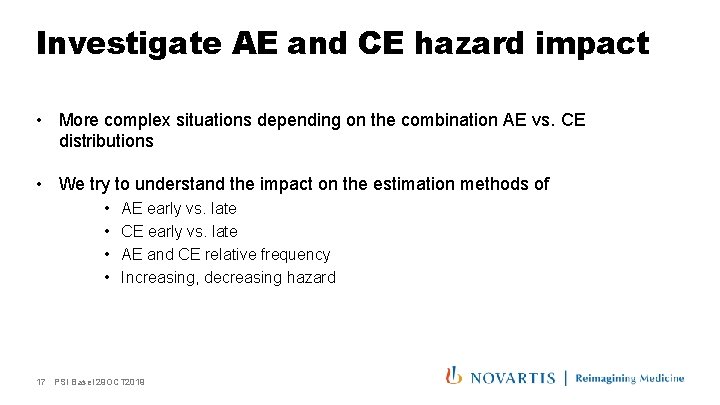
Investigate AE and CE hazard impact • More complex situations depending on the combination AE vs. CE distributions • We try to understand the impact on the estimation methods of • • AE early vs. late CE early vs. late AE and CE relative frequency Increasing, decreasing hazard 17 PSI Basel 29 OCT 2019
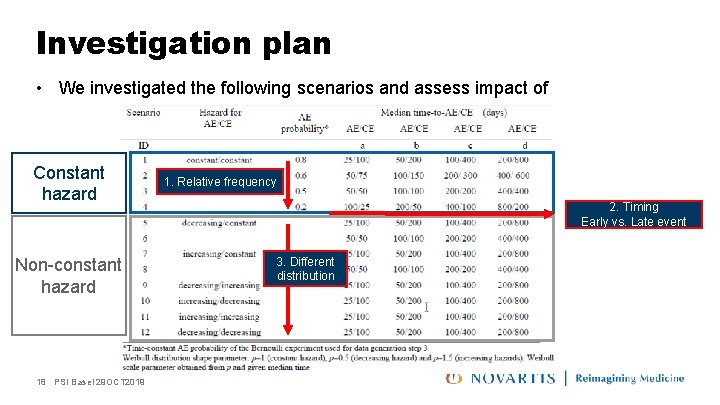
Investigation plan • We investigated the following scenarios and assess impact of Constant hazard Non-constant hazard 18 PSI Basel 29 OCT 2019 1. Relative frequency 2. Timing Early vs. Late event 3. Different distribution
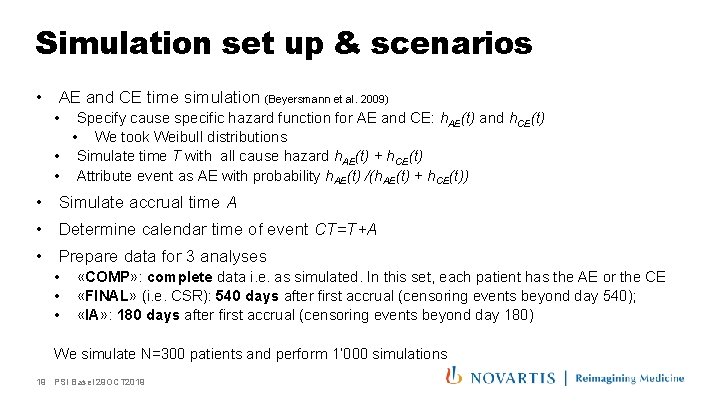
Simulation set up & scenarios • AE and CE time simulation (Beyersmann et al. 2009) • Specify cause specific hazard function for AE and CE: h. AE(t) and h. CE(t) • We took Weibull distributions • Simulate time T with all cause hazard h. AE(t) + h. CE(t) • Attribute event as AE with probability h. AE(t) /(h. AE(t) + h. CE(t)) • Simulate accrual time A • Determine calendar time of event CT=T+A • Prepare data for 3 analyses • • • «COMP» : complete data i. e. as simulated. In this set, each patient has the AE or the CE «FINAL» (i. e. CSR): 540 days after first accrual (censoring events beyond day 540); «IA» : 180 days after first accrual (censoring events beyond day 180) We simulate N=300 patients and perform 1’ 000 simulations 19 PSI Basel 29 OCT 2019
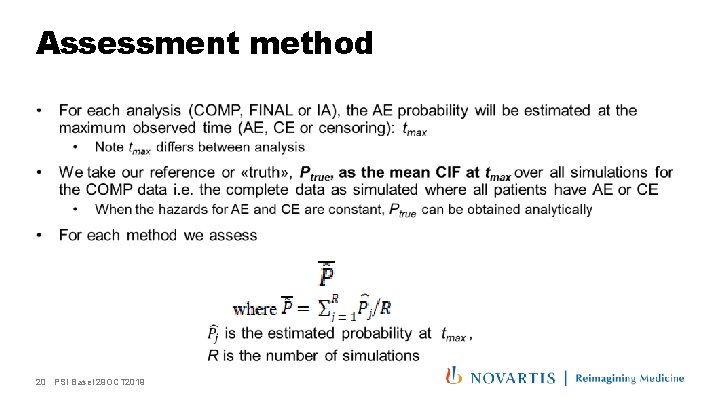
Assessment method 1. 20 PSI Basel 29 OCT 2019
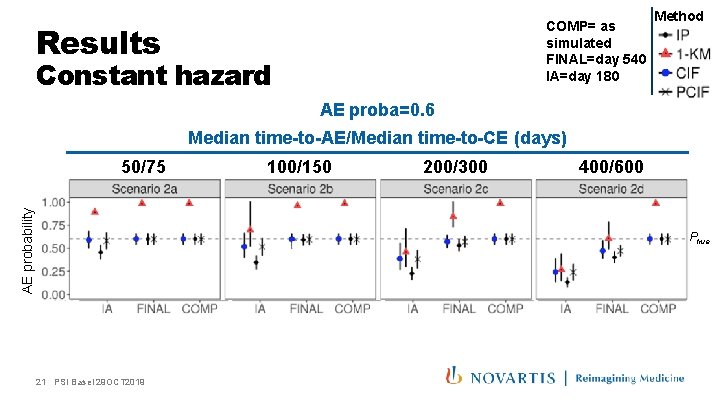
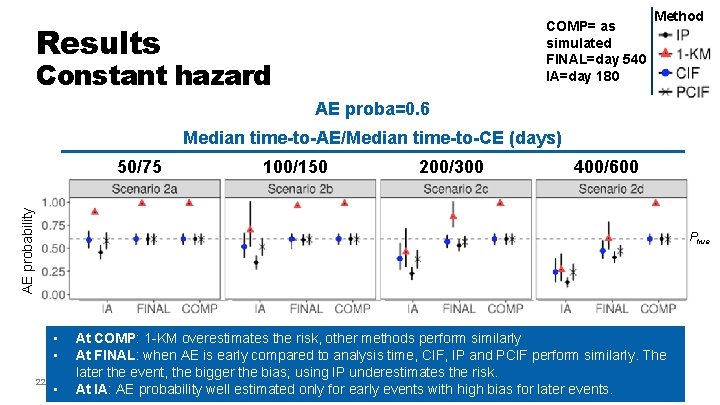
COMP= as simulated FINAL=day 540 IA=day 180 Results Constant hazard Method AE proba=0. 6 Median time-to-AE/Median time-to-CE (days) AE probability 50/75 100/150 200/300 400/600 Ptrue 21 PSI Basel 29 OCT 2019
COMP= as simulated FINAL=day 540 IA=day 180 Results Constant hazard Method AE proba=0. 6 Median time-to-AE/Median time-to-CE (days) 100/150 200/300 400/600 AE probability 50/75 Ptrue • • 22 At COMP: 1 -KM overestimates the risk, other methods perform similarly At FINAL: when AE is early compared to analysis time, CIF, IP and PCIF perform similarly. The later the event, the bigger the bias; using IP underestimates the risk. PSI Basel 29 OCT 2019 • At IA: AE probability well estimated only for early events with high bias for later events.
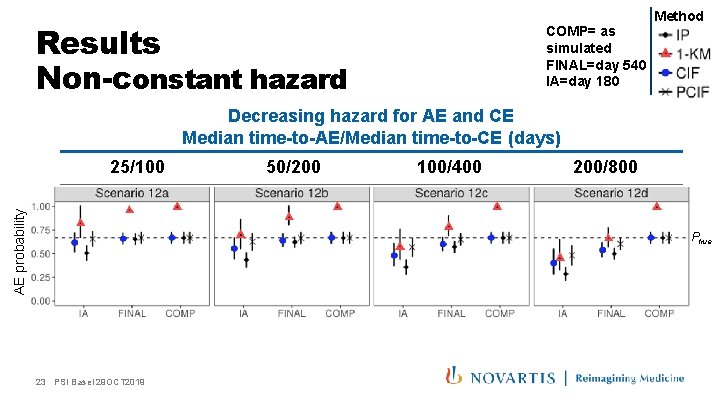
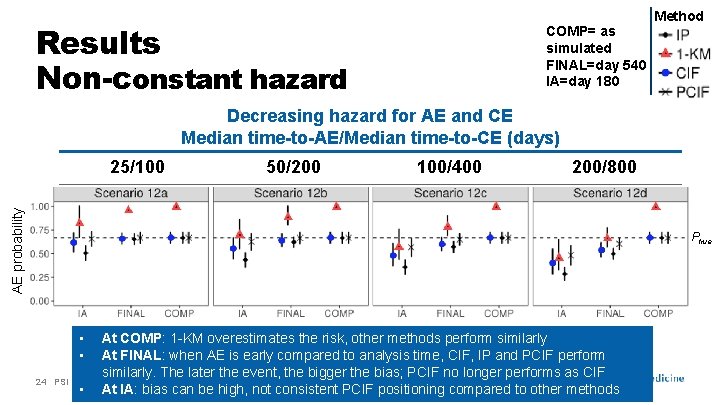
Results Non-constant hazard COMP= as simulated FINAL=day 540 IA=day 180 Method Decreasing hazard for AE and CE Median time-to-AE/Median time-to-CE (days) AE probability 25/100 50/200 100/400 200/800 Ptrue 23 PSI Basel 29 OCT 2019
Results Non-constant hazard COMP= as simulated FINAL=day 540 IA=day 180 Method Decreasing hazard for AE and CE Median time-to-AE/Median time-to-CE (days) 50/200 100/400 200/800 AE probability 25/100 Ptrue • • 24 At COMP: 1 -KM overestimates the risk, other methods perform similarly At FINAL: when AE is early compared to analysis time, CIF, IP and PCIF perform similarly. The later the event, the bigger the bias; PCIF no longer performs as CIF PSI Basel 29 OCT 2019 • At IA: bias can be high, not consistent PCIF positioning compared to other methods
Conclusion (1/2) • Methods ordering • As expected, 1 -KM always provided the highest probability while IP provided the lowest • The relative positioning of PCIF compared to the other methods was not systematic, sometimes underestimated, sometimes overestimated the risk • For FINAL, – when the AE occured early compared to the time of analysis (e. g. median AE time 25, 50, 100 days vs. analysis cutoff day 540 or «mature data» ), all methods, expect 1 -KM, performed similarly – CIF generally out performed the other methods • For IA – Except when the event occured early compared to the analysis time (e. g. median AE time 25, 50 days vs. analysis cutoff day 180), the estimates obtained at IA generally underestimated the risk (except with 1 -KM) 25 PSI Basel 29 OCT 2019
Conclusion (2/2) Back to initial question ”Do these methods reasonably estimate the AE probability at time of IA, when DMC needs to take decision on safety of the drug? ” • Based on current simulated scenarios, answer clearly «NO» • Recommendations 1. use of CIF • Over-performed compared to the other methods in a range of scenario also at FINAL • Allows comparisons between analysis (i. e. CIF at 6 months can be estimated at the IA and the FINAL) and external source if patients characteristics remain unchanged over the accrual period. This could be of particular interest for DMCs. 2. use of the estimand framework also for safety • Clarify question • What time horizon is studied (e. g. 6 months, 12 months)? • What is the intercurrent event i. e. how is the CE defined? 26 PSI Basel 29 OCT 2019
References § Allignol A. , Beyersmann J. , Schmoor C. (2016). Statistical issues in the analysis of adverse events in time-to-event data. Pharmaceutical Statistics 15, 297 -305. § Beyersmann J. , Allignol A. , Schumacher M. (2012). Competing risks and multistate models with R Springer: New York. § Unkel S. , Amiri M. , Benda N. , et al. (2018). On estimands and the analysis of adverse events in the presence of varying follow-up times within the benefit assessment of therapies. Pharmaceutical Statistics, 1 -18. 27 PSI Basel 29 OCT 2019
Thank you