Norminal Cumulative Frequency Valid Percent 140 50 0


 E 2 n")


- Slides: 63
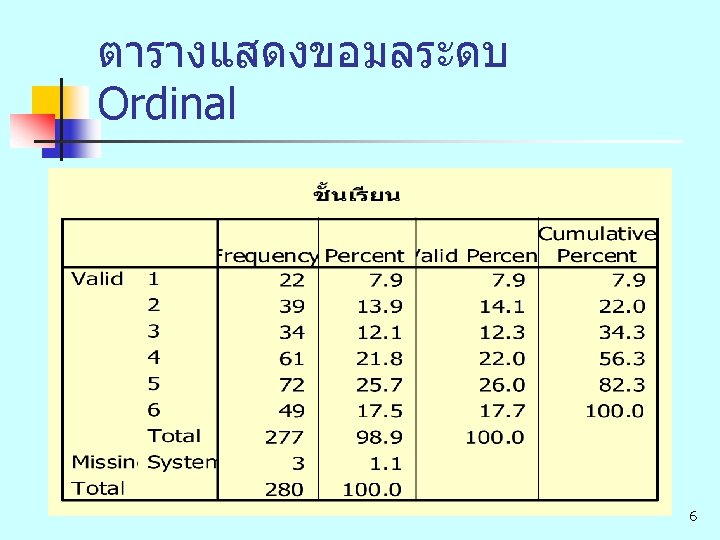
ขอมลระดบ Norminal เพศ Cumulative Frequency Valid Percent ชาย 140 50. 0 หญง 140 50. 0 100. 0 Total 280 100. 0 5
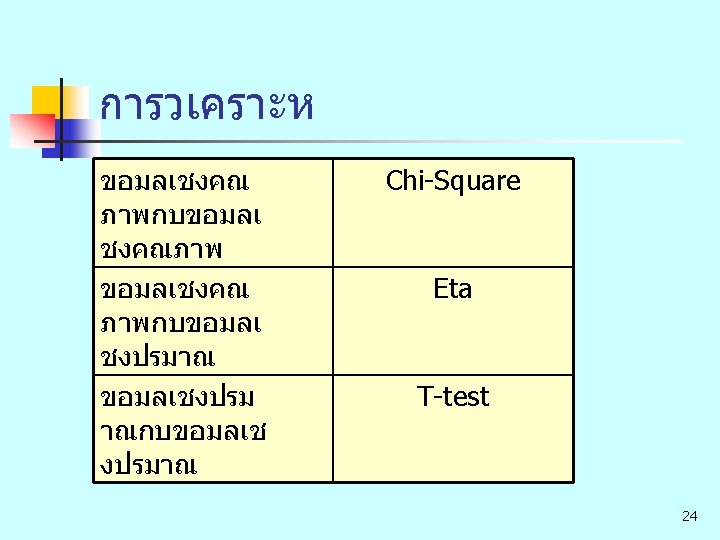
��������������� Mean Mode Variance SD Non Parametric t-test Nominal Ordinal Chi Square Median Test Sign Test Spearman Mann-Whitney ANOVA ANCOVA Factor Analysis Pearson’s 9
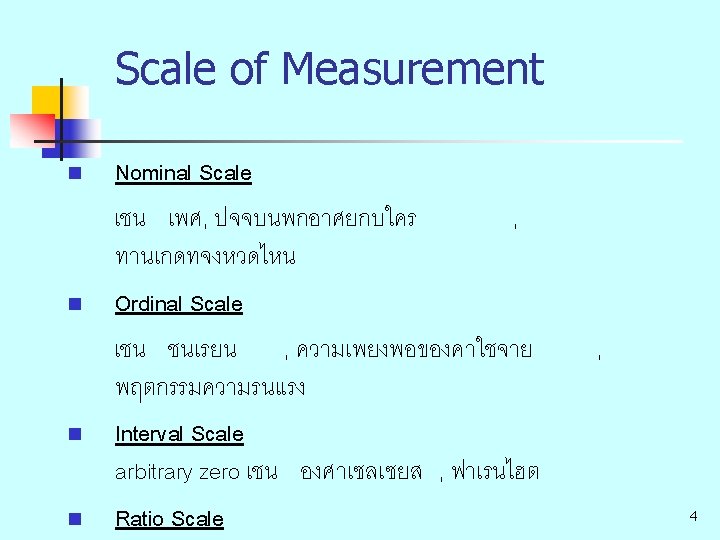
������� RATIO Parametric INTERVAL ORDINAL NOMINAL Non-Parametric Geometric Mean Coefficient of Variation Median, Percentile Spearman Kendall, Kendall W Mode, Frequency Contingency Coefficient 11
Alpha and Beta errors THE TRUTH CONCLUSION drawn from analysis A=B Accept H 0 : A = B Correct B Error Accept H 1 : A = B a Error Correct 27
Normal Distribution Mean= 82 mm. Hg, SD=10 mm. Hg 28
Normal Distribution (Mean, SD( mean= 0, SD=1 -3 -2 -1 0 +1 +2 +3 29
Normal Distribution (Z score( -2. 576 -1. 96 -1 0 +1 +1. 96 +2. 576 Z 30
95% Confidence Interval 95% C. I. = Mean + 2 SD 31
Z distribution n n โคงเรมท – Infinity ไปถง + Infinity Mean=0, SD=1 32
t distribution n n student’s distribution sample < 30 T distribution = A symmetric distribution with mean zero and a standard deviation larger than that for the normal distribution for small sample sizes. As n increase t distribution approaches the normal distribution. 33
F distribution n A continuous statistical distribution which arises in the testing of whether two observed samples have the same variance. F distribution=The probability distribution used to test the equality of two estimates of the variance. It is the distribution use with the F-test in ANOVA 34
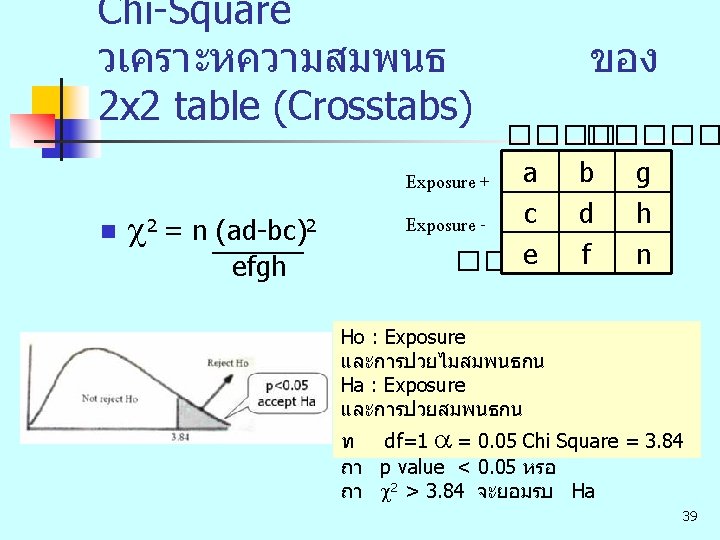
Chi-Square Table หาความสมพนธ n n n Cross tab ���� Exposure + a b Exposure - c d ท df=1 a=0. 05 Chi Square = 3. 84 degree of freedom (df) = (Row-1)x(Column-1) เชน ตาราง Contingency table (2 x 2 table) ม df=1 36
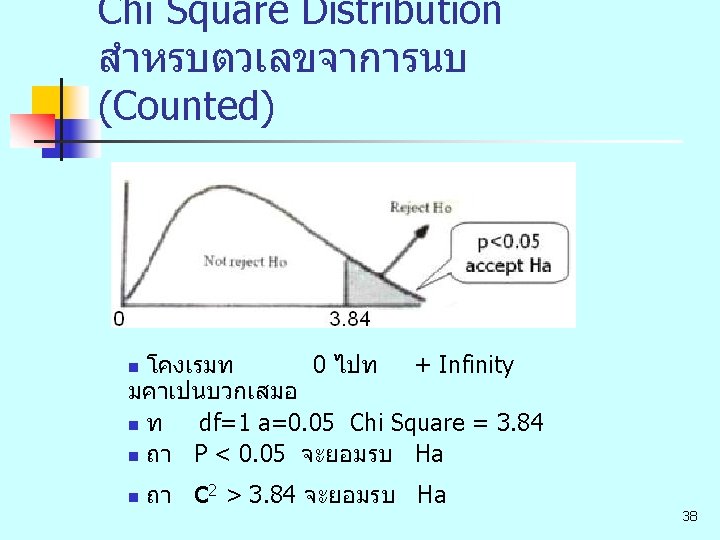
Chi-Square Observed 1, Observed 2 วเคราะหวาตางกนหรอไม c 2 = S (O-E) E 2 n n n Ho : Observed 1 และ Observed 2 ไมตางกน Ha : Observed 1 และ Observed 2 ตางกน Expected=(O 1+O 2)/2 ท df=1 a = 0. 05 Chi Square = 3. 84 ถา p value < 0. 05 หรอ ถา c 2 > 3. 84 จะยอมรบ Ha 37
ประเภทของ t-test Means Population t-test 1 ����� 2 ����� One Sample �������� Paired t-test Group 42
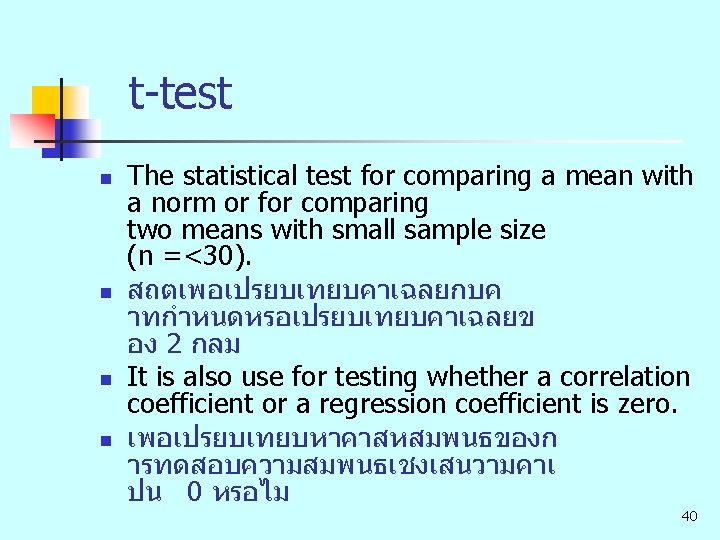
The One-Sample t Test n n procedure tests whether the mean of a single variable differs from a specified constant. ทดสอบวาคาเฉลยของกลมตวอย างมคาแตกตางจากคาคงททก ำหนดหรอไม 43
The Paired-Samples t Test n n procedure compares the means of two variables for a single group. It computes the differences between values of the two variables for each case and tests whether the average differs from 0. ทดสอบเปรยบเทยบคาเฉลย 2 สงจากกลมตวอยางเดยวโดยทดสอบวา คาแตกตางเฉลยแตกตางจาก 0 หรอไม 44
The Independent-Samples t Test n n procedure compares means for two groups of cases. Ideally, for this test, the subjects should be randomly assigned to two groups, so that any difference in response is due to the treatment (or lack of treatment) and not to other factors. ทดสอบคาเฉลยตวแปรของ 2 กลมตวอยางโดยการสมซงปจจยท สงผลทเกดความแตกตางตองมาจากป จจยทกำหนดเทานน 45
Association r = Correlation Coefficient Positive Association r = +1 . . . Negative Association r = -1 . . No Association Except Non-Linear r=0 . . . 47
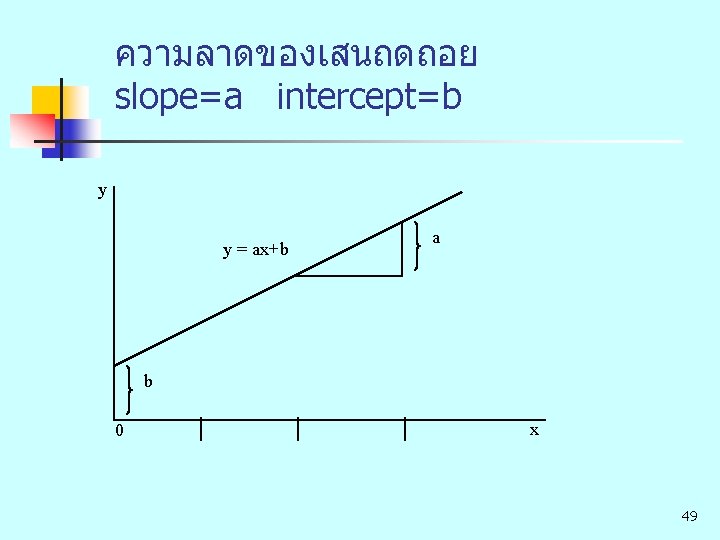
Association r = Correlation Coefficient x ��� y �������� y . . . ������ slope = 0. . x ��� y ���������� Mathematics Relationship. . x 48
ความถดถอยชนดอนๆ ทไมใชเสนตรง n n Polynomial Regression y=a+bx+cx 2+dx 3+. . . Multiple Regression y=a+ b 1 x 1 + b 2 x 2 + b 3 x 3 +…+bnxn Non-Linear Regression y=acbx Sigmoid Curves 53
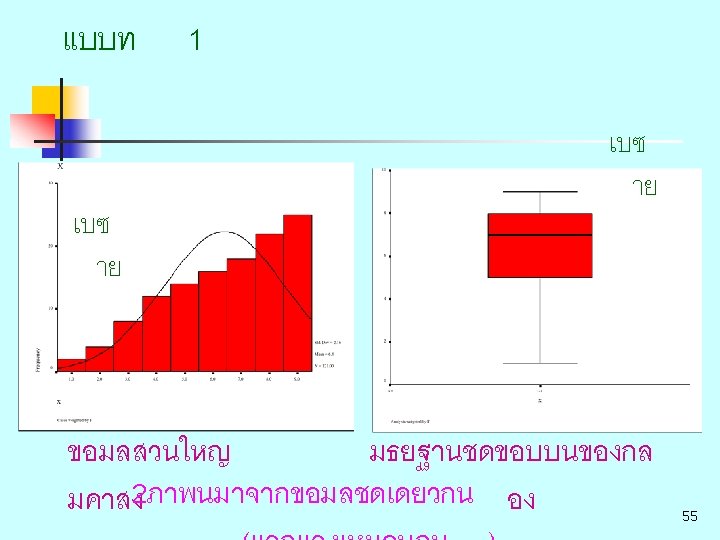
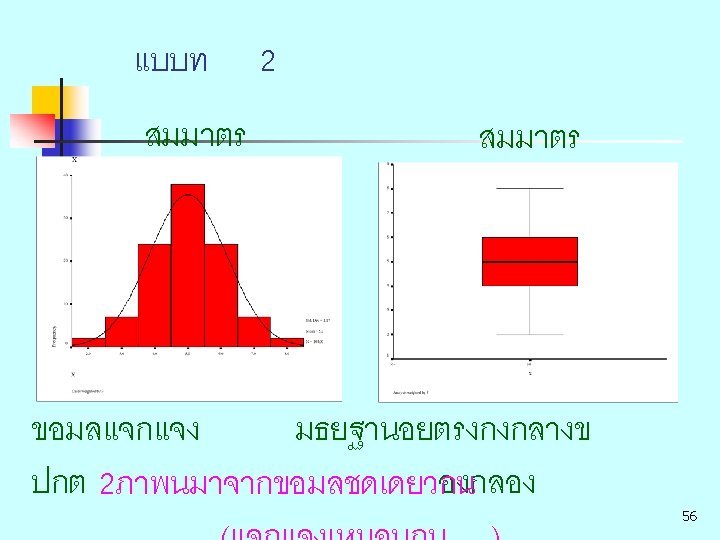
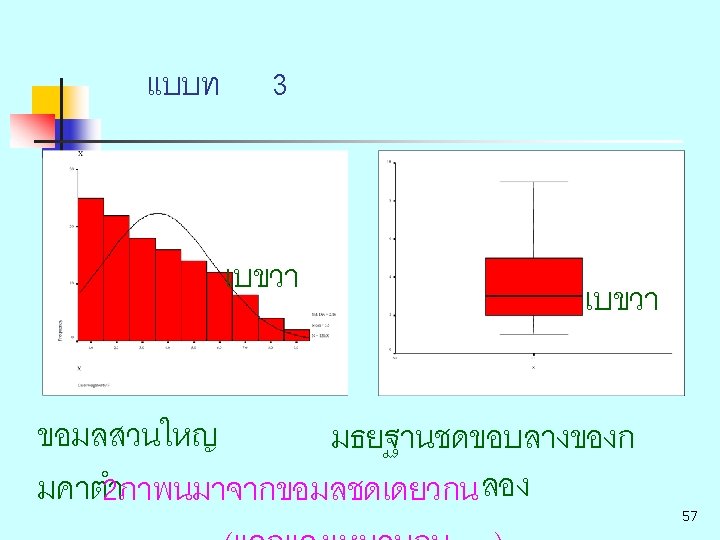
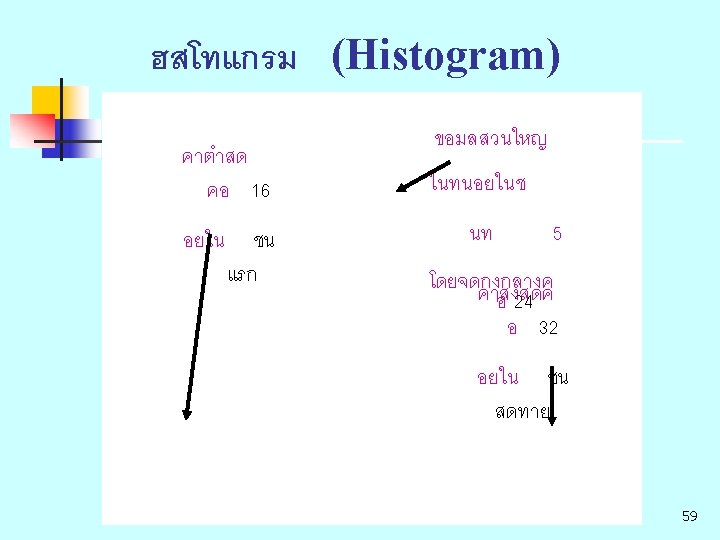
Histrogram 60
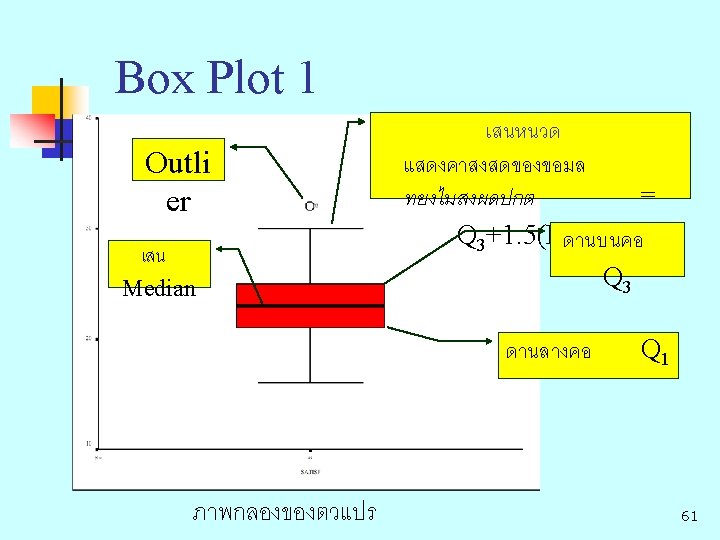
Box Plot 62