
Grade B Cumulative frequency Construct and interpret cumulative
Grade B Cumulative frequency Construct and interpret cumulative frequency diagrams (for grouped discrete as well as continuous data) If you have any questions regarding these resources or come across any errors, please contact helpful-report@pixl. org. uk
Key Vocabulary Cumulative frequency Median Quartiles
Cumulative frequency We will have a frequency table given to us. To draw a cumulative frequency graph we need to add a column to our frequency table to calculate the running total, the cumulative frequency.
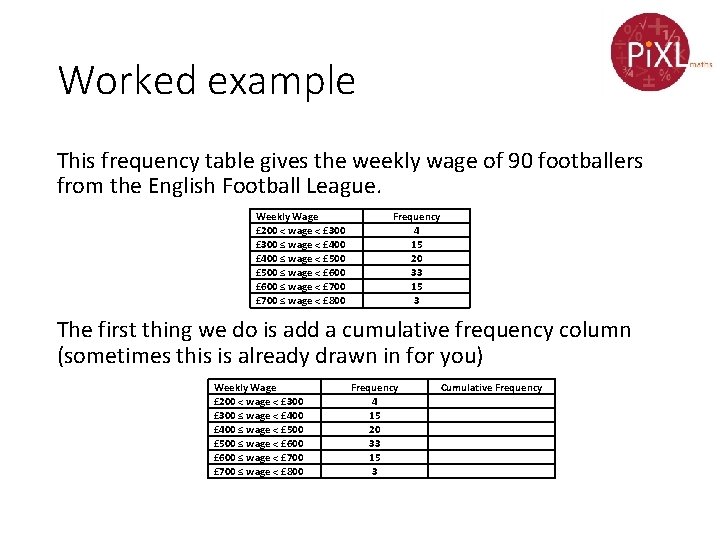
Worked example This frequency table gives the weekly wage of 90 footballers from the English Football League. Weekly Wage £ 200 < wage < £ 300 ≤ wage < £ 400 ≤ wage < £ 500 ≤ wage < £ 600 ≤ wage < £ 700 ≤ wage < £ 800 Frequency 4 15 20 33 15 3 The first thing we do is add a cumulative frequency column (sometimes this is already drawn in for you) Weekly Wage £ 200 < wage < £ 300 ≤ wage < £ 400 ≤ wage < £ 500 ≤ wage < £ 600 ≤ wage < £ 700 ≤ wage < £ 800 Frequency 4 15 20 33 15 3 Cumulative Frequency
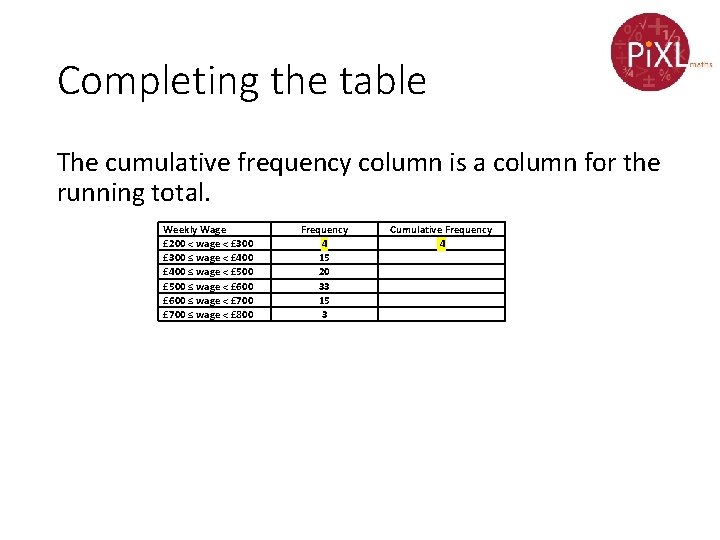
Completing the table The cumulative frequency column is a column for the running total. Weekly Wage £ 200 < wage < £ 300 ≤ wage < £ 400 ≤ wage < £ 500 ≤ wage < £ 600 ≤ wage < £ 700 ≤ wage < £ 800 Frequency 4 15 20 33 15 3 Cumulative Frequency 4
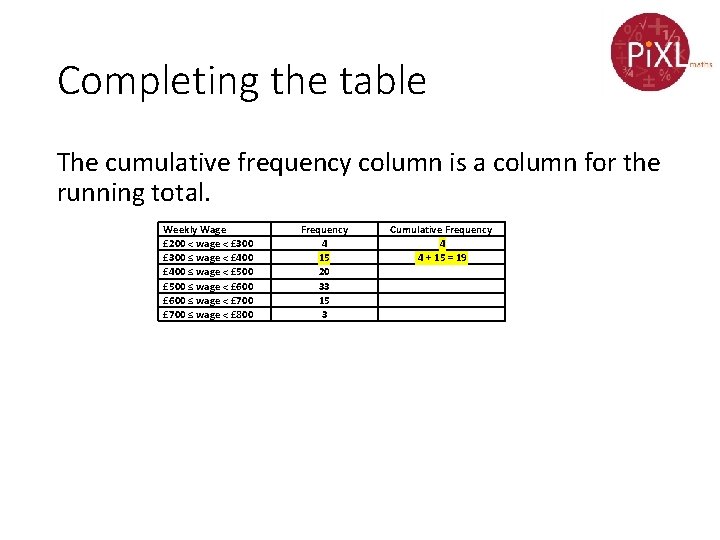
Completing the table The cumulative frequency column is a column for the running total. Weekly Wage £ 200 < wage < £ 300 ≤ wage < £ 400 ≤ wage < £ 500 ≤ wage < £ 600 ≤ wage < £ 700 ≤ wage < £ 800 Frequency 4 15 20 33 15 3 Cumulative Frequency 4 4 + 15 = 19
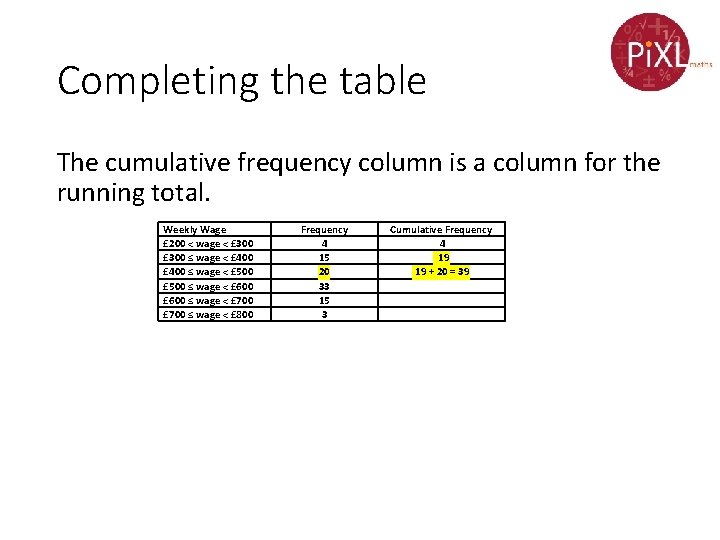
Completing the table The cumulative frequency column is a column for the running total. Weekly Wage £ 200 < wage < £ 300 ≤ wage < £ 400 ≤ wage < £ 500 ≤ wage < £ 600 ≤ wage < £ 700 ≤ wage < £ 800 Frequency 4 15 20 33 15 3 Cumulative Frequency 4 19 19 + 20 = 39
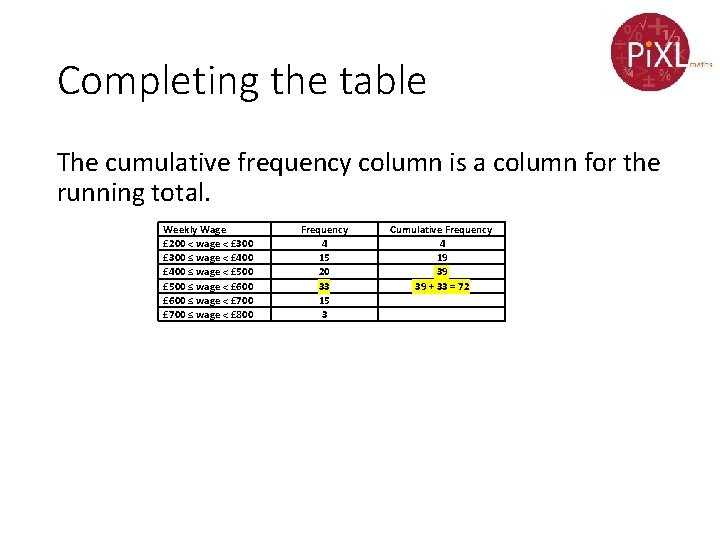
Completing the table The cumulative frequency column is a column for the running total. Weekly Wage £ 200 < wage < £ 300 ≤ wage < £ 400 ≤ wage < £ 500 ≤ wage < £ 600 ≤ wage < £ 700 ≤ wage < £ 800 Frequency 4 15 20 33 15 3 Cumulative Frequency 4 19 39 39 + 33 = 72
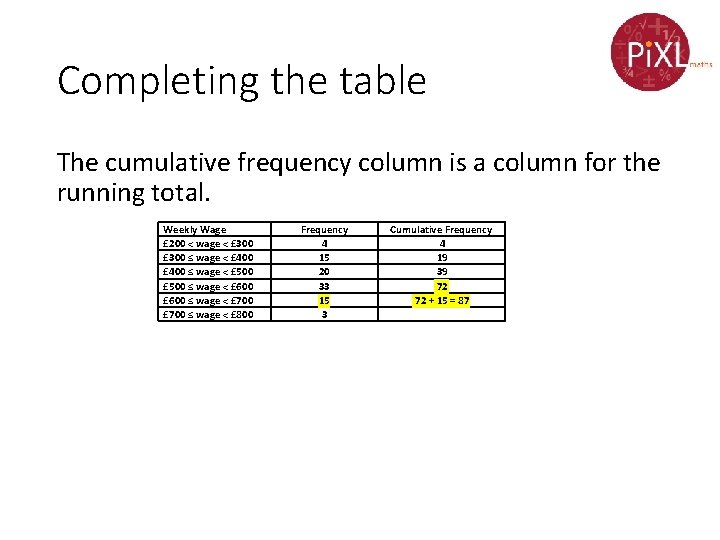
Completing the table The cumulative frequency column is a column for the running total. Weekly Wage £ 200 < wage < £ 300 ≤ wage < £ 400 ≤ wage < £ 500 ≤ wage < £ 600 ≤ wage < £ 700 ≤ wage < £ 800 Frequency 4 15 20 33 15 3 Cumulative Frequency 4 19 39 72 72 + 15 = 87
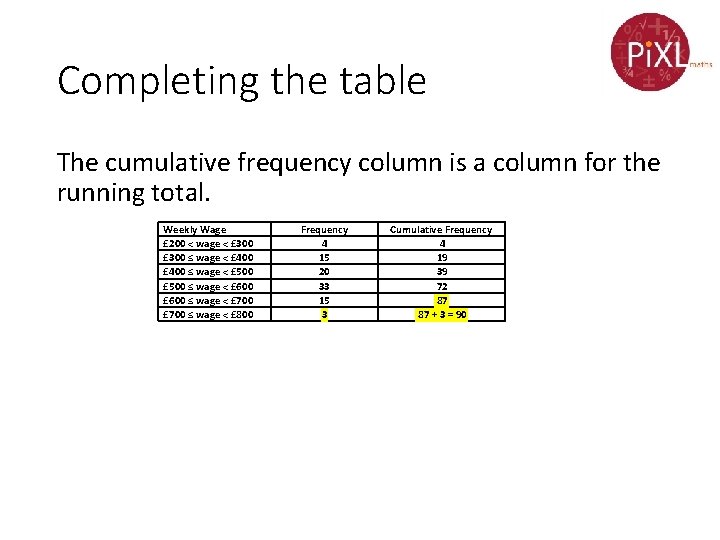
Completing the table The cumulative frequency column is a column for the running total. Weekly Wage £ 200 < wage < £ 300 ≤ wage < £ 400 ≤ wage < £ 500 ≤ wage < £ 600 ≤ wage < £ 700 ≤ wage < £ 800 Frequency 4 15 20 33 15 3 Cumulative Frequency 4 19 39 72 87 87 + 3 = 90
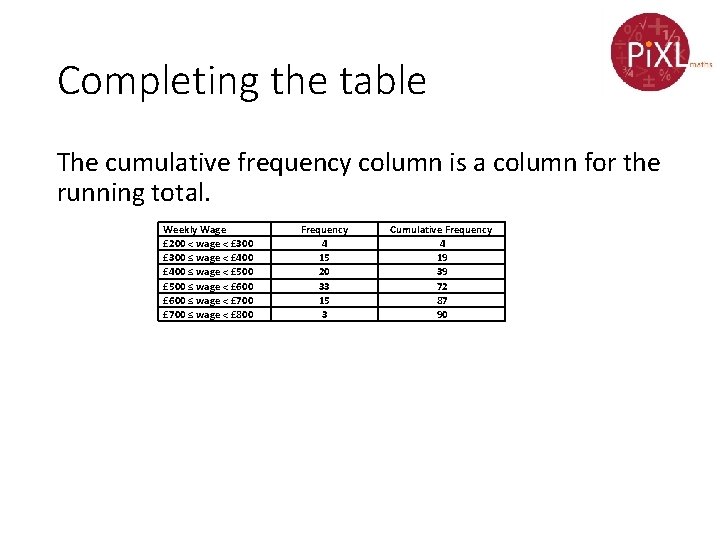
Completing the table The cumulative frequency column is a column for the running total. Weekly Wage £ 200 < wage < £ 300 ≤ wage < £ 400 ≤ wage < £ 500 ≤ wage < £ 600 ≤ wage < £ 700 ≤ wage < £ 800 Frequency 4 15 20 33 15 3 Cumulative Frequency 4 19 39 72 87 90
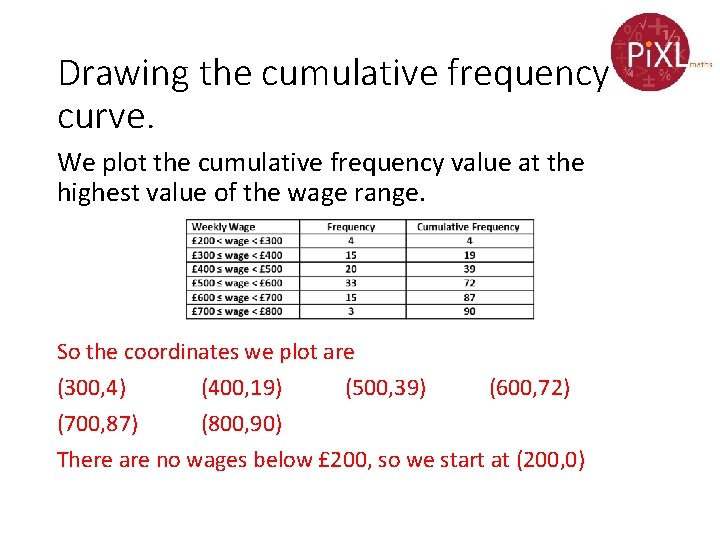
Drawing the cumulative frequency curve. We plot the cumulative frequency value at the highest value of the wage range. So the coordinates we plot are (300, 4) (400, 19) (500, 39) (600, 72) (700, 87) (800, 90) There are no wages below £ 200, so we start at (200, 0)
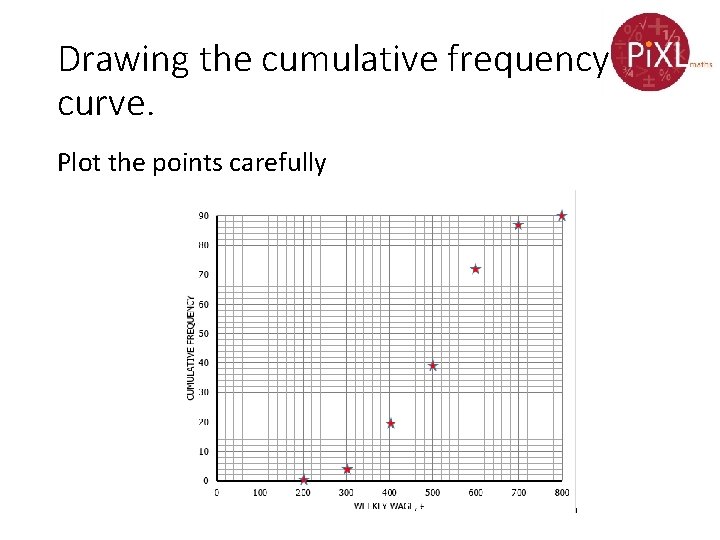
Drawing the cumulative frequency curve. Plot the points carefully
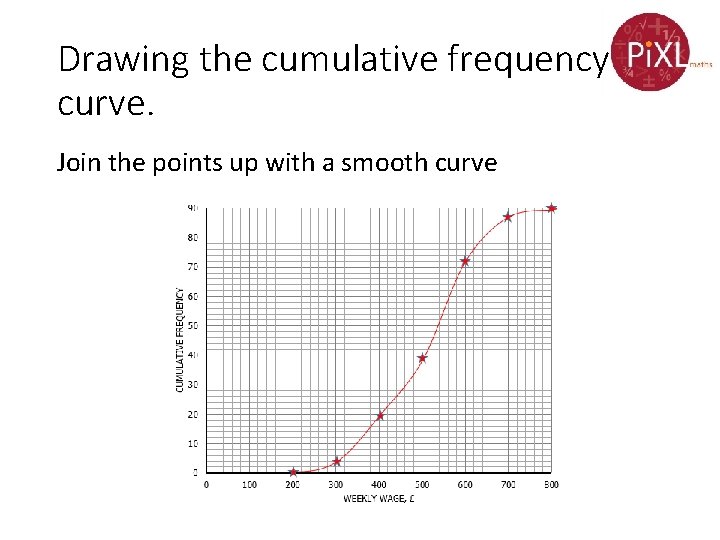
Drawing the cumulative frequency curve. Join the points up with a smooth curve
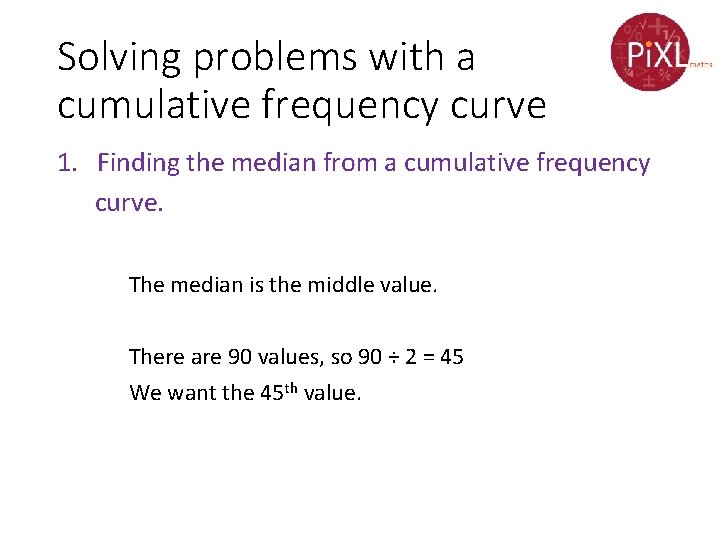
Solving problems with a cumulative frequency curve 1. Finding the median from a cumulative frequency curve. The median is the middle value. There are 90 values, so 90 ÷ 2 = 45 We want the 45 th value.
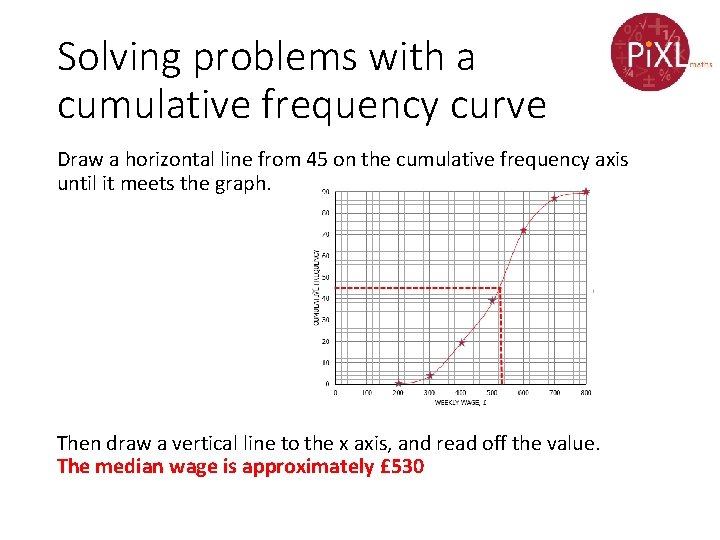
Solving problems with a cumulative frequency curve Draw a horizontal line from 45 on the cumulative frequency axis until it meets the graph. Then draw a vertical line to the x axis, and read off the value. The median wage is approximately £ 530
Solving problems with a cumulative frequency curve 2. Finding the lower and upper quartiles. We follow the same procedure, except instead of dividing by 2 • we divide by 4 for the lower quartile • We divide by 4 then multiply by 3 for the upper quartile Lower quartile is the 90 ÷ 4 = 22. 5 th value Upper quartile is the 90 x 3 ÷ 4 = 67. 5 th value
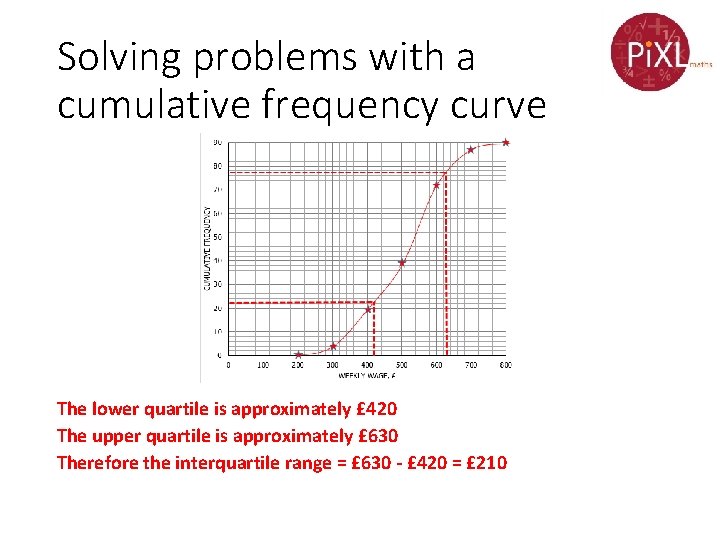
Solving problems with a cumulative frequency curve The lower quartile is approximately £ 420 The upper quartile is approximately £ 630 Therefore the interquartile range = £ 630 - £ 420 = £ 210
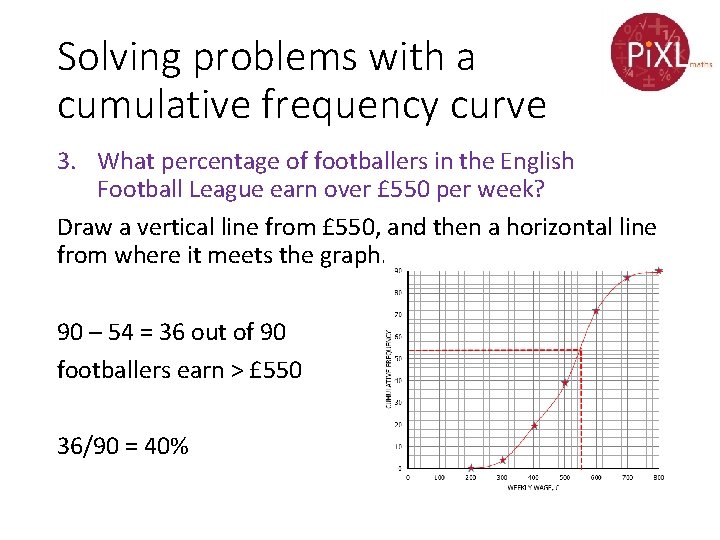
Solving problems with a cumulative frequency curve 3. What percentage of footballers in the English Football League earn over £ 550 per week? Draw a vertical line from £ 550, and then a horizontal line from where it meets the graph. 90 – 54 = 36 out of 90 footballers earn > £ 550 36/90 = 40%
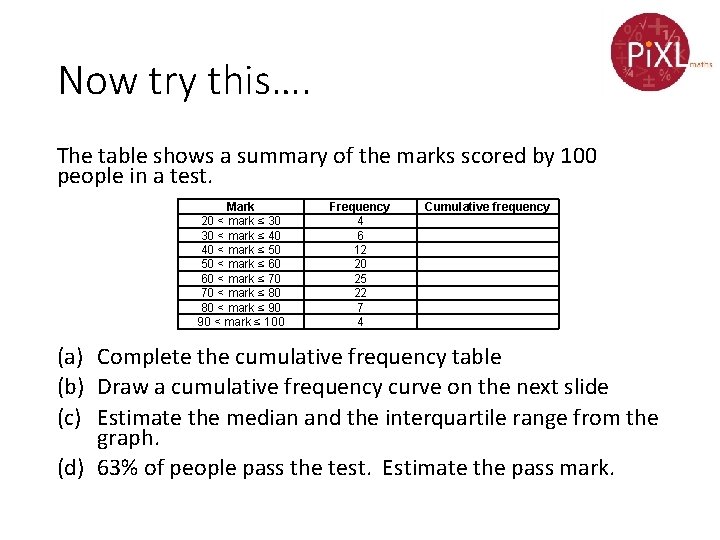
Now try this…. The table shows a summary of the marks scored by 100 people in a test. Mark 20 < mark ≤ 30 30 < mark ≤ 40 40 < mark ≤ 50 50 < mark ≤ 60 60 < mark ≤ 70 70 < mark ≤ 80 80 < mark ≤ 90 90 < mark ≤ 100 Frequency 4 6 12 20 25 22 7 4 Cumulative frequency (a) Complete the cumulative frequency table (b) Draw a cumulative frequency curve on the next slide (c) Estimate the median and the interquartile range from the graph. (d) 63% of people pass the test. Estimate the pass mark.
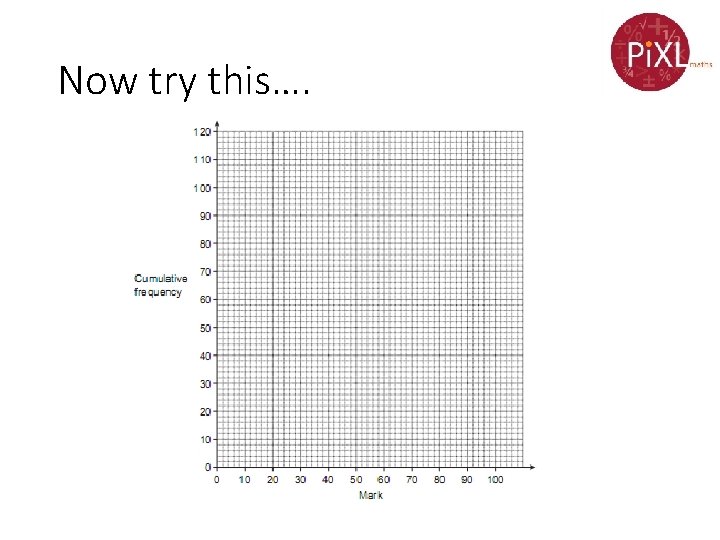
Now try this….
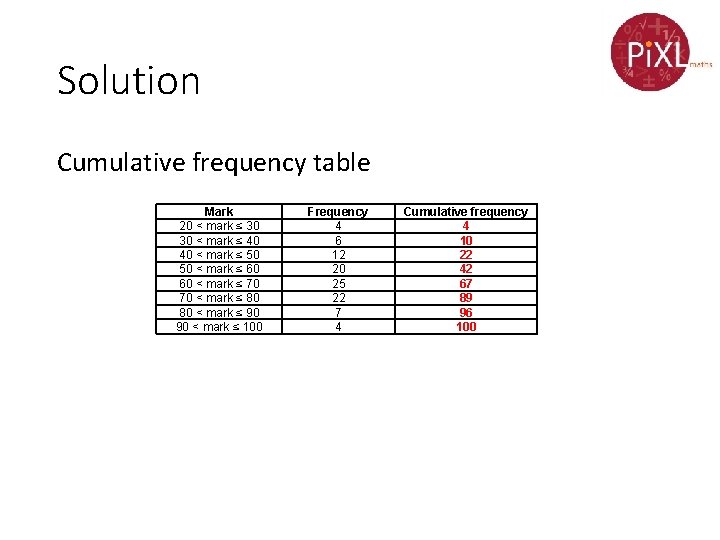
Solution Cumulative frequency table Mark 20 < mark ≤ 30 30 < mark ≤ 40 40 < mark ≤ 50 50 < mark ≤ 60 60 < mark ≤ 70 70 < mark ≤ 80 80 < mark ≤ 90 90 < mark ≤ 100 Frequency 4 6 12 20 25 22 7 4 Cumulative frequency 4 10 22 42 67 89 96 100
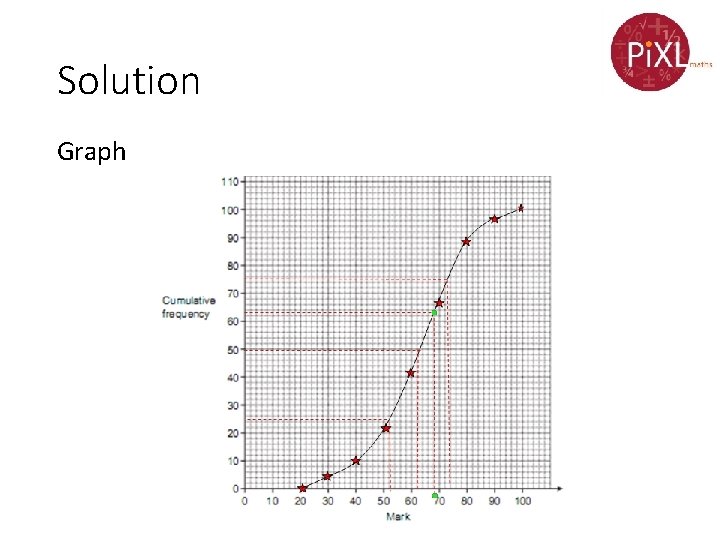
Solution Graph
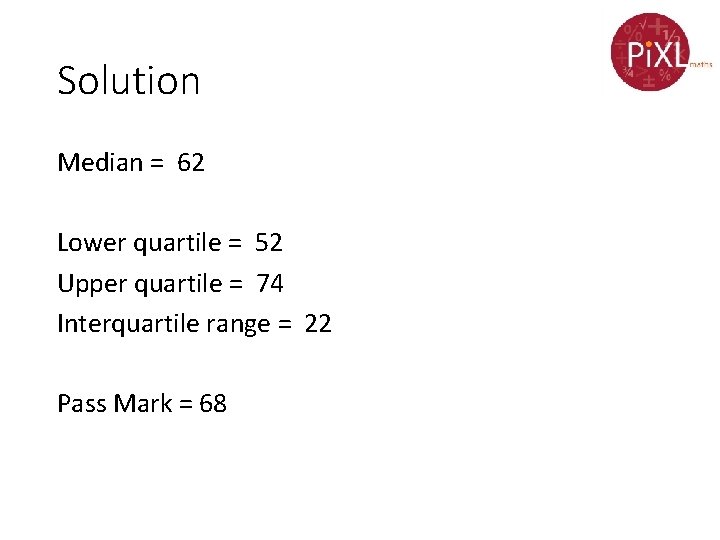
Solution Median = 62 Lower quartile = 52 Upper quartile = 74 Interquartile range = 22 Pass Mark = 68
- Slides: 24