New Jersey Department of Education NJDOE School Performance
![New Jersey Department of Education (NJDOE) School Performance Reports [Title or Focus of Presentation] New Jersey Department of Education (NJDOE) School Performance Reports [Title or Focus of Presentation]](https://slidetodoc.com/presentation_image_h/e8bcefcf82b375dfddf5cdba76cde9b5/image-1.jpg)


- Slides: 31
![New Jersey Department of Education NJDOE School Performance Reports Title or Focus of Presentation New Jersey Department of Education (NJDOE) School Performance Reports [Title or Focus of Presentation]](https://slidetodoc.com/presentation_image_h/e8bcefcf82b375dfddf5cdba76cde9b5/image-1.jpg)
New Jersey Department of Education (NJDOE) School Performance Reports [Title or Focus of Presentation] [Time and Date of Presentation] [Names of Presenters]

How to Use This Optional Presentation Template • This presentation includes sample slide templates that you can use or consider when presenting School Performance Reports data to your communities. • Feel free to manipulate the slides provided or create your own slides to show data to your school communities and begin to collaborate on ways to improve student outcomes. • Any information in green should be edited by the school or district using the template. Optional School Performance Reports Template 2018 -2019 2

2017 -18 School Performance Reports • The School Performance Reports reflect the New Jersey Department of Education’s extensive efforts to engage with parents, students, and school communities, and share the information this is most valuable in providing a picture of overall school performance. Communities are encouraged to use these reports to learn more, start conversations, and engage. • In addition to meeting the federal report requirements under ESSA, NJDOE is committed to developing reports that provide stakeholders with a broader picture of their schools and districts. • Along with the detailed School Performance Reports for each school, district, and state, one-page Summary Reports for each school and district are also available. The Summary Reports provide a high-level summary of how well a school or district is performing. • The reports and resources are also translated into Spanish. Optional School Performance Reports Template 2018 -2019

Where Can You Find the Performance Reports? You can find the performance reports on the New Jersey Department of Education homepage, www. nj. gov/education. Use the “School Performance Reports” link in the center of the page. Optional School Performance Reports Template 2018 -2019 4

School Performance Reports Homepage You can also go directly to the School Performance Reports homepage, www. njschooldata. org. Optional School Performance Reports Template 2018 -2019 5

Summary Performance Reports Optional School Performance Reports Template 2018 -2019 6

What Kinds of Information Do the School Performance Reports Include? The New Jersey School Performance Reports contain hundreds of data points about schools and districts across New Jersey including: üSchool and district overviews üDemographic information üStudent growth üAcademic achievement üCollege and career readiness üGraduation and post-secondary information üSchool climate and environment üStaff information üSchool Accountability üSchool and district narrative information Optional School Performance Reports Template 2018 -2019 7

New Data Added to the Full Reports NJDOE added several new data elements to the School Performance Reports based on requests received during stakeholder engagement: • • Career and Technical Education (CTE) Program Enrollment Dual Enrollment by subject area Graduation Pathways Progress toward English Language Proficiency Teacher and Administrator Demographics Harassment, Intimidation, and Bullying (HIB) Incidents by Nature Police Notifications New Narrative categories: Technology and STEM, Student Safety, Early Childhood Education and Pre-K Optional School Performance Reports Template 2018 -2019 8

Overview of Performance on Accountability Indicators: 2016 -17 vs. 2017 -18 Data Measure 2016 -17 2017 -18 ELA Growth (m. SGP) [Insert 2016 -17 ELA m. SGP – from 2016 -17 reports] [Insert 2017 -18 ELA m. SGP – from 2017 -18 reports] Math Growth (m. SGP) [Insert 2016 -17 Math m. SGP – from 2016 -17 reports] [Insert 2017 -18 Math m. SGP – from 2017 -18 reports] ELA Proficiency [Insert 2016 -17 ELA Proficiency Rate for Federal [Insert 2017 -18 ELA Proficiency Rate for Federal Accountability – from 2016 -17 reports] Accountability – from 2017 -18 reports] Math Proficiency [Insert 2016 -17 Math Proficiency Rate for Federal Accountability – from 2016 -17 reports] [Insert 2017 -18 Math Proficiency Rate for Federal Accountability – from 2017 -18 reports] 4 -Year Graduation Rate [Insert Class of 2017 4 -Year Graduation Rate] [Insert Class of 2018 4 -Year Graduation Rate] 5 -Year Graduation Rate [Insert Class of 2016 5 -Year Graduation Rate] [Insert Class of 2017 5 -Year Graduation Rate] Chronic Absenteeism [Insert 2016 -17 Chronic Absenteeism Rate – from 2016 -17 reports] [Insert 2017 -18 Chronic Absenteeism Rate – from 2017 -18 reports] Optional School Performance Reports Template 2018 -2019 9

New in the Reports: Teacher Demographic Information (1 of 2) Do the students in our classrooms have the opportunity to be led by diverse teachers? Teacher diversity improves outcomes for all students. Teachers and Students by Demographic Information – State Level White Hispanic Black or African American Asian Native Hawaiian or Pacific Islander American Indian or Alaska Native Two or More Races Students Across the State Teachers Across the State 0% 10% 20% Race White Hispanic Black or African American Asian Native Hawaiian or Pacific Islander American Indian or Alaska Native Two or More Races 30% 40% 50% 60% Teachers Across the State 83. 9% 7. 2% 6. 6% 1. 9% 0. 1% 0. 2% Optional School Performance Reports Template 2018 -2019 70% 80% 90% 100% Students Across the State 43. 4% 28. 7% 15. 6% 10. 0% 0. 2% 0. 1% 2. 0% 10

New in the Reports: Teacher Demographic Information (2 of 2) Edit the data by rightclicking the graph and selecting “Edit Data. ” Do not change the “Students and Teachers Across the State” bars found on the previous slide. Delete this Text Box by clicking it and hitting the “Backspace” key. Do the students in our classrooms have the opportunity to be led by diverse teachers? Teacher diversity improves outcomes for all students. Teachers and Students by Demographic Information – School Level White Hispanic Black or African American Asian Native Hawaiian or Pacific Islander American Indian or Alaska Native Two or More Races Students in our School Teachers in our School 0% 10% 20% Race White Hispanic Black or African American Asian Native Hawaiian or Pacific Islander American Indian or Alaska Native Two or More Races 30% 40% 50% 60% Teachers Across the State 20% 20% Optional School Performance Reports Template 2018 -2019 70% 80% 90% 100% Students Across the State 20% 20% 11

College and Career Readiness (1 of 2) The College and Career Readiness Section of the Summary Reports shows important information about students’ access to challenging coursework. Are students college and career ready? AP/IB Courses: [0. 0%] of 11 th and 12 th graders enrolled (State = 34. 9%) Dual Enrollment Courses: [0. 0%] of 11 th and 12 th graders enrolled (State = 13. 3%) Industry-Valued Credentials: [0. 0%] of student earned (State = 0. 9%) College Enrollment: [0. 0%] of graduates enrolled (State = 77. 9% [16 -month]) Optional School Performance Reports Template 2018 -2019 12

College and Career Readiness (2 of 2) The College and Career Readiness Section of the Summary Reports shows important information about students’ access to challenging coursework. Students Enrolled in One or More Visual and Performing Arts Classes Visual and Performing Arts Enrollment [0. 0%] of 6 th through 8 th graders enrolled (State = 89. 1%) [0. 0%] of 9 th through 12 th graders enrolled (State = 51. 2%) Optional School Performance Reports Template 2018 -2019 Students Enrolled in One or More Classes by Discipline – Grades 9 through 12 Discipline School State Music [0. 0%] 17. 8% Dance [0. 0%] 2. 1% Drama [0. 0%] 4. 0% Visual Arts [0. 0%] 32. 9% 13

New in the Reports: Progress Toward English Language Proficiency One of the more significant changes under federal law ESSA is that it elevated attention to English Learners (ELs) by adding a measure of English language proficiency (ELP) into the overall school accountability system. Now, all schools are accountable for ensuring ELs make progress toward ELP. Percentage of English Learners School District [Percentage of ELs in School] ELs in District] State 6. 5% Optional School Performance Reports Template 2018 -2019 Progress Toward English Language Proficiency School District [Progress of ELs in School] in District] State 50. 5% 14

How is a Specific Student Group Performing in Our District? Spotlight on Economically Disadvantaged (ED) Students Metric ED Students: School 1 Total: School 1 ED Students: State Total: State Percentage of population [Enter info] ELA Performance on State Assessment [Enter info] 38. 5% 56. 7% Math Performance on State Assessment [Enter info] 26. 6% 45. 0% Student Growth in ELA (m. SGP) [Enter info] 48 50 Student Growth in Math (m. SGP) [Enter info] 47 50 Graduation Rate (4 -year) [Enter info] 84. 6% 90. 9% Graduation Rate (5 -year) [Enter info] 87. 0% 92. 4% Post-secondary enrollment (16 month) [Enter info] 66. 5% 77. 9% Chronic Absenteeism Rate [Enter info] 16. 1% 10. 9% Optional School Performance Reports Template 2018 -2019 37. 4% 15

4 -Year Graduation Rates (%) Category Class of 2015 Class of 2016 Class of 2017 Class of 2018 School [0. 0%] District [0. 0%] State 89. 7% 90. 1% 90. 5% 90. 9% Optional School Performance Reports Template 2018 -2019 16

New in the Reports: Graduation Pathways What assessment did students use in order to meet their graduation assessment requirement? New information in the reports shows how our students are qualifying for graduation. Subject Pathways for Class of 2018 School District State ELA State Assessment [0. 0%] 57. 5% ELA Substitute Competency Assessment [0. 0%] 29. 9% ELA Portfolio Appeals [0. 0%] 4. 7% ELA Alternate Requirements specified in IEP [0. 0%] 5. 1% Math State Assessment [0. 0%] 50. 8% Math Substitute Competency Assessment [0. 0%] 34. 5% Math Portfolio Appeals [0. 0%] 2. 8% Math Alternate Requirements specified in IEP [0. 0%] 5. 9% Optional School Performance Reports Template 2018 -2019 17

Student Safety in the District Narrative Information on Student Safety • [Enter student safety narrative information from School Performance Reports] Optional School Performance Reports Template 2018 -2019 Violence, Vandalism, HIB, and Substance Offenses Number of Incidents: District Number of Incidents: State Violence [#] 10, 838 Vandalism [#] 1, 587 Weapons [#] 877 Substances [#] 4, 463 Harassment, Intimidation, Bullying (HIB) [#] 7, 522 Total Unique Incidents [#] 24, 938 Incidents Per 100 Students Enrolled [#] 1. 77 Incident Type 18

Early Childhood Education in the District Narrative Information on Early Childhood Education Enrollment Trends by Full/Half Day PK and KG in our District • [Enter Early Childhood Education narrative information from School Performance Reports] Type of Pre-K 2015 -2016 -2017 -2018 PK - Half Day [Enter info] PK - Full Day [Enter info] KG - Half Day [Enter info] KG - Full Day [Enter info] Optional School Performance Reports Template 2018 -2019 19

Student Supports and Services Narrative Information on Student Supports and Services • [Enter Student Supports and Services narrative information from School Performance Reports] Optional School Performance Reports Template 2018 -2019 Student and Staff Ratios Category District Students to Teachers [0: 0] Students to Administrators [0: 0] Teachers to Administrators Students to Librarian/Media Specialists Students to Nurses [0: 0] Students to Counselors [0: 0] Students to Child Study Team [0: 0] 20

Postsecondary Enrollment Postsecondary Information from Narrative Postsecondary Enrollment Rates: 16 -month • [Enter Postsecondary narrative information from School Performance Reports] Student Group Optional School Performance Reports Template 2018 -2019 District State Total Population [0. 0%] 72. 8% White [0. 0%] 79. 4% Hispanic [0. 0%] 59. 1% Black or African American [0. 0%] 61. 1% Asian, Native Hawaiian, or Pacific Islander [0. 0%] 88. 2% American Indian or Alaska Native [0. 0%] 74. 5% Two or More Races [0. 0%] 24. 4% 21

Questions? [Feel free to include questions geared toward the needs of your community. See the NJDOE School Performance Reports Administrator, Educator, and Parent and Community Member Guides on www. njschooldata. org for some ideas. ] Optional School Performance Reports Template 2018 -2019

Please Note • Slides 23 through 28 are just for districts who have had schools identified for Comprehensive Support and Improvement or Targeted Support and Improvement. • All slides in this presentation are optional. Optional School Performance Reports Template 2018 -2019 23

Our Schools [Insert schools and designations of Comprehensive Support and Improvement or Targeted Support and Improvement on this page. ] Optional School Performance Reports Template 2018 -2019

How Was Our School Identified? • New Jersey’s ESSA school accountability system provides a formula to determine a performance score, which is based on various measures of progress (accountability indicators). • Our school has been identified based on its relative low performance using these measures. Optional School Performance Reports Template 2018 -2019

What is a Comprehensive School? • Schools performing at or below the bottom fifth percentile of all Title I schools • High schools with a graduation rate of 67% or less Optional School Performance Reports Template 2018 -2019

What is a Targeted School? • Schools with a subgroup performing at or below the bottom 5% threshold of Title I schools, or • Schools with a subgroup that misses all interim targets and performs below the state average for all available indicators for two consecutive years • Subgroups include different racial and ethnic groups, English learners, students with disabilities, and economically disadvantaged students Optional School Performance Reports Template 2018 -2019

What Happens Next? Schools identified for support and improvement work in partnership with their education community of parents, families, educators, and community members throughout the year to: ü Assess needs related to the areas of weakness ü Identify strategies and resources that can impact improvement ü Create an Annual School Plan that will outline specific steps ü Outline a timeline for completion of those steps ü Understand the steps needed to be removed from status Optional School Performance Reports Template 2018 -2019

How Can I Get Involved? • Reach out to your school and district to find out about opportunities for how parents, families, and educators will work together to improve their schools. • Schools and districts are required to engage with parents, families, educators, and community members throughout the year to assess needs related to the areas of weakness, identify strategies and resources that can impact improvement, create an improvement plan and timeline for completion. • See NJDOE’s Stakeholder Engagement Guide (http: //bit. ly/njengage) for detailed descriptions of these requirements. Optional School Performance Reports Template 2018 -2019

Ways to Engage with Our School • [Optional: Insert planned school engagement and/or information sessions] Optional School Performance Reports Template 2018 -2019

Have Feedback or Questions? • Additional resources are available at: www. njschooldata. org • Visit our district website for updates: [insert website url] • Email the district: [insert email here] • Take the NJDOE School Performance Reports feedback survey: www. surveymonkey. com/r/VKNTTRC • Visit the NJDOE website at: www. state. nj. us/education • Email the NJDOE: reportcard@doe. nj. gov Optional School Performance Reports Template 2018 -2019 31
 Nj institute for continuing legal education
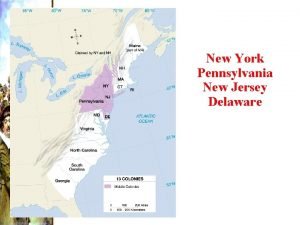
 New york pennsylvania new jersey delaware
 Drnj
Drnj Njdoe
Njdoe Peggy mcdonald njdoe
 Universal waste label
 New jersey space grant consortium
 Nj driver manual
 Piedmont region new jersey
 New jersey center for teaching and learning
 How many total squares are there
 Nj board of bar examiners
 Jersey accent video
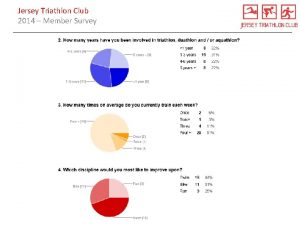
 Jersey triathlon club
 Nj dyslexia handbook
 New jersey plan
 Hesaa njfams
 Getting a driver license illegally may result in:
 Social emotional learning standards nj
 New jersey courts
 New jersey center for teaching and learning
 Italiani in new jersey
 Njscs
Njscs Virginia plan and new jersey plan venn diagram
 Drafting of the constitution
 Viva new jersey
 Viva new jersey vocabulary
 New jersey absolute location
 New jersey plan
 Sea lice new jersey
 Chapter 1 nj driver license system
 Dvrs hackensack nj

