Natural Gas Supply and Infrastructure Outlook NARUC Winter


 50 40 Announced")
 Oregon LNG (1. 5 Bcf) Prairie State")


 Implementation Matters A Few Reminders • What it means to comply with an")


- Slides: 18
Natural Gas Supply and Infrastructure Outlook NARUC Winter Meeting February 16, 2015 Amy Farrell VP of Market Development America’s Natural Gas Alliance
Driving Demand for Natural Gas
Supply for the Long Run Natural Gas Production Efficiency 1000 2600 800 2200 700 600 1800 500 400 1400 300 200 янв-10 1000 янв-11 янв-12 Rig Count янв-13 янв-14 Total Production (Bcf) Average # Rigs 900
Abundance = Affordability
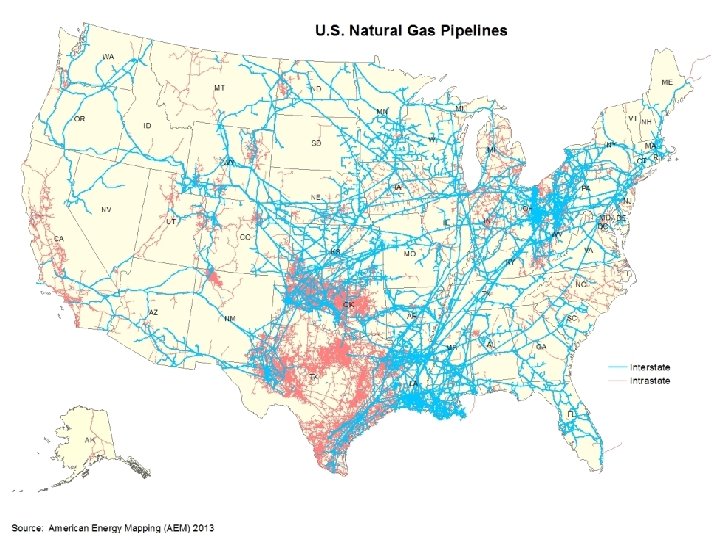
North American Pipeline Network Additions U. S. Pipeline Capacity Additions (Bcf/d) 50 40 Announced Projects: 55 Bcf/d Cumulative Additions: 131 Bcf/d Cumulative Additions: 61 Bcf/d 30 20 10 Source: EIA 18 20 17 20 16 20 15 20 14 20 13 20 12 20 11 20 10 20 09 20 08 20 07 20 06 20 05 20 04 20 03 20 02 20 01 20 20 00 0
Pipeline Projects Washington Expansion (. 77 Bcf) Oregon LNG (1. 5 Bcf) Prairie State (1. 5 Bcf) Nexus (1. 5 Bcf) OPEN Project (. 56 Bcf) Pacific Connector (1. 03 Bcf) Ohio Valley Connector (1. 2 Bcf) Downeast (. 63 Bcf) Leidy Southeast Expansion (. 53 Bcf) Northeast Energy Direct (2. 20 Bcf) Pennstar (. 51 Bcf) Constitution (. 67 Bcf) Rover (3. 25 Bcf) Magnum Gas Header (1. 2 Bcf) Atlantic Sunrise (. 87 Bcf) Dominion Supply Header (1. 5 Bcf) North-South Expansion (. 8 Bcf) Diamond East (1 Bcf) Leach Xpress (1. 5 Bcf) Cheniere Corpus Christi (2. 25 Bcf) Project Stage: Announced Early Development Advanced Development AIM (. 34 Bcf) Coastal Bend (1. 54 Bcf) Atlantic Coast (1. 5 Bcf) Dominion Keystone (1 Bcf) Penn. East (1 Bcf) MARC II (1 Bcf) Cameron Pipeline Expansion (2. 33 Bcf) Southern Trail (1. 05 Bcf) Sabal Trail (1 Bcf) Mountain Valley (2 Bcf)
Capacity Utilization and Growth Potential * Numbers in each state represent 2014 natural gas combined cycle unit capacity (MW)
“Available” Natural Gas Capacity
Potential Infrastructure Implications Source: DOE, Natural Gas Infrastructure Implications of Increased Demand from the Electric Power Sector, February 2015
Existing Tools and Market Policy Changes • Market Policy Changes to Enable Infrastructure Investment – Capacity Assurance Measures (e. g. PJM) – Pay for Performance Measures (e. g. ISO-NE) • Existing tools for reliable delivery – Pipeline Services – Alternative Contracting Mechanisms – Long term contracts or reserve investments 11
Reliable Delivery for Baseload Power Storage Location Coal Supply Rail System Coal-Fired Power Plant Firm Transportation and Storage /Flexible Services Or appropriate portfolio management Natural Gas Supply Storage Location (Depleted Reservoir, Salt Cavern, Aquifer) Natural Gas-Fired Power Plant
111(d) Implementation Matters A Few Reminders • What it means to comply with an average annual standard • Why considering infrastructure adequacy requires a forward looking assessment • What natural gas generation has to offer as a low-cost compliance option Critical Design Considerations • Rate-based standards (versus mass based standards) and separate treatment of new natural gas units enable states’ economic growth – Especially true for states that are benefiting from the manufacturing renaissance brought about by abundant, affordable natural gas liquids • Rate-based compliance keeps consumer costs down 13
Rate-Based Standard = Lower Consumer Cost Rate-Based Standard Clearing Price before CO 2 Policy = $56/MWh Clearing Price after CO 2 Policy = $51/MWh Coal NGCC Clearing Price after CO 2 Policy = $60/MWh Mass-Based Standard Clearing Price before CO 2 Policy = $56/MWh Renewables Coal Renewables In the rate-based example, assuming a state goal of 1, 300 lbs/MWh and a CO 2 price of $20 per ton: (1) renewable energy sources would earn a CO 2 credit of $13/MWh; (2) coal plants would incur a cost of $8/MWh; and (3) NGCC plants would earn a CO 2 credit of $5/MWh. Although, NGCC plants earn a CO 2 credit of $5/MWh, wholesale electric prices would decline by an equivalent amount (i. e. , net revenues remain unchanged). In the mass-based example shown, assuming a CO 2 price of $10 per ton: (1) renewable energy sources would not be charged; (2) coal plants would incur a cost of $11/MWh; and (3) NGCC plants would incur a cost of $4/MWh. With NGCC units on the margin, wholesale electric prices would increase to reflect the carbon price. NGCC
www. anga. us twitter @ANGAus Amy Farrell Vice President, Market Development afarrell@anga. us
Natural Gas & Methane Emissions 16
Gas-Electric Coordination Source: ICF, Study on Long-term Electric and Natural Gas Infrastructure Requirements in the Eastern Interconnection, September 11, 2014
Gas-Electric Coordination Source: ICF, Study on Long-term Electric and Natural Gas Infrastructure Requirements in the Eastern Interconnection, September 11, 2014