Monitoring the Microsoft Cloud The Geneva Monitoring System


- Slides: 23

Monitoring the Microsoft Cloud The Geneva Monitoring System Gabe Wishnie (on behalf of the Geneva Monitoring Team)

Agenda § Brief intro to Geneva Monitoring System § Deep(er) dive into Geneva Metrics System (a. k. a. MDM) § Questions

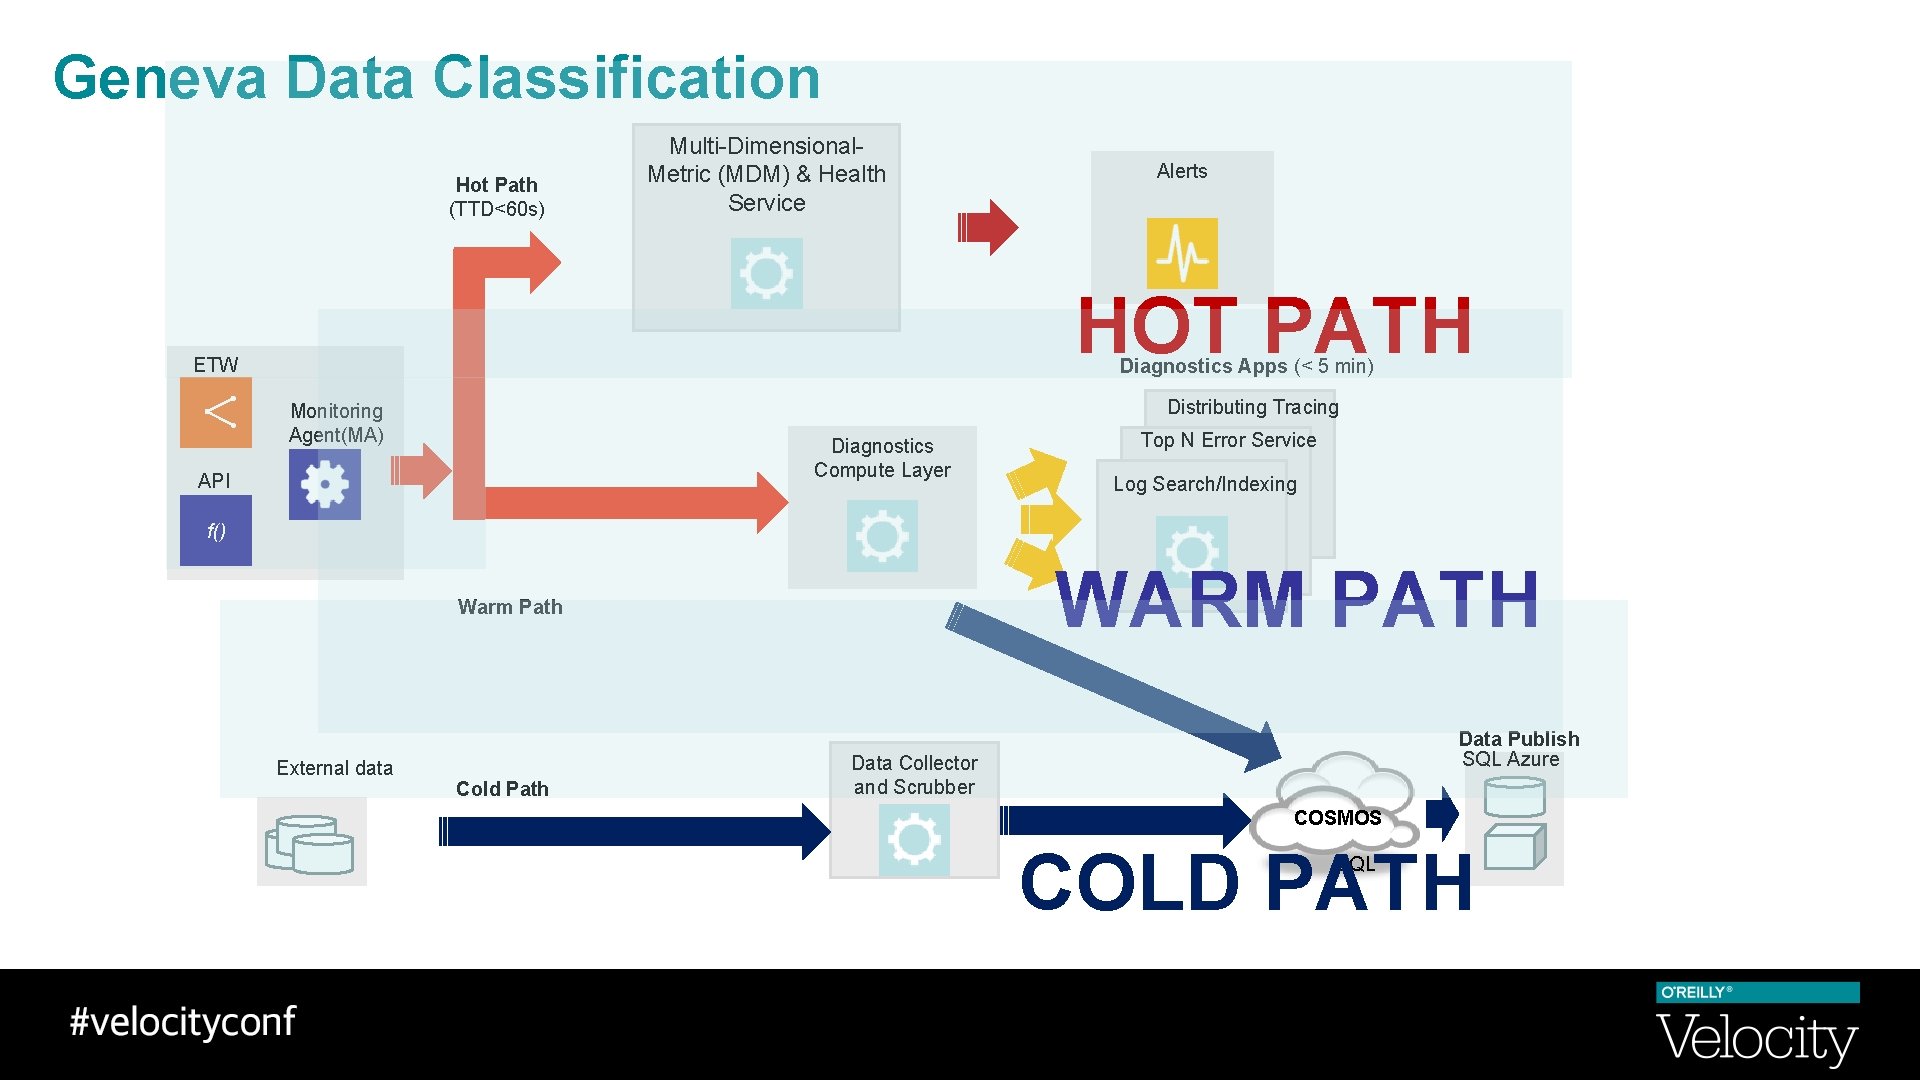
Geneva Data Classification Hot Path (TTD<60 s) Multi-Dimensional. Metric (MDM) & Health Service Alerts HOT PATH ETW Diagnostics Apps (< 5 min) Distributing Tracing Monitoring Agent(MA) Diagnostics Compute Layer API Top N Error Service Log Search/Indexing f() WARM PATH Warm Path External data Cold Path Data Publish SQL Azure Data Collector and Scrubber COSMOS COLD PATH SQL

Wait, But I Really Want. . . Hot Path, Warm Path, Cold Path

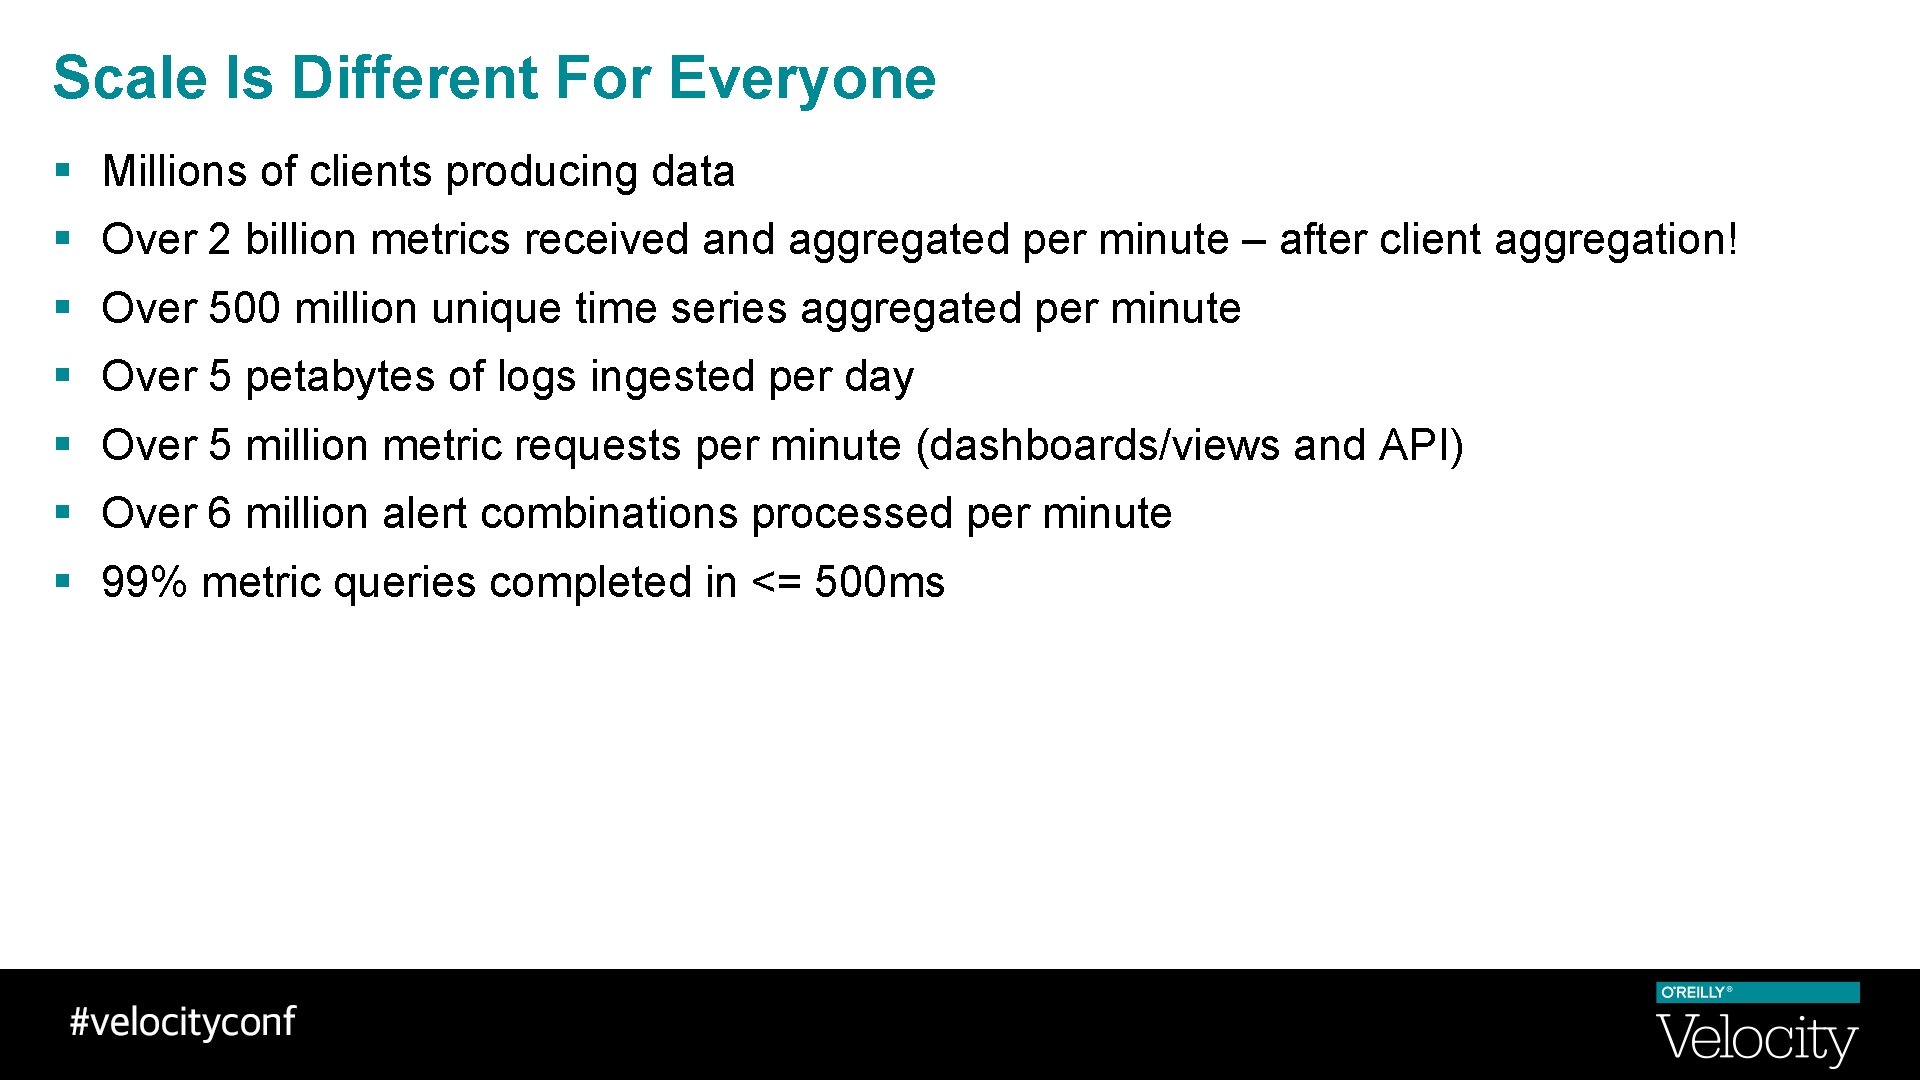
Scale Is Different For Everyone § Millions of clients producing data § Over 2 billion metrics received and aggregated per minute – after client aggregation! § Over 500 million unique time series aggregated per minute § Over 5 petabytes of logs ingested per day § Over 5 million metric requests per minute (dashboards/views and API) § Over 6 million alert combinations processed per minute § 99% metric queries completed in <= 500 ms

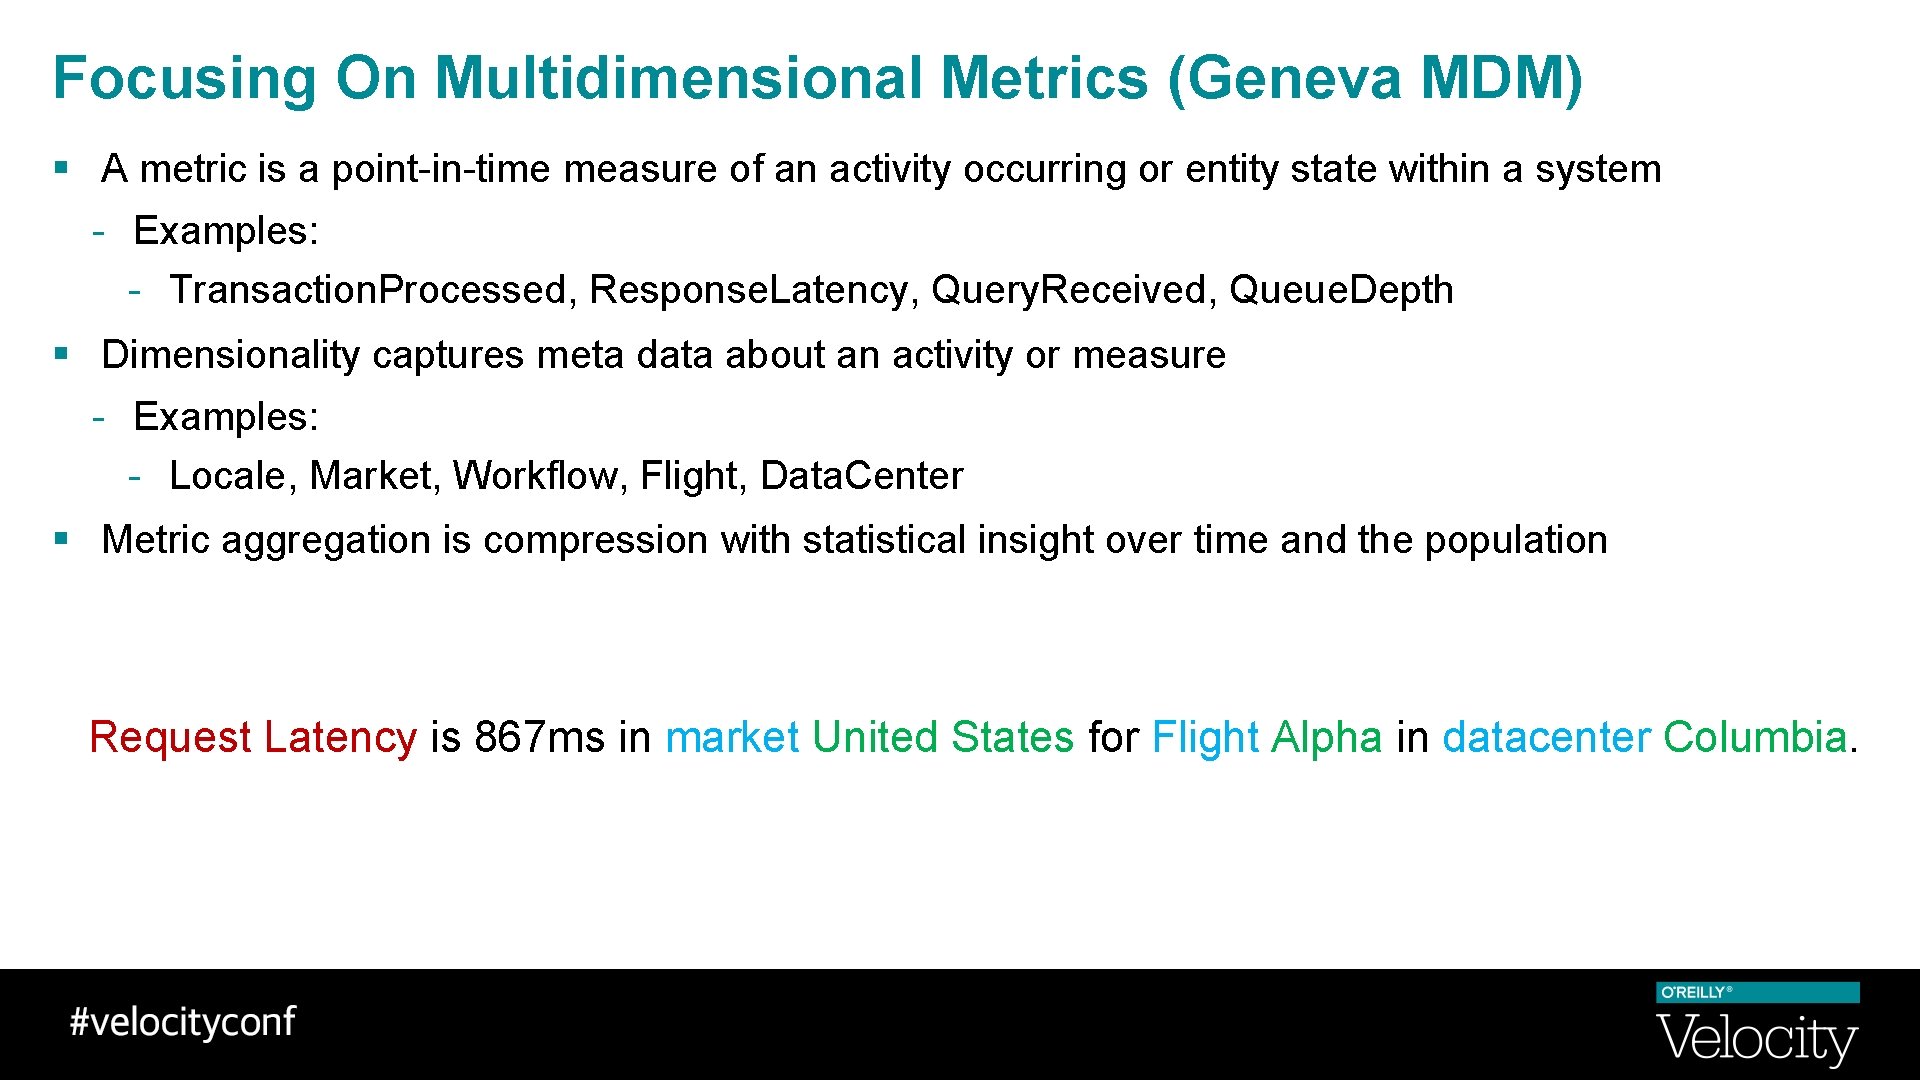
Focusing On Multidimensional Metrics (Geneva MDM) § A metric is a point-in-time measure of an activity occurring or entity state within a system - Examples: - Transaction. Processed, Response. Latency, Query. Received, Queue. Depth § Dimensionality captures meta data about an activity or measure - Examples: - Locale, Market, Workflow, Flight, Data. Center § Metric aggregation is compression with statistical insight over time and the population Request Latency is 867 ms in market United States for Flight Alpha in datacenter Columbia.

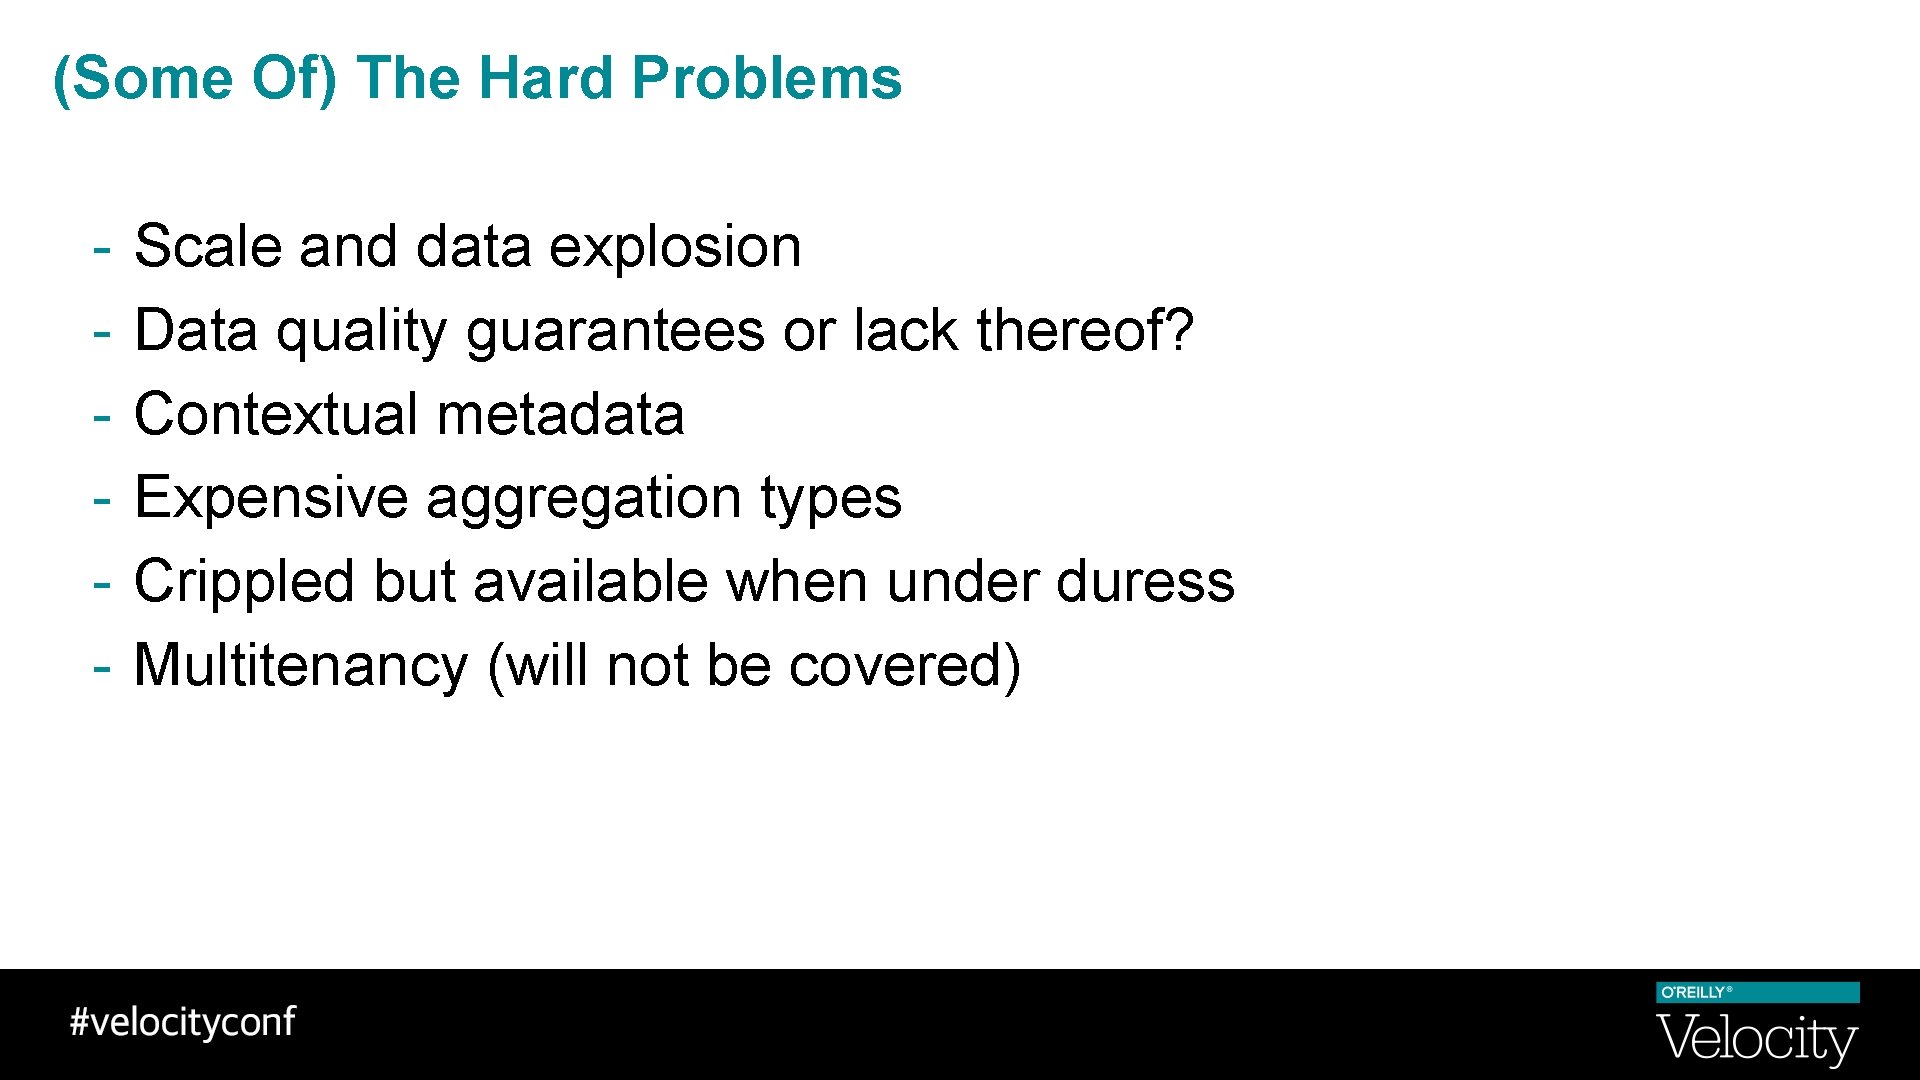
(Some Of) The Hard Problems - Scale and data explosion Data quality guarantees or lack thereof? Contextual metadata Expensive aggregation types Crippled but available when under duress Multitenancy (will not be covered)

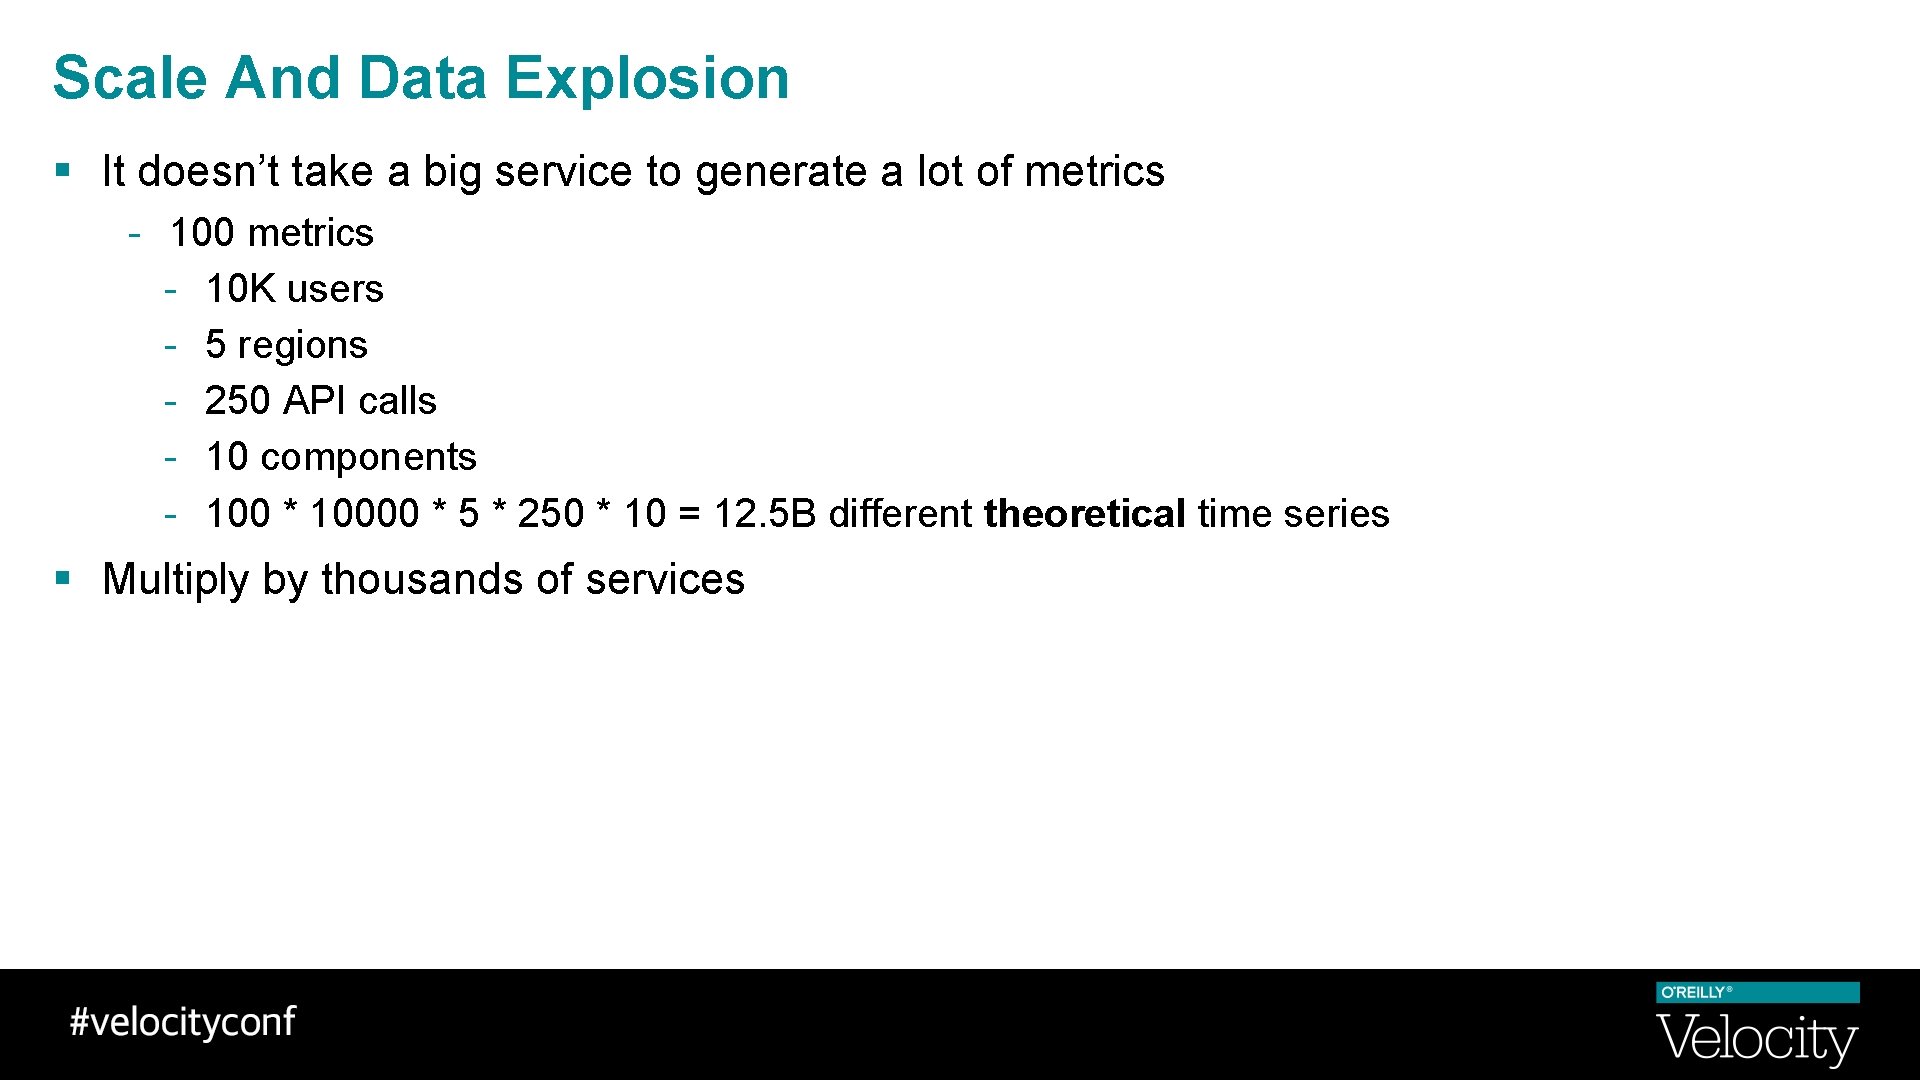
Scale And Data Explosion § It doesn’t take a big service to generate a lot of metrics - 100 metrics - 10 K users - 5 regions - 250 API calls - 10 components - 100 * 10000 * 5 * 250 * 10 = 12. 5 B different theoretical time series § Multiply by thousands of services

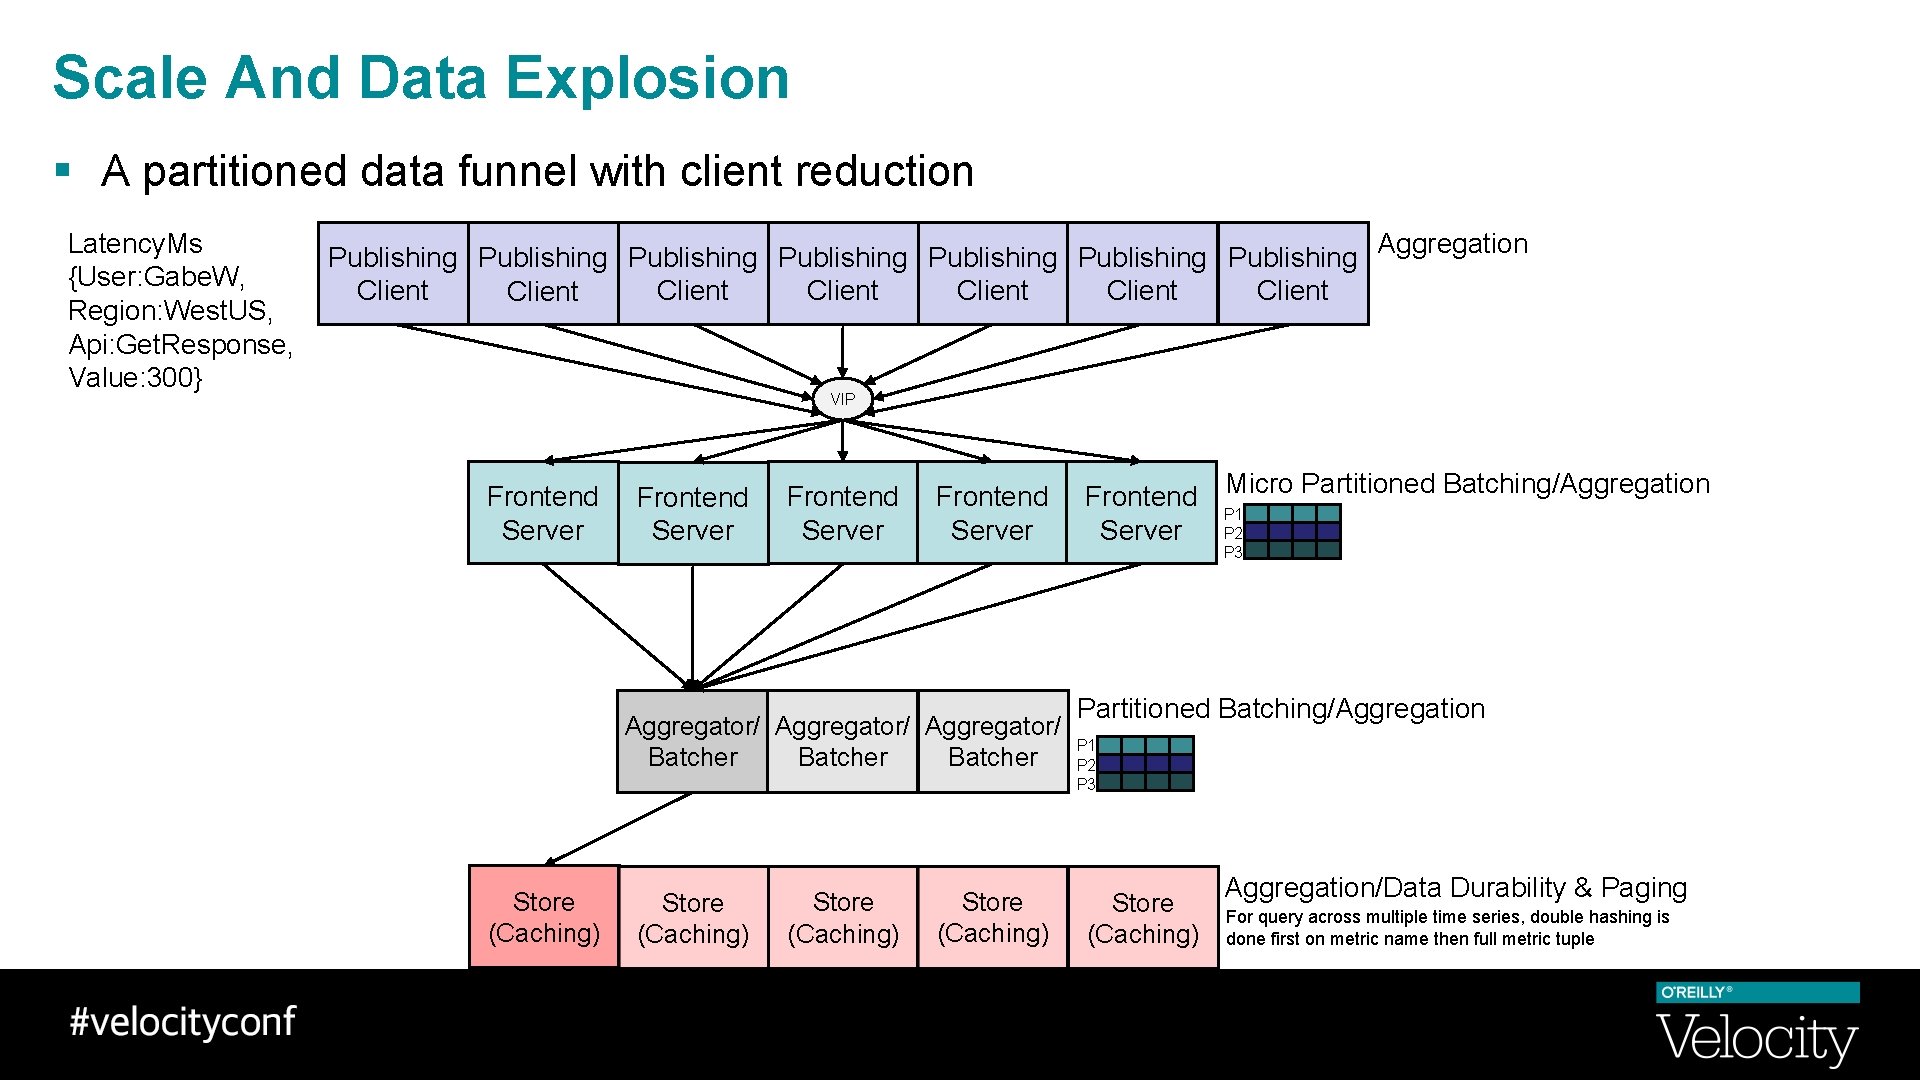
Scale And Data Explosion § A partitioned data funnel with client reduction Latency. Ms {User: Gabe. W, Region: West. US, Api: Get. Response, Value: 300} Publishing Publishing Aggregation Client Client VIP Frontend Server Aggregator/ Batcher Store (Caching) Micro Partitioned Batching/Aggregation Frontend P 1 Server P 2 P 3 Partitioned Batching/Aggregation P 1 P 2 P 3 Store (Caching) Aggregation/Data Durability & Paging For query across multiple time series, double hashing is done first on metric name then full metric tuple

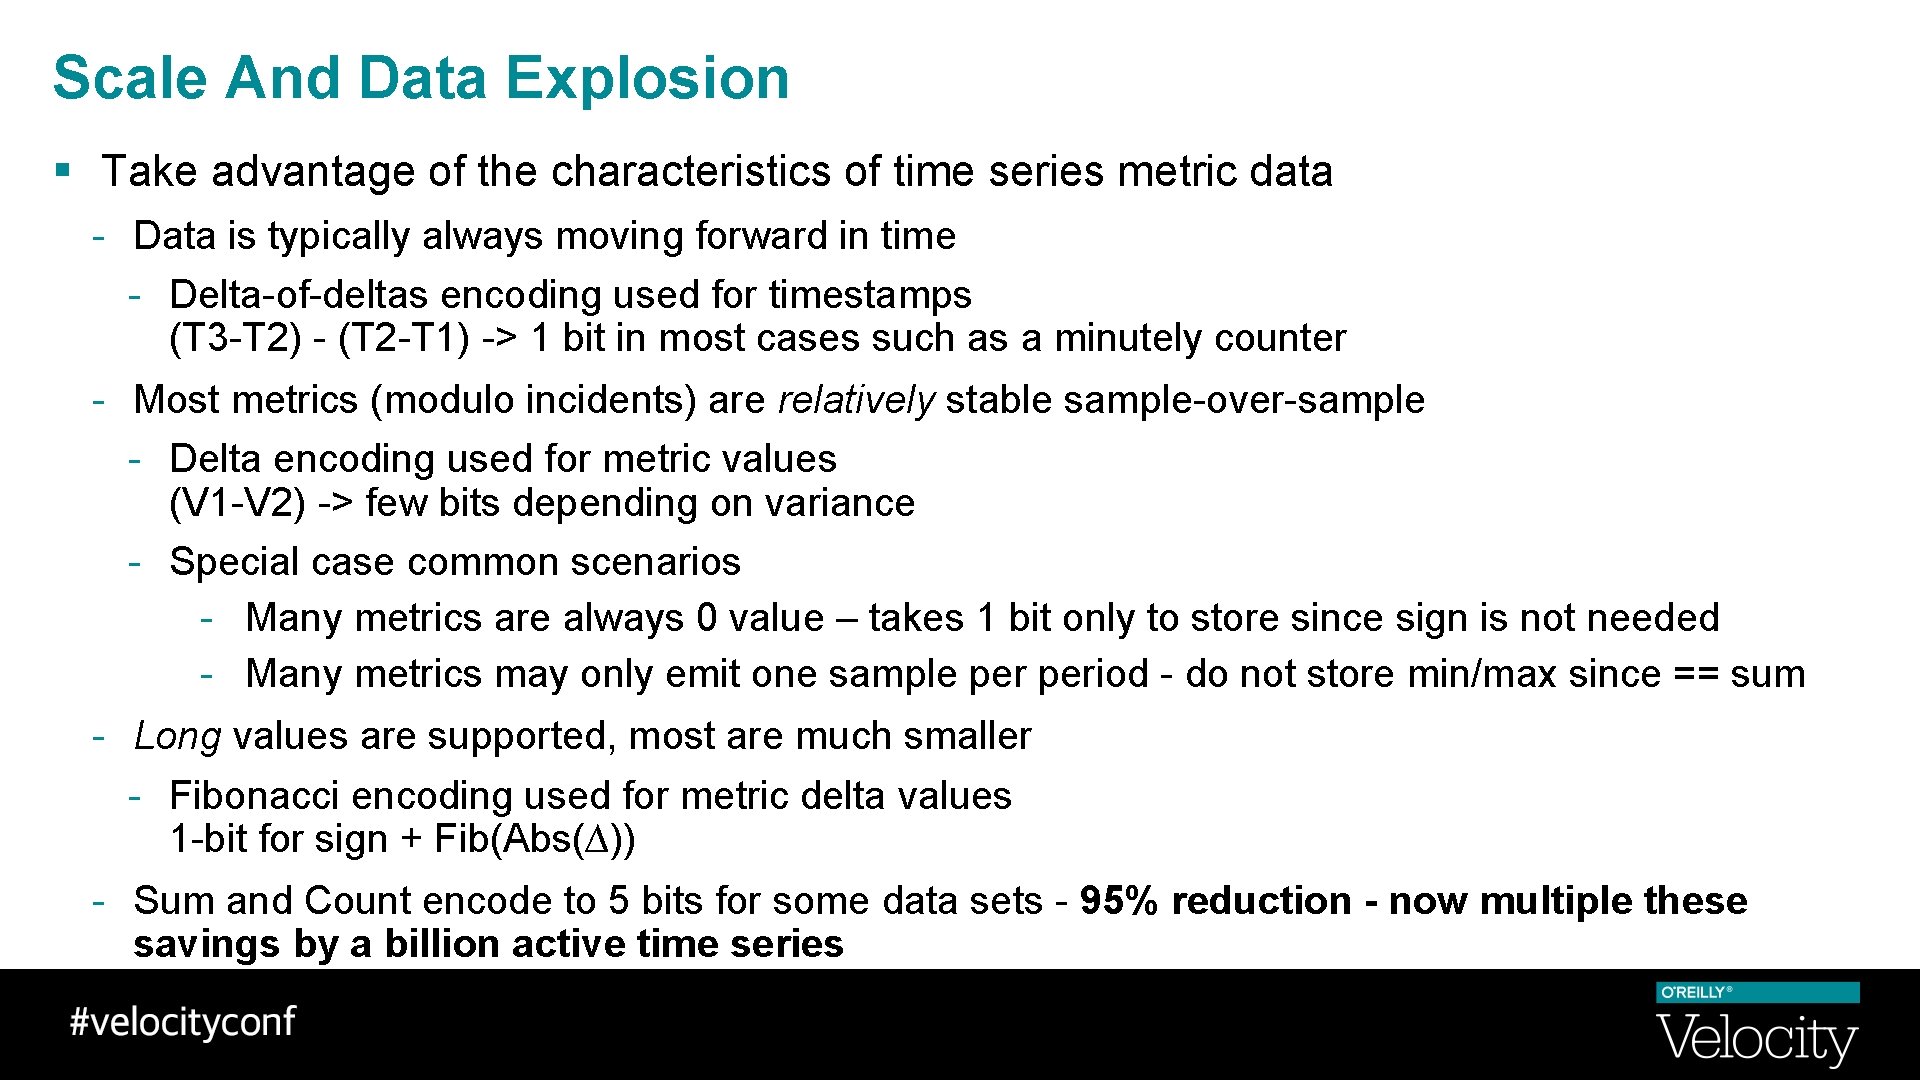
Scale And Data Explosion § Take advantage of the characteristics of time series metric data - Data is typically always moving forward in time - Delta-of-deltas encoding used for timestamps (T 3 -T 2) - (T 2 -T 1) -> 1 bit in most cases such as a minutely counter - Most metrics (modulo incidents) are relatively stable sample-over-sample - Delta encoding used for metric values (V 1 -V 2) -> few bits depending on variance - Special case common scenarios - Many metrics are always 0 value – takes 1 bit only to store since sign is not needed - Many metrics may only emit one sample period - do not store min/max since == sum - Long values are supported, most are much smaller - Fibonacci encoding used for metric delta values 1 -bit for sign + Fib(Abs(∆)) - Sum and Count encode to 5 bits for some data sets - 95% reduction - now multiple these savings by a billion active time series

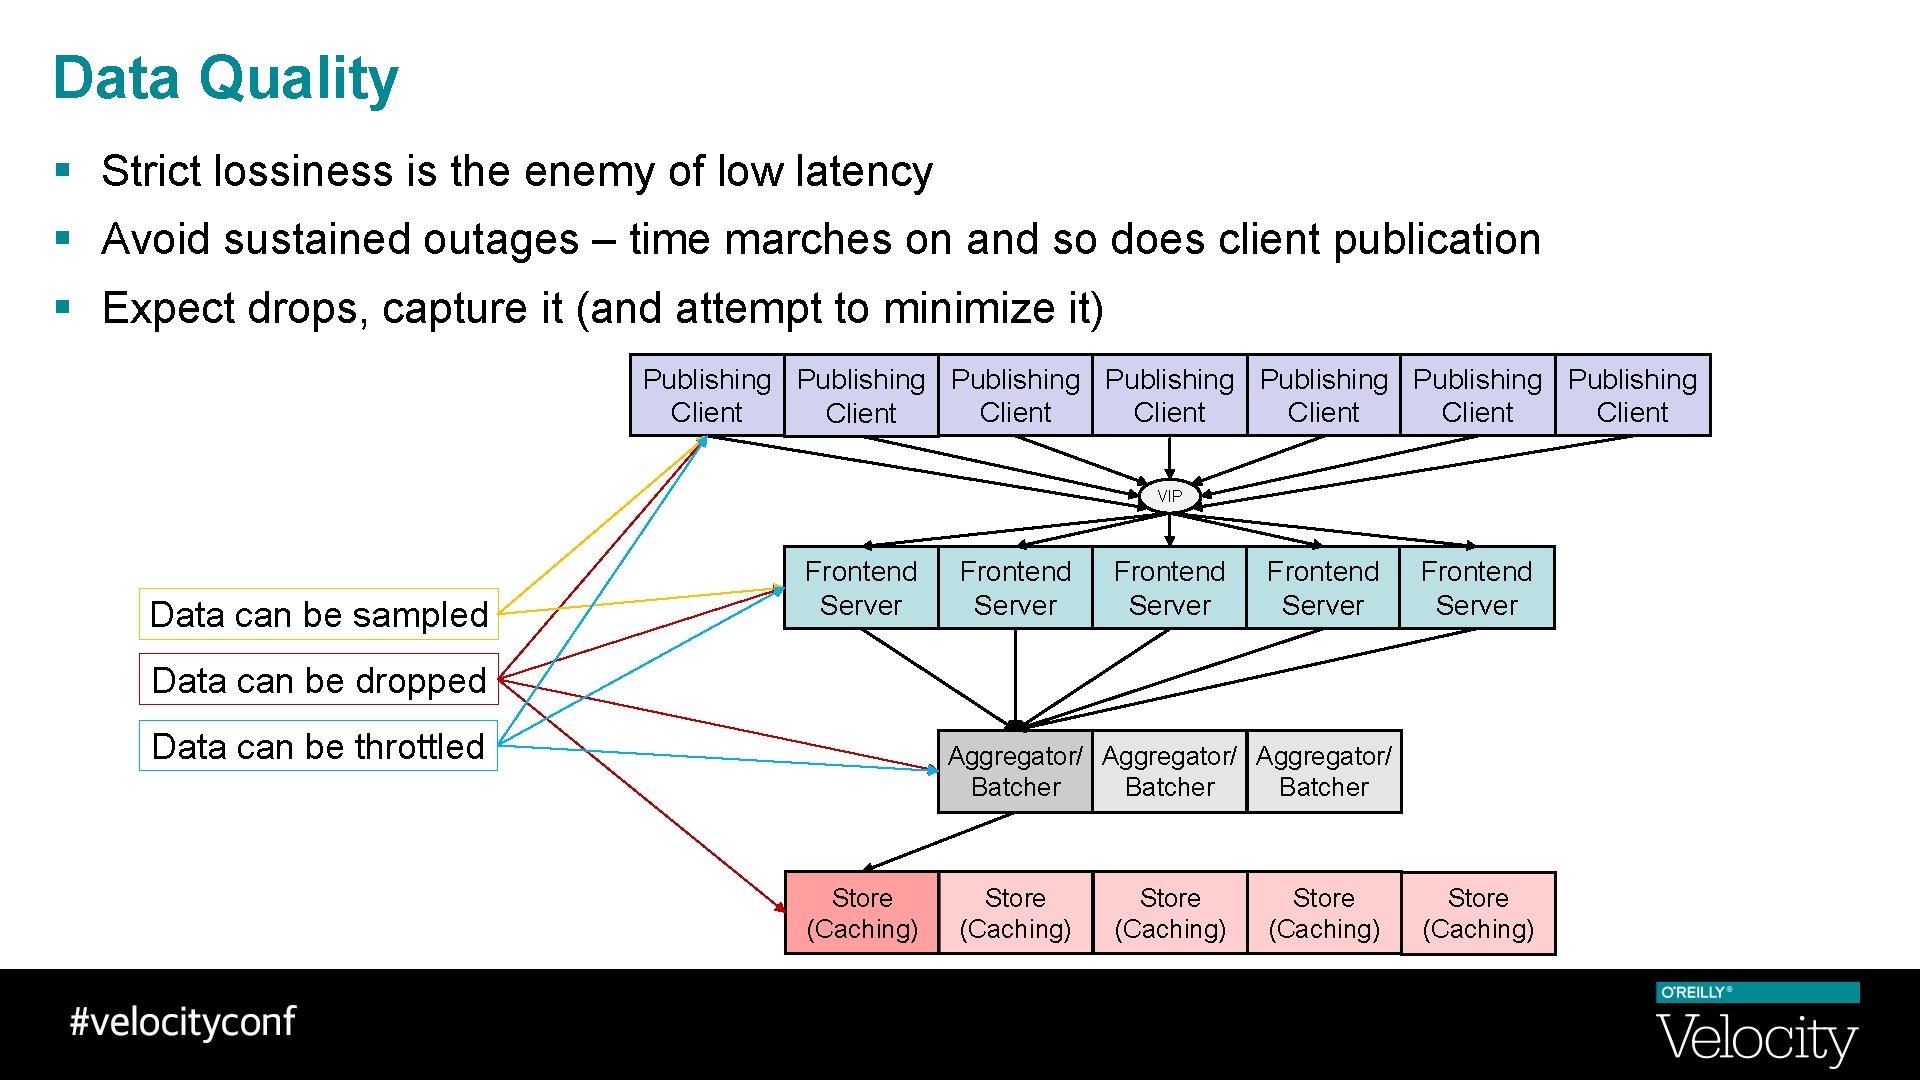
Data Quality § Strict lossiness is the enemy of low latency § Avoid sustained outages – time marches on and so does client publication § Expect drops, capture it (and attempt to minimize it) Publishing Publishing Client Client VIP Data can be sampled Frontend Server Frontend Server Data can be dropped Data can be throttled Aggregator/ Batcher Store (Caching) Store (Caching)

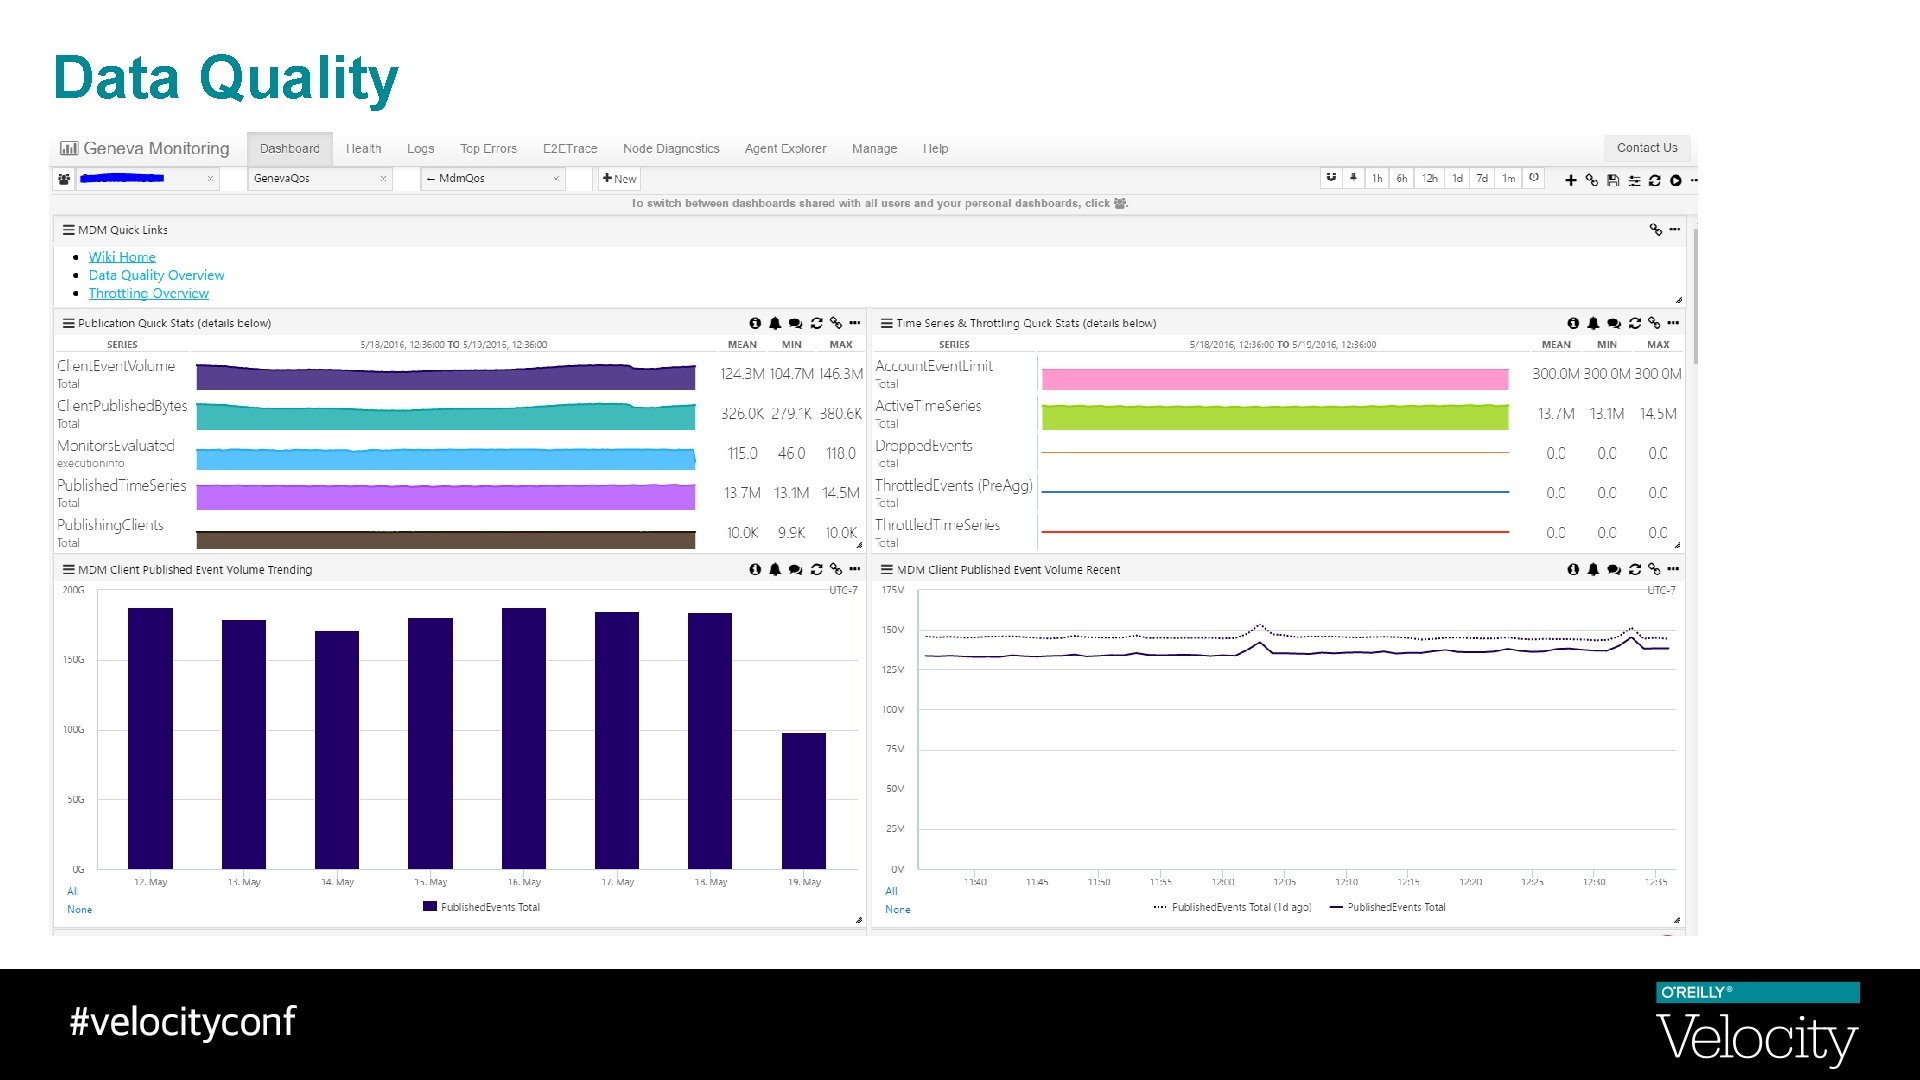
Data Quality

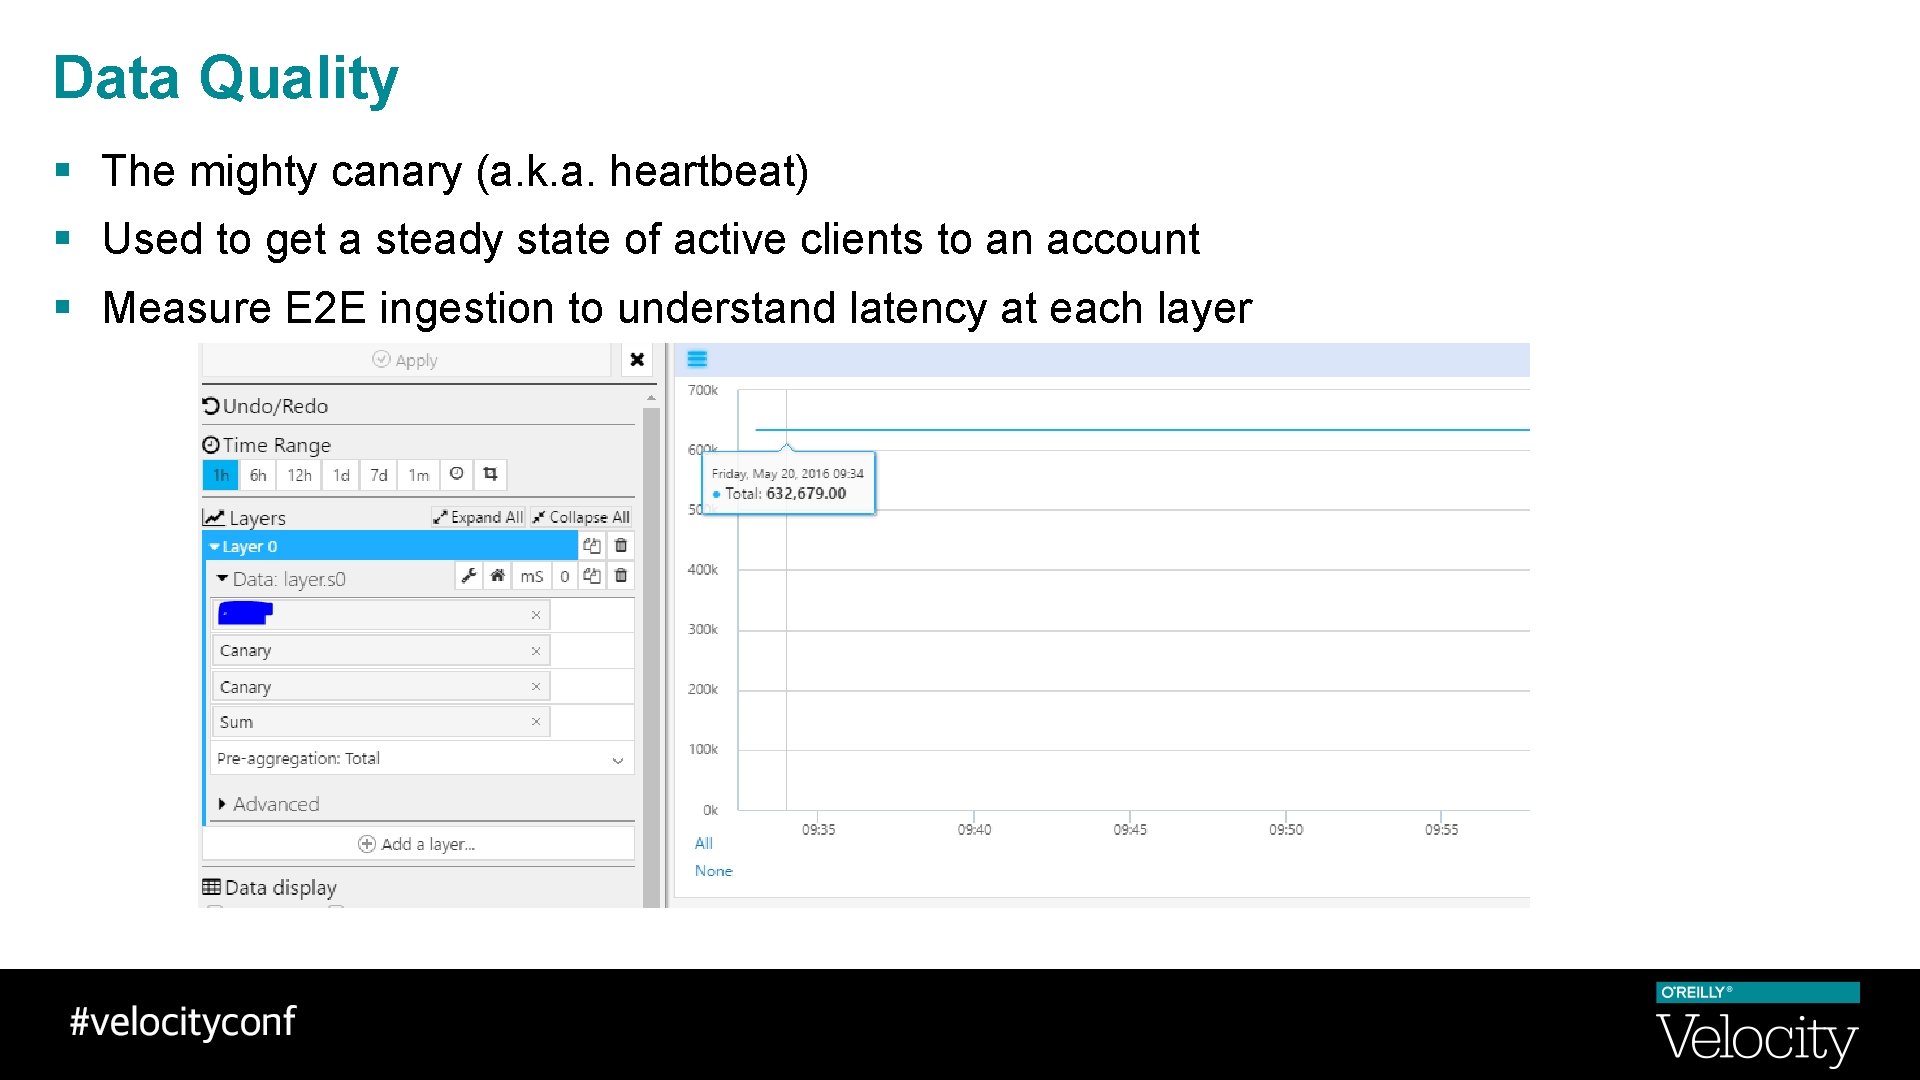
Data Quality § The mighty canary (a. k. a. heartbeat) § Used to get a steady state of active clients to an account § Measure E 2 E ingestion to understand latency at each layer

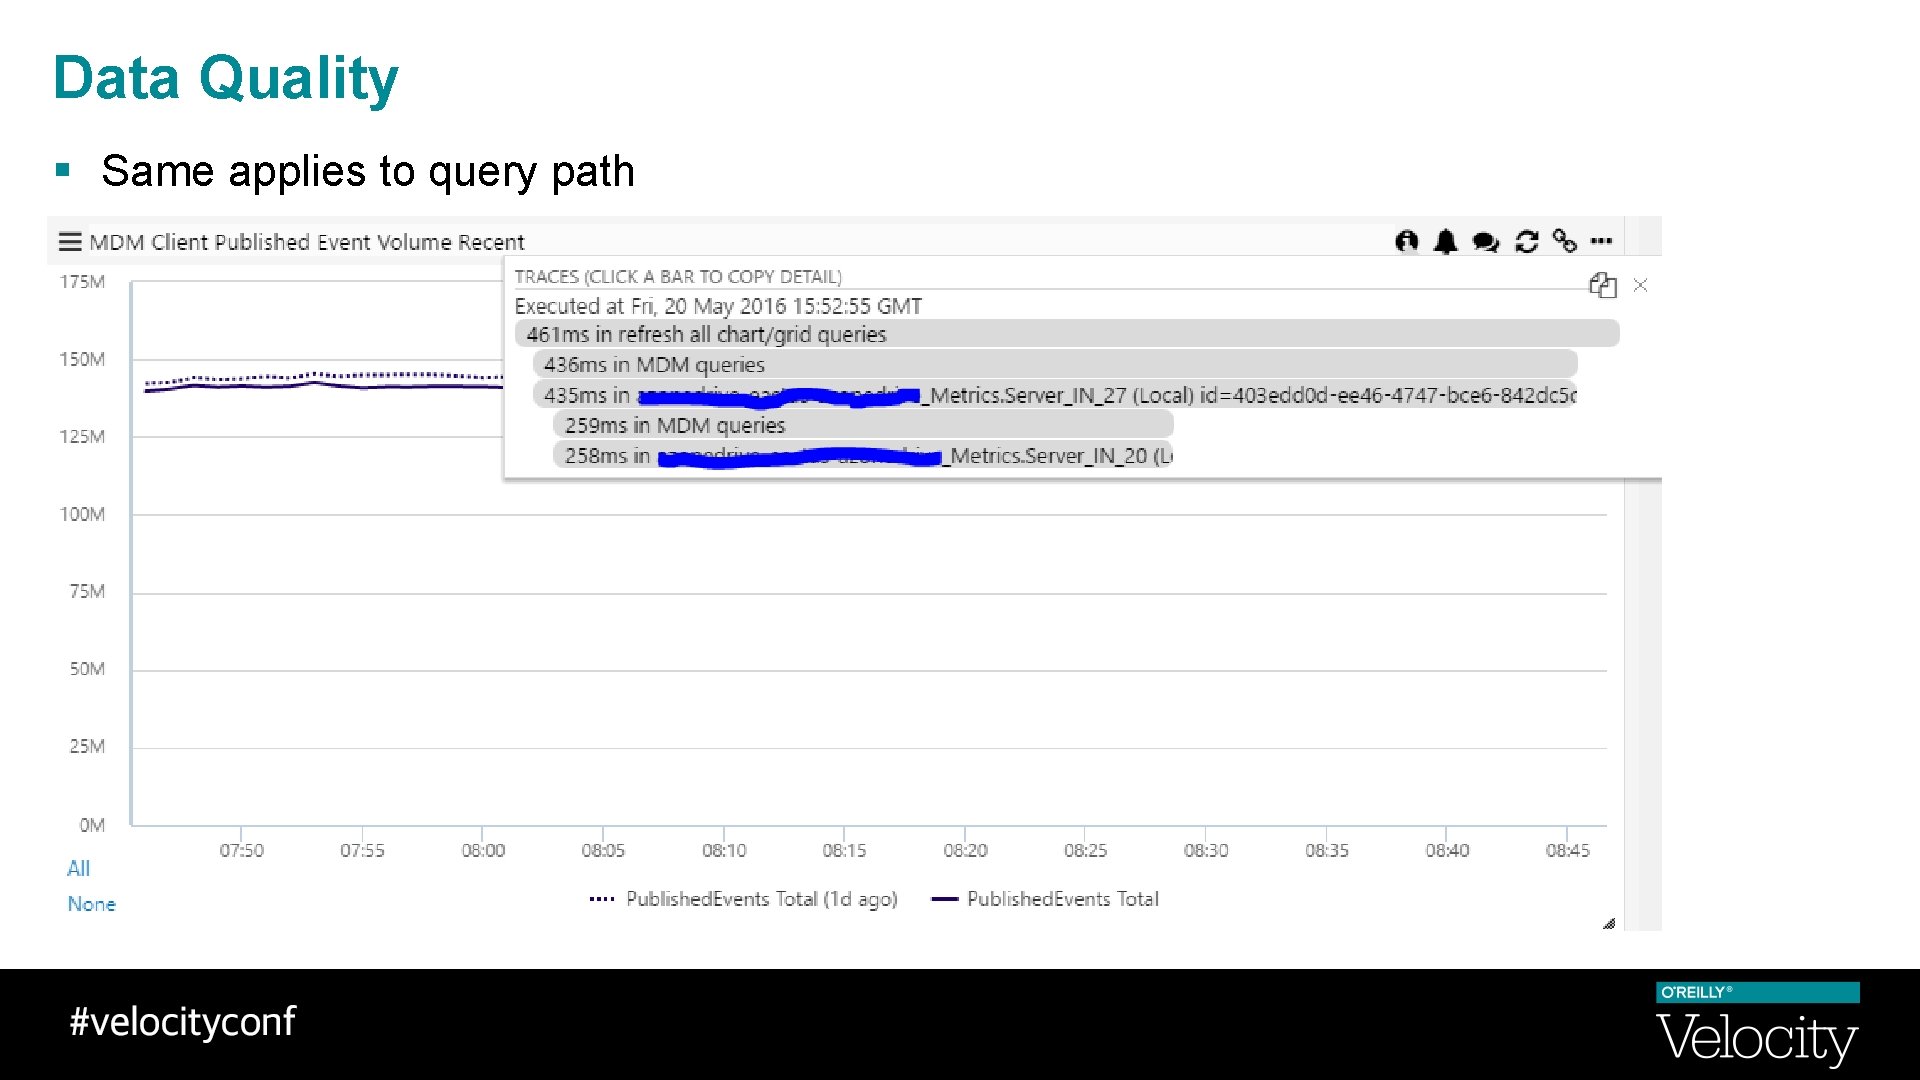
Data Quality § Same applies to query path

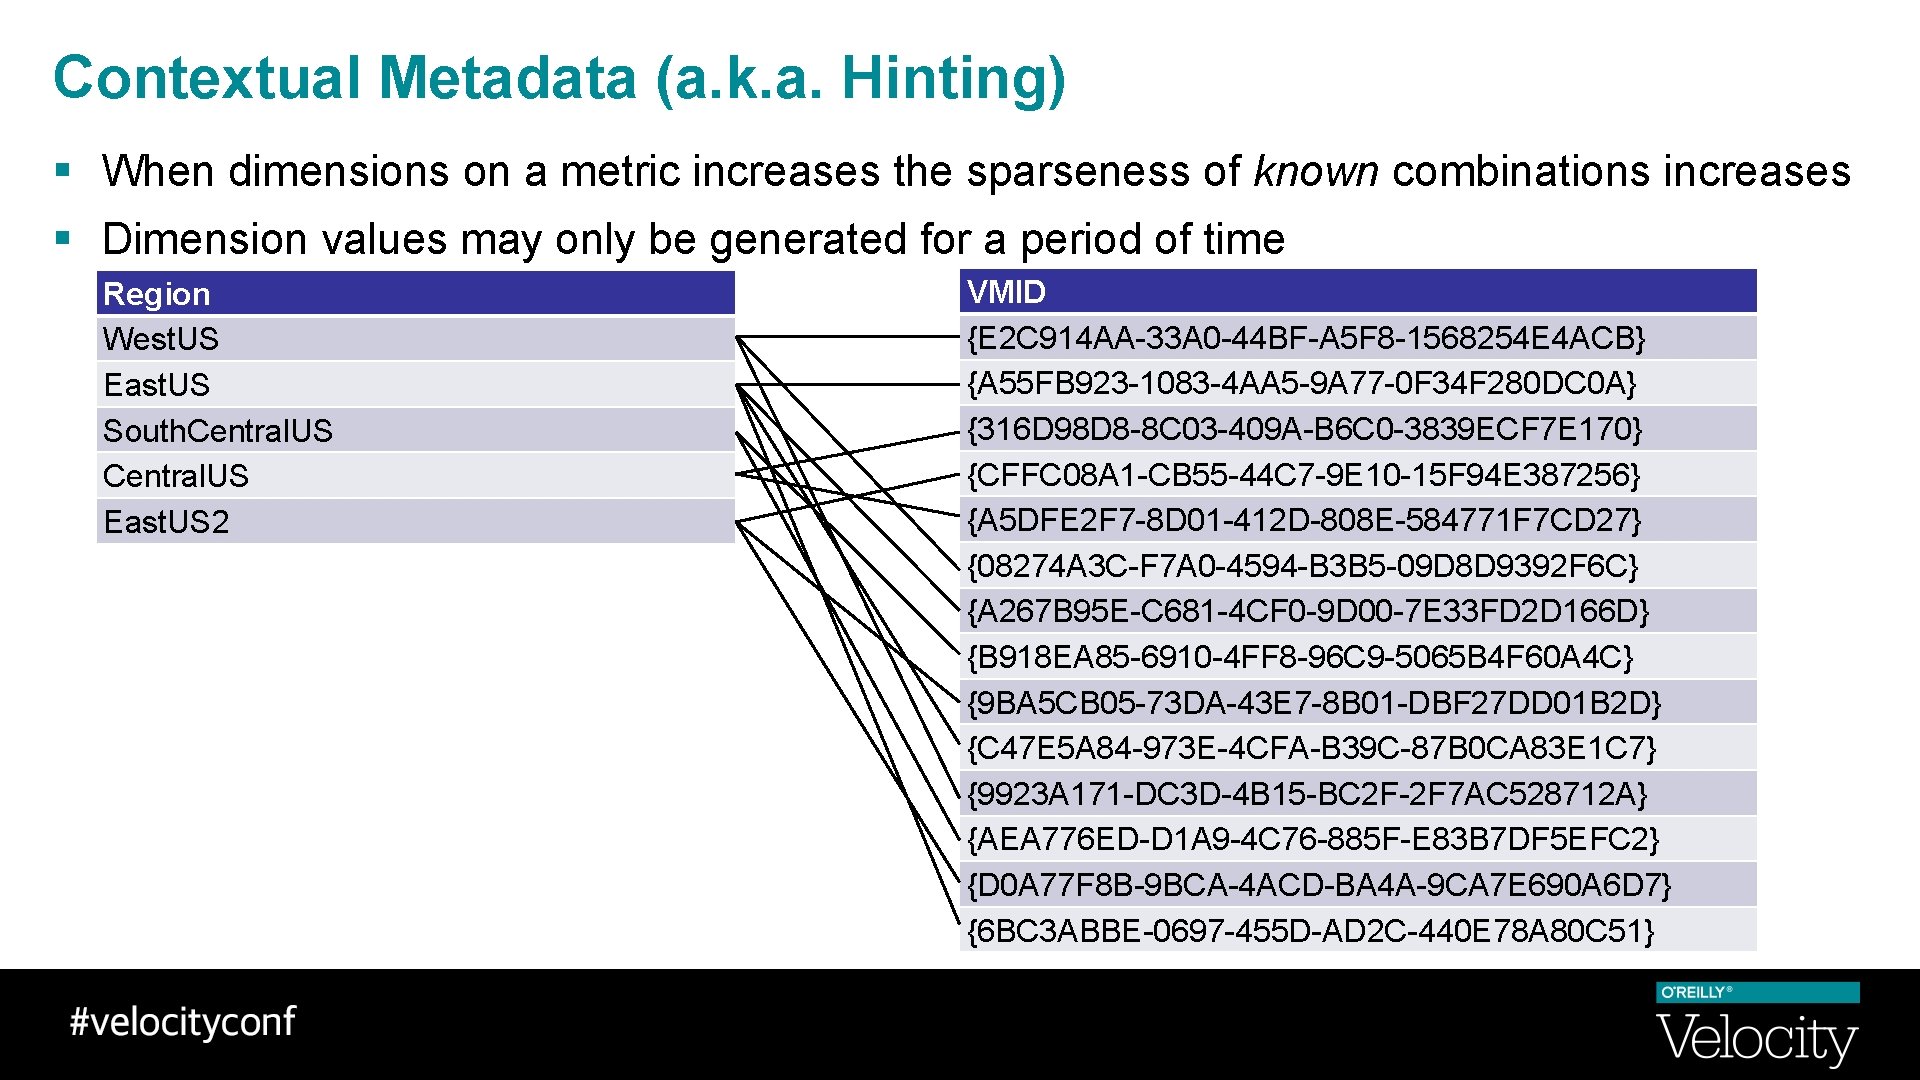
Contextual Metadata (a. k. a. Hinting) § When dimensions on a metric increases the sparseness of known combinations increases § Dimension values may only be generated for a period of time Region West. US East. US South. Central. US East. US 2 VMID {E 2 C 914 AA-33 A 0 -44 BF-A 5 F 8 -1568254 E 4 ACB} {A 55 FB 923 -1083 -4 AA 5 -9 A 77 -0 F 34 F 280 DC 0 A} {316 D 98 D 8 -8 C 03 -409 A-B 6 C 0 -3839 ECF 7 E 170} {CFFC 08 A 1 -CB 55 -44 C 7 -9 E 10 -15 F 94 E 387256} {A 5 DFE 2 F 7 -8 D 01 -412 D-808 E-584771 F 7 CD 27} {08274 A 3 C-F 7 A 0 -4594 -B 3 B 5 -09 D 8 D 9392 F 6 C} {A 267 B 95 E-C 681 -4 CF 0 -9 D 00 -7 E 33 FD 2 D 166 D} {B 918 EA 85 -6910 -4 FF 8 -96 C 9 -5065 B 4 F 60 A 4 C} {9 BA 5 CB 05 -73 DA-43 E 7 -8 B 01 -DBF 27 DD 01 B 2 D} {C 47 E 5 A 84 -973 E-4 CFA-B 39 C-87 B 0 CA 83 E 1 C 7} {9923 A 171 -DC 3 D-4 B 15 -BC 2 F-2 F 7 AC 528712 A} {AEA 776 ED-D 1 A 9 -4 C 76 -885 F-E 83 B 7 DF 5 EFC 2} {D 0 A 77 F 8 B-9 BCA-4 ACD-BA 4 A-9 CA 7 E 690 A 6 D 7} {6 BC 3 ABBE-0697 -455 D-AD 2 C-440 E 78 A 80 C 51}

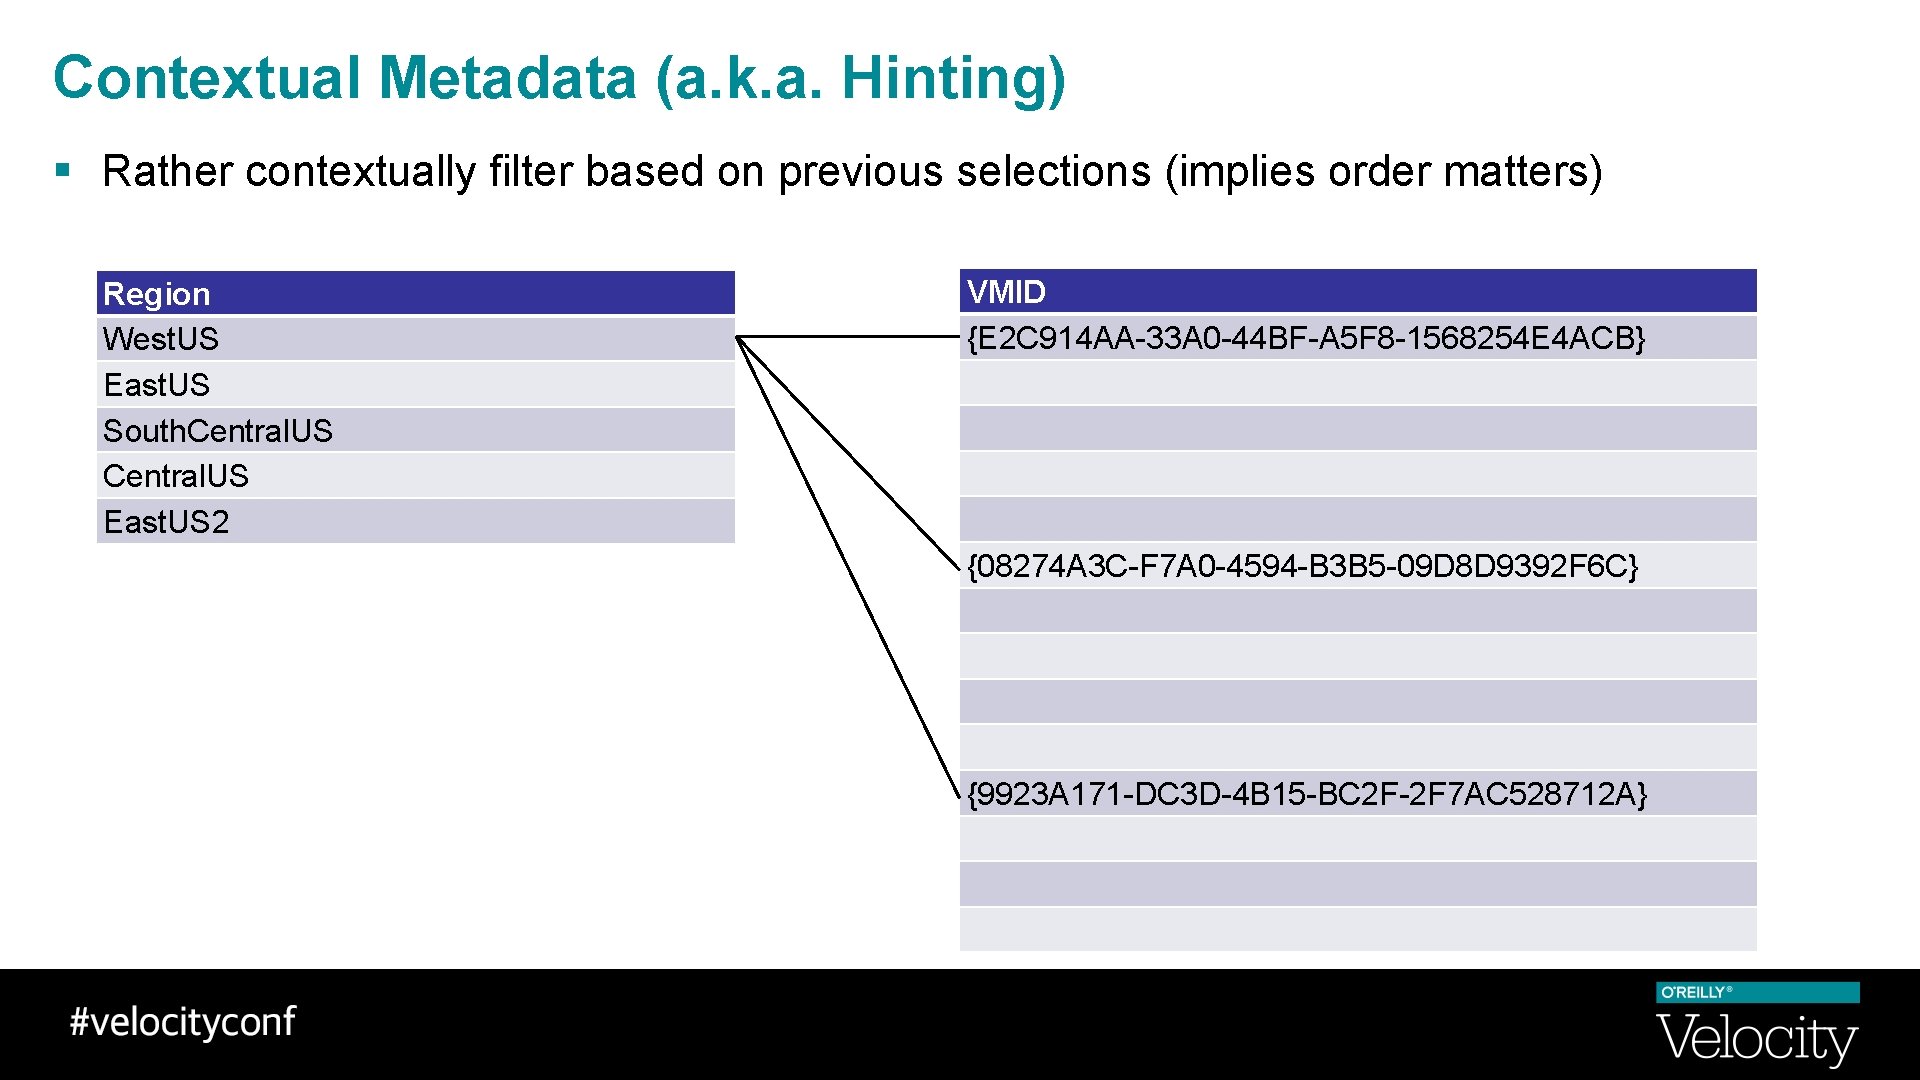
Contextual Metadata (a. k. a. Hinting) § Rather contextually filter based on previous selections (implies order matters) Region West. US East. US South. Central. US East. US 2 VMID {E 2 C 914 AA-33 A 0 -44 BF-A 5 F 8 -1568254 E 4 ACB} {08274 A 3 C-F 7 A 0 -4594 -B 3 B 5 -09 D 8 D 9392 F 6 C} {9923 A 171 -DC 3 D-4 B 15 -BC 2 F-2 F 7 AC 528712 A}

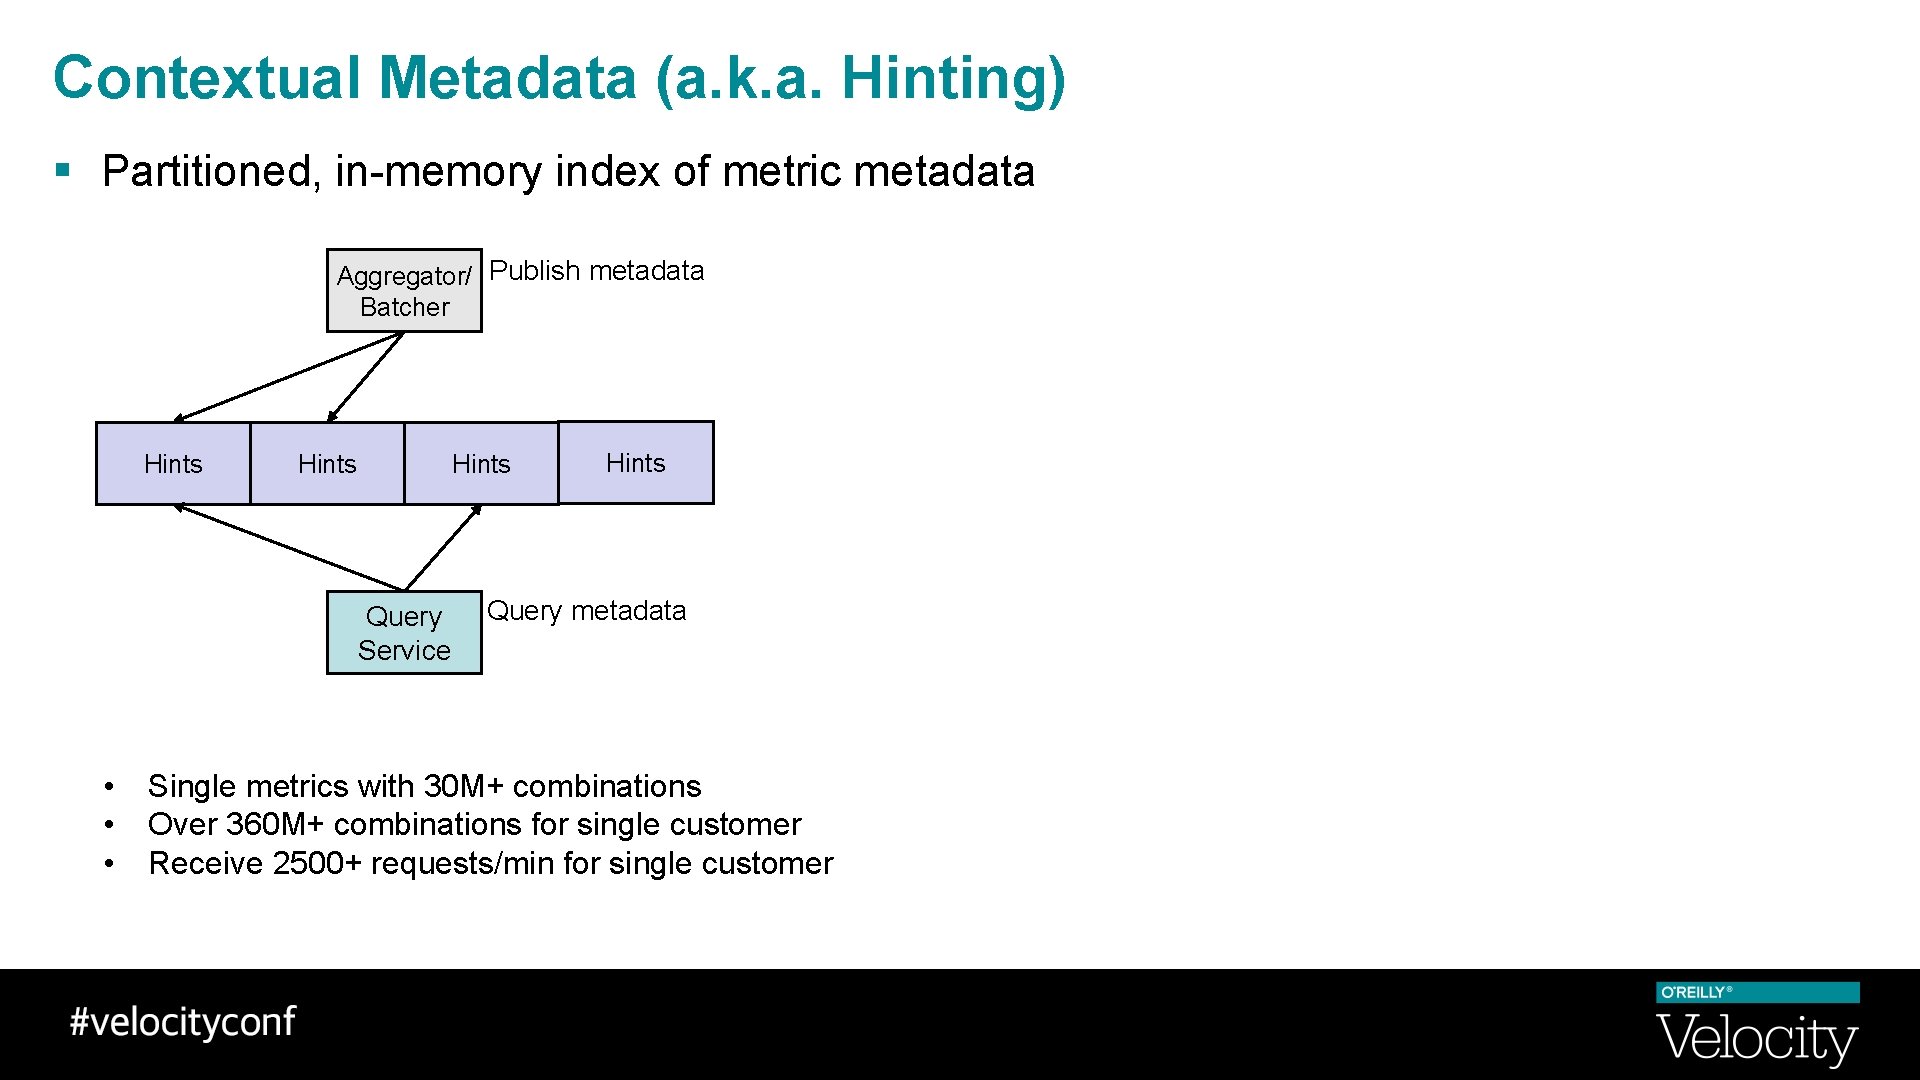
Contextual Metadata (a. k. a. Hinting) § Partitioned, in-memory index of metric metadata Aggregator/ Publish metadata Batcher Hints Query Service • • • Hints Query metadata Single metrics with 30 M+ combinations Over 360 M+ combinations for single customer Receive 2500+ requests/min for single customer

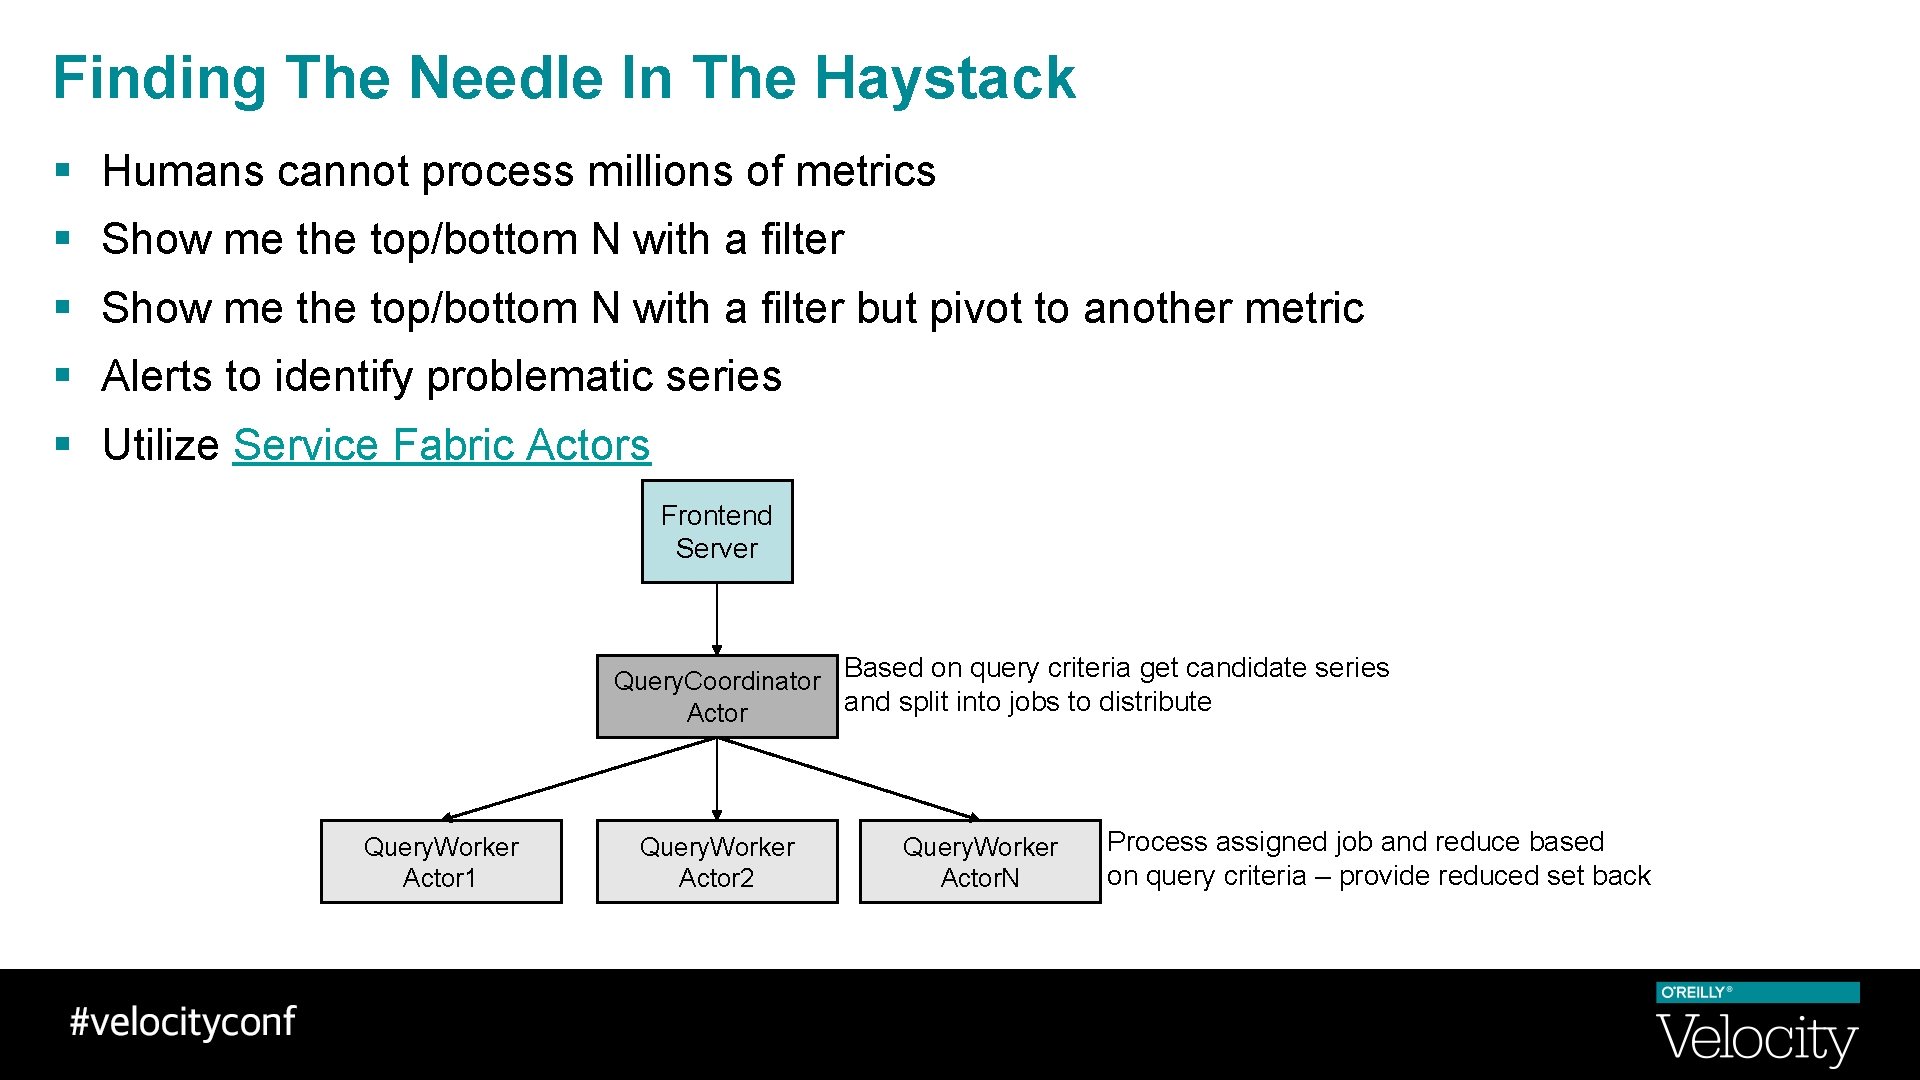
Finding The Needle In The Haystack § Humans cannot process millions of metrics § Show me the top/bottom N with a filter but pivot to another metric § Alerts to identify problematic series § Utilize Service Fabric Actors Frontend Server Query. Coordinator Based on query criteria get candidate series and split into jobs to distribute Actor Query. Worker Actor 1 Query. Worker Actor 2 Query. Worker Actor. N Process assigned job and reduce based on query criteria – provide reduced set back

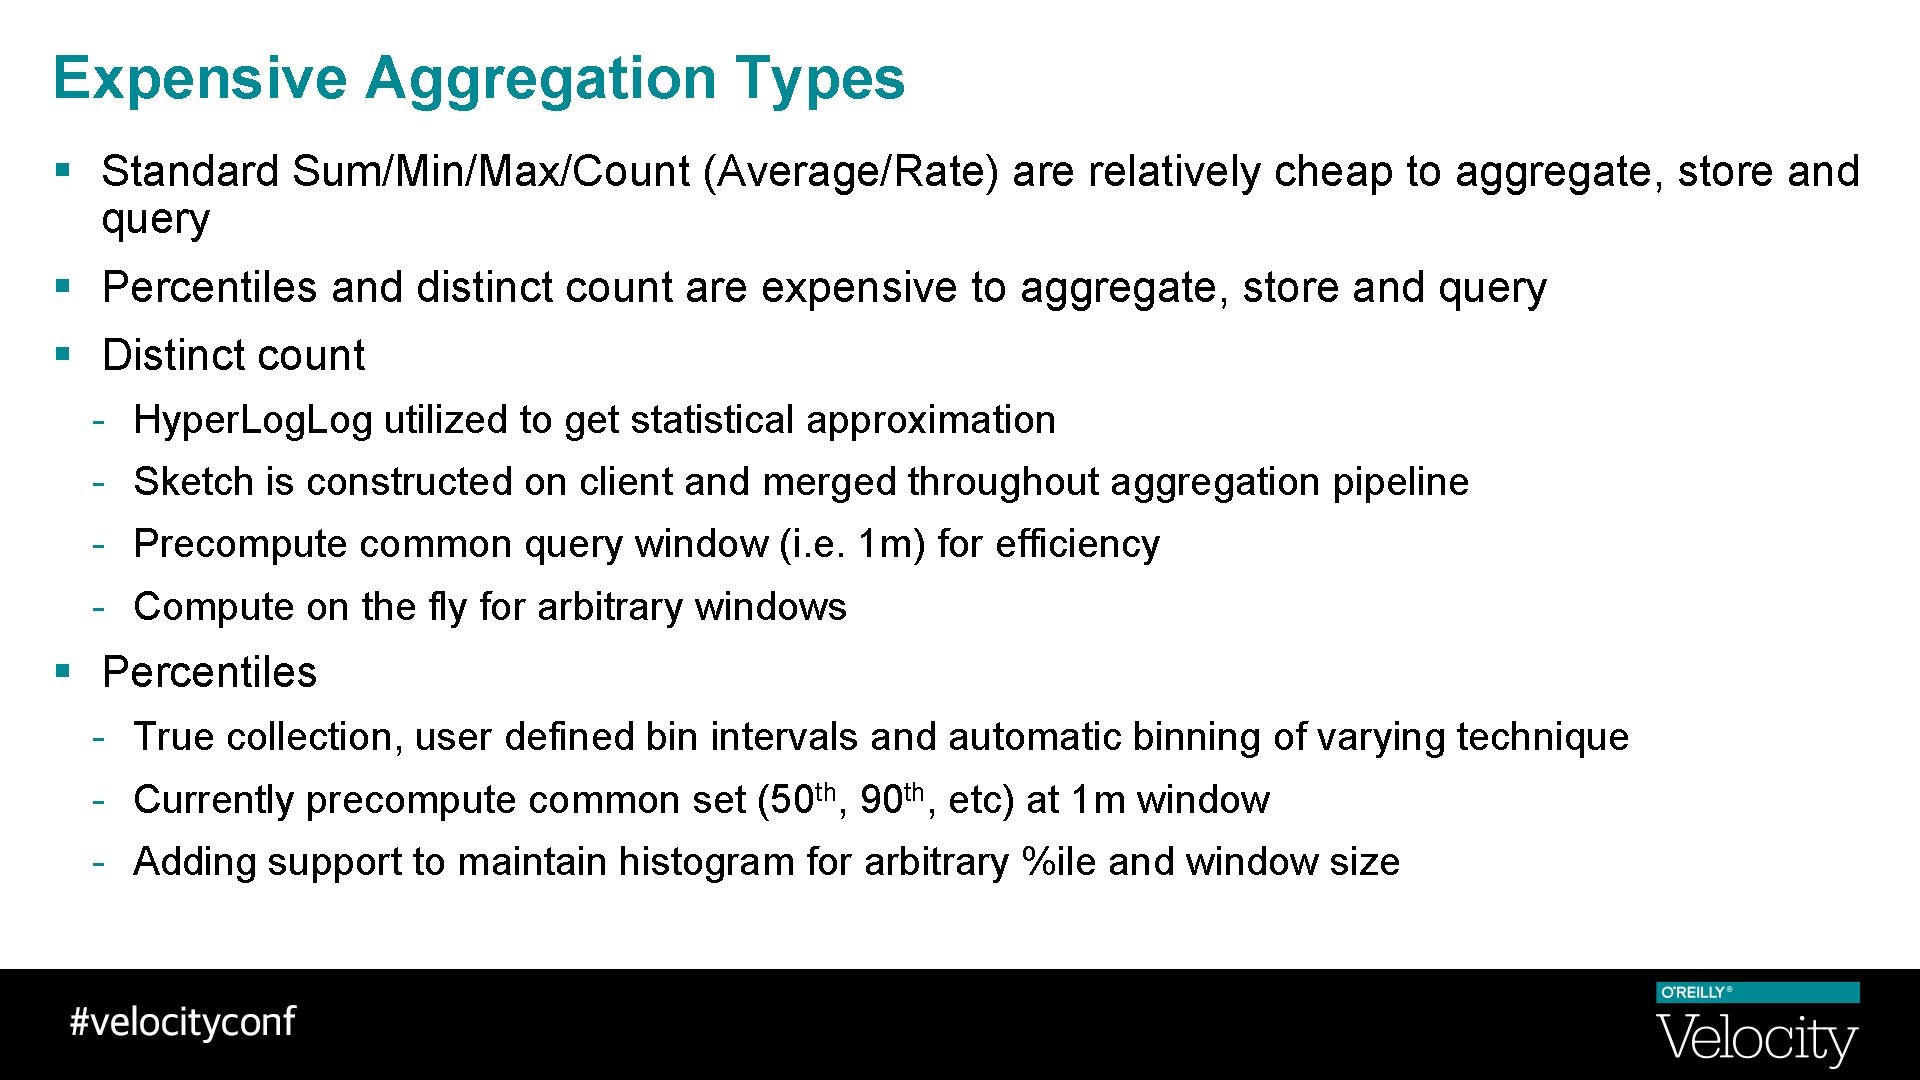
Expensive Aggregation Types § Standard Sum/Min/Max/Count (Average/Rate) are relatively cheap to aggregate, store and query § Percentiles and distinct count are expensive to aggregate, store and query § Distinct count - Hyper. Log utilized to get statistical approximation - Sketch is constructed on client and merged throughout aggregation pipeline - Precompute common query window (i. e. 1 m) for efficiency - Compute on the fly for arbitrary windows § Percentiles - True collection, user defined bin intervals and automatic binning of varying technique - Currently precompute common set (50 th, 90 th, etc) at 1 m window - Adding support to maintain histogram for arbitrary %ile and window size

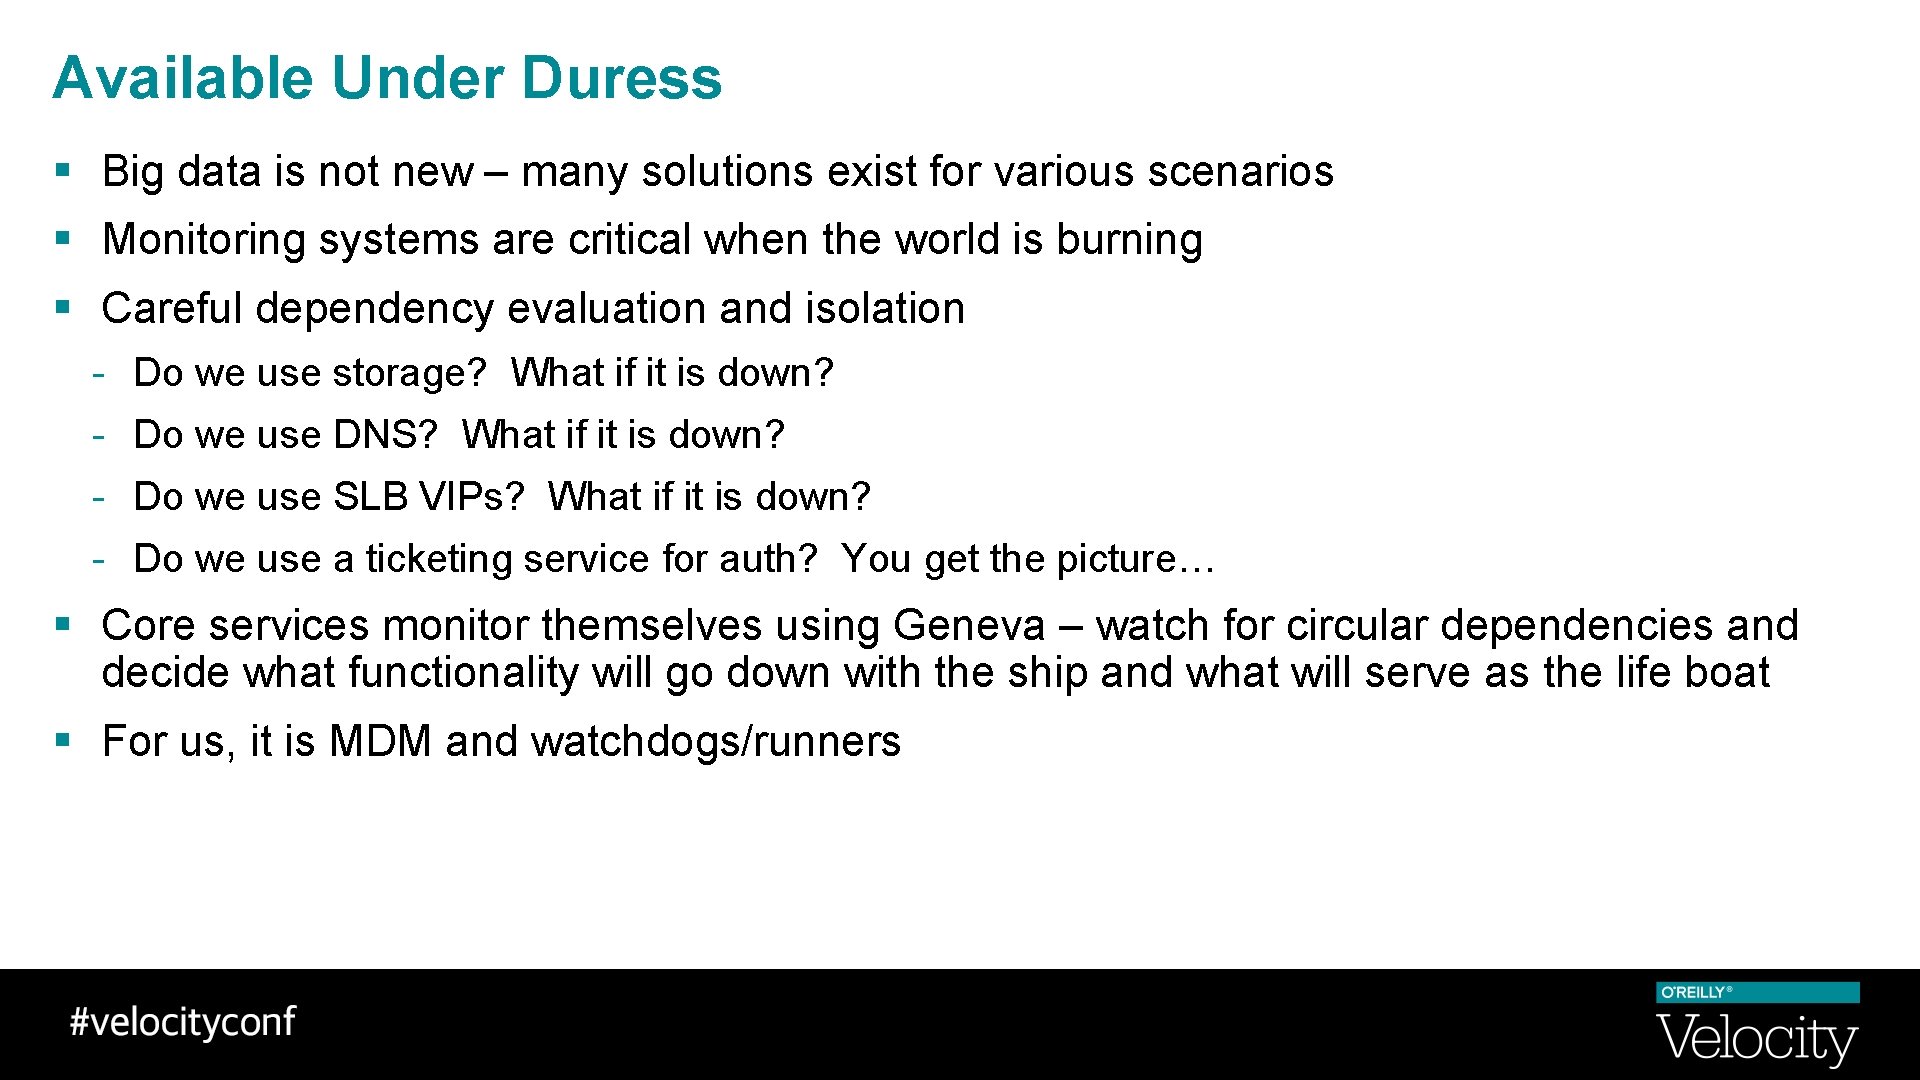
Available Under Duress § Big data is not new – many solutions exist for various scenarios § Monitoring systems are critical when the world is burning § Careful dependency evaluation and isolation - Do we use storage? What if it is down? - Do we use DNS? What if it is down? - Do we use SLB VIPs? What if it is down? - Do we use a ticketing service for auth? You get the picture… § Core services monitor themselves using Geneva – watch for circular dependencies and decide what functionality will go down with the ship and what will serve as the life boat § For us, it is MDM and watchdogs/runners

Where Might You Find MDM? § Initially targeted as internal monitoring solution and beginning to expand to our customers § Investing in serving as backend for Azure Insights metric pipeline § Application Insights utilizing for metric pipeline

We’re Hiring § Passionate about low latency big data problems? § Enjoy working on large distributed systems? § Want to enable monitoring of some of the largest services in the world? § Let’s talk!

Questions?