Modelling changes in HIV prevalence among women attending


 = birth")


 HIV+ 0. 44 (0. 02 -1. 05) HIV- 0. 55 (0. 14–")


- Slides: 28
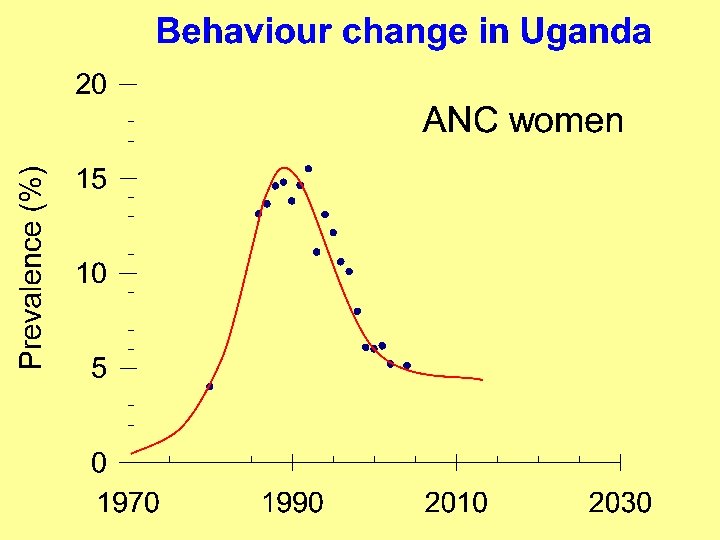
Modelling changes in HIV prevalence among women attending antenatal clinics in Uganda Brian Williams
N S SI/N m. S I I m. I = birth rate N =S+I = rate at which new infections occur = mortality The basic model
R 0 = 3. 3
N S SI/N m. S I I I Normal (Weibull 2) = birth rate N =S+I = infection rate I = Weibull mortality Exponential (Weibull 1)
~ N S SI/N m. S = birth rate ~ N = population = e – P I = Weibull mort. I I m. I – P e Heterogeneity in sexual behaviour
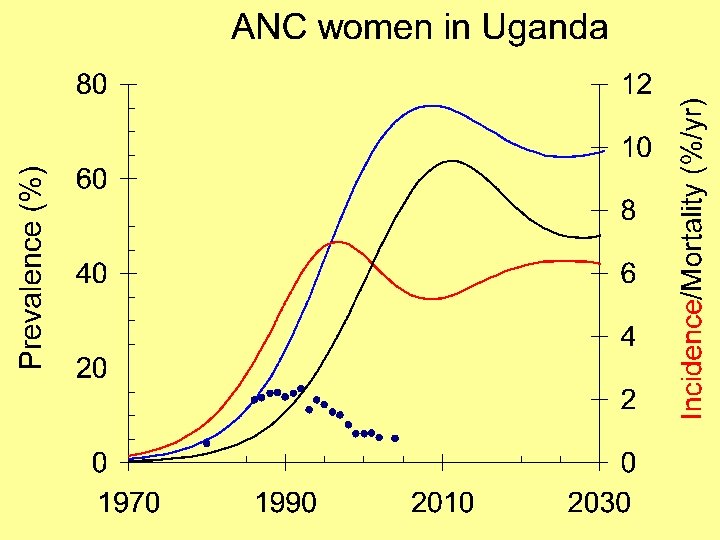
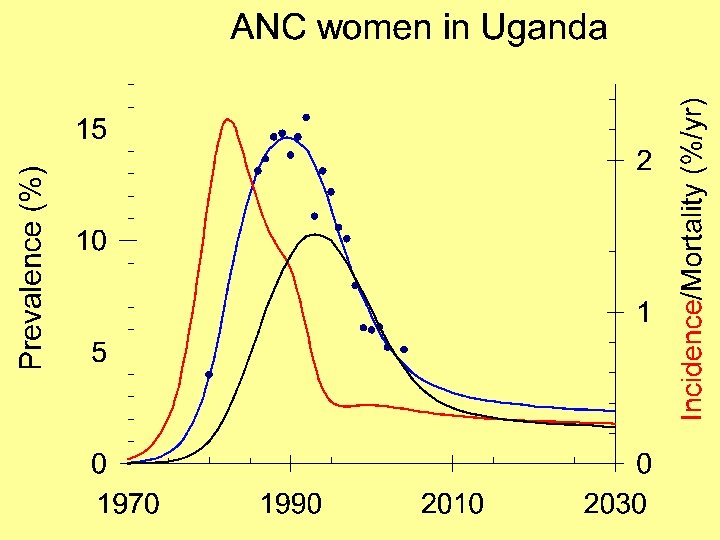
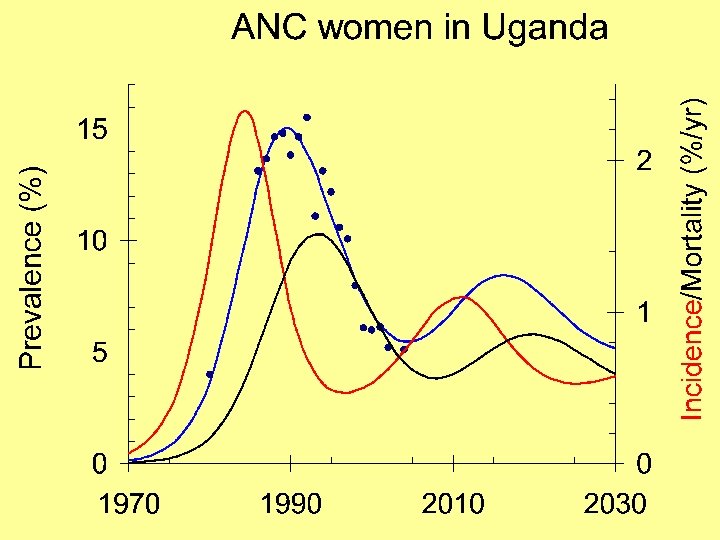
~ N ~ S SI /N m. S ~ N ~ l = birth rate = population = C(t) I = mortality Including control I I I C(t)
~ N S * SI /N m. S ~ N l* = birth rate = population = e – M I I I e – M I = mortality Mortality leads to behaviour change
Nairobi 6 yr Nunn P et al. Tuberculosis control in the era of HIV. Nat Rev Immunol. 2005 Oct; 5(10): 819 -26.
TB incidence among gold miners in SA Corbett EL Stable incidence rates of tuberculosis (TB) among human immunodeficiency virus (HIV)-negative South African gold miners during a decade of epidemic HIV-associated TB. J Infect Dis. 2003; 188: 1156 -63.
Prevalence (%) HIV+ 0. 44 (0. 02 -1. 05) HIV- 0. 55 (0. 14– 0. 95) SS+ Tuberculosis Incidence Disease Duration (%/yr) (yr) 2. 87 (1. 94 -4. 25) 0. 15 (0. 05 -0. 48) 0. 48 (0. 27 -0. 84) 1. 15 (0. 48 -1. 13) DDR = 0. 13 (0. 09– 0. 20) Gold miners in South Africa We define disease duration as prevalence divided by incidence
TB-HIV model Repeat the model 4 times, once for each stage of HIV. Use time series of HIV prevalence to determine incidence. Incidence gives rate at which people enter first stage; overall (Weibull) survival determines rate at which people move to next stage. Williams BG et al. The impact of HIV/AIDS on the control of tuberculosis in India. PNAS 2005 102: 9619 -9624.
Impact of interventions on TB cases in Kenya TB incidence/100 k/yr 800 . Baseline ARV 80% TLTI (6 m) 600 TLTI (life) ARV 100% 400 TB detect. TB cure HIV incid 200 0 1980 2000 2020 Year 2040 Base line: CDR = 50% CR = 70% Interventions: 1% increase Currie, C. et al. Cost, affordability and cost-effectiveness of strategies to control tuberculosis in countries with high HIV prevalence. BMC, 2005. 5: 130.
Percent HIV negative Percent HIV positive Williams BG et al. HIV Infection, Antiretroviral Therapy, and CD 4+ Cell Count Distributions in African Populations. J Infect Dis, 2006 194: 1450 -8.
Initial CD 4/m. L 2, 000 Model 1 CD 4 decline independent of starting value 1, 000 Survival determined by preinfection CD 4 20 Initial CD 4/m. L 10 2, 000 Time to death (yrs) Model 2 Survival independent of starting value 1, 000 CD 4 decline determine entirely by starting value and survival distribution 10 20 Time to death (yrs)
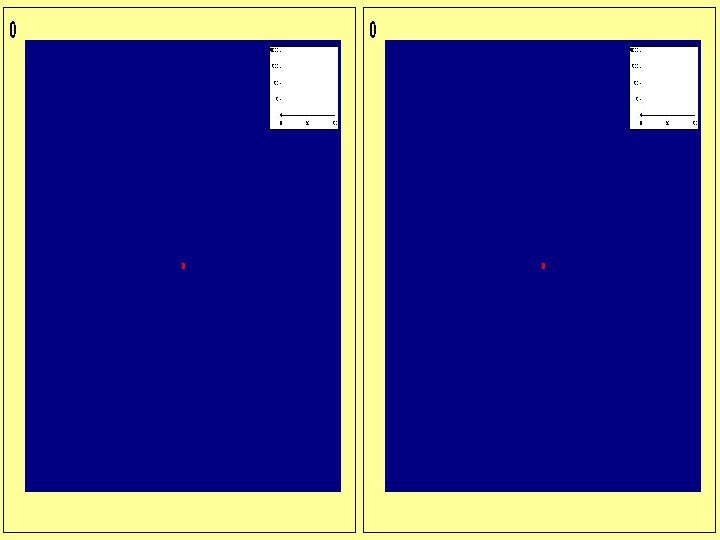
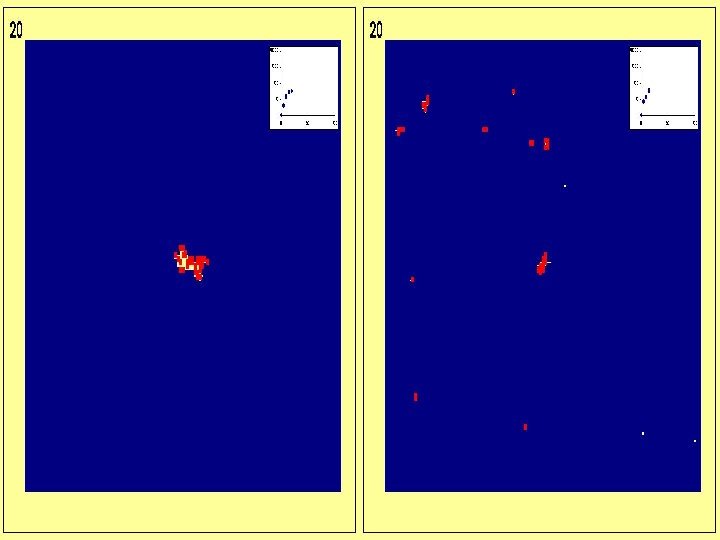
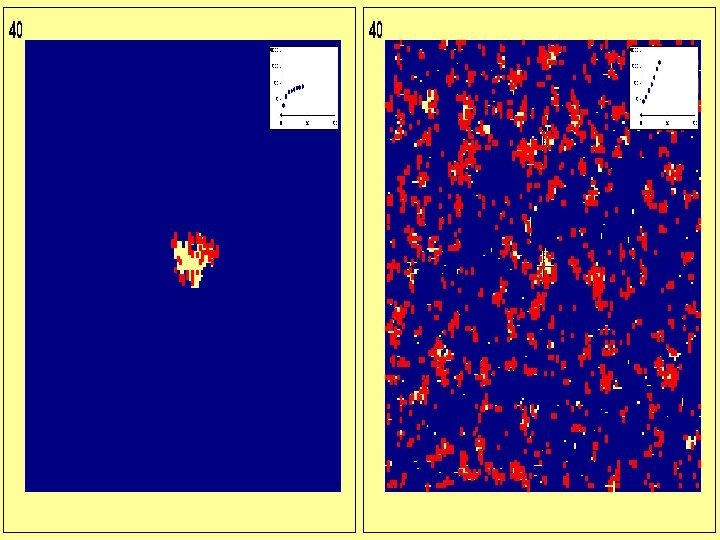
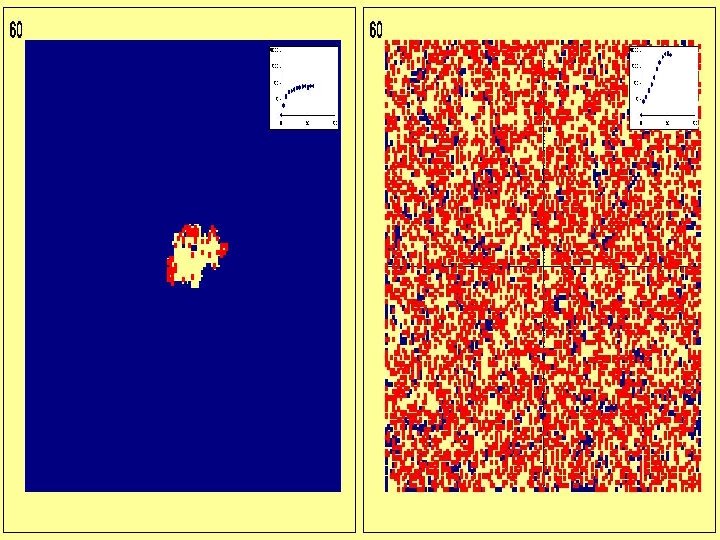
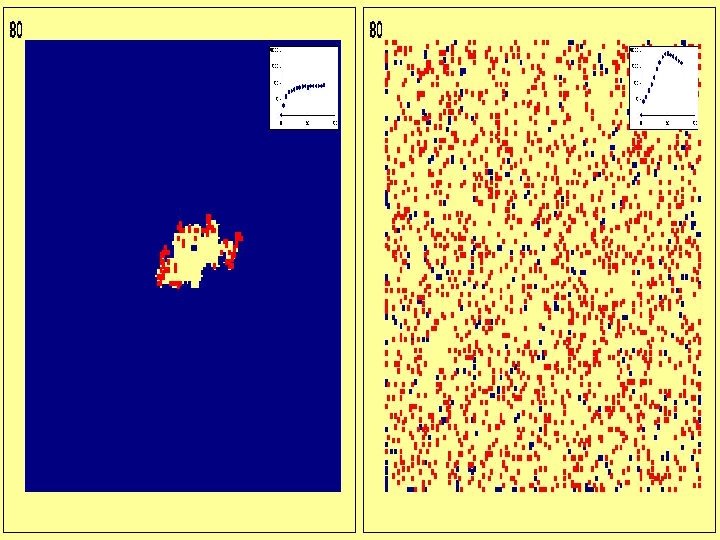
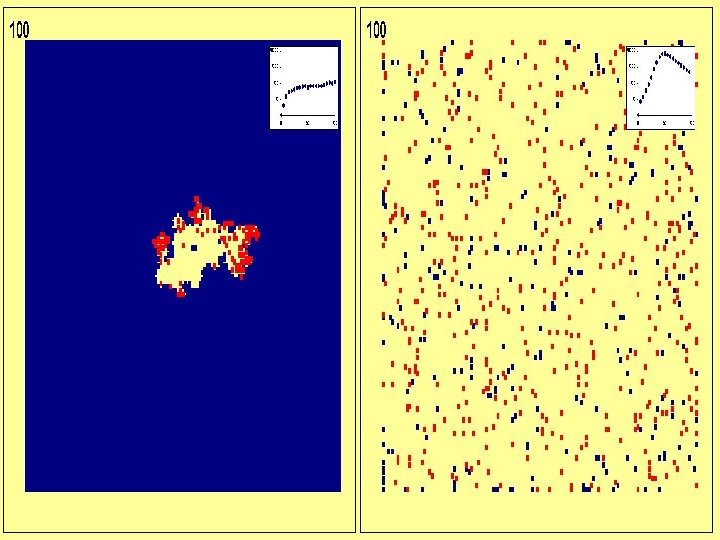
Spatial Epidemiology of HIV Doubling time = 1 year Life expectancy = 10 years Number of partners = 4 Proportion of random partners chosen at random = 0 (left hand set) or 10% (right hand set) in the following slides. Note that in this model migrants have exactly the same sexual behaviour and individual risk as non-migrants.
Questions for all of us 1. Can we combine spatial/network models with our more conventional continuous time models of HIV? 2. Can we get a better understanding of the host-viral interaction? 3. What are the population level implications of 2? 4. Do we have enough data to explore fully the joint dynamics of TB and HIV?
Advice to young epidemiologists Never make a calculation until you know the answer. Make an estimate before every calculation, try a simple biological argument (R 0, generation time, selection, survival, control). Guess the answer to every puzzle. Courage: no one else needs to know what the guess is. Therefore, make it quickly, by instinct. A right guess reinforces this instinct. A wrong guess brings the refreshment of surprise. In either case, life as an epidemiologist, however long, is more fun. Plagiarised from E. F. Taylor and J. A. Wheeler Space-time Physics 1963