Crosssectional Studies Pnar Ay MD MPH Marmara University


 Studies A cross-sectional study provides information about a health condition / disease")


- Slides: 49
Cross-sectional Studies Pınar Ay, MD, MPH Marmara University School of Medicine Department of Public Health npay@marmara. edu. tr
Learning Objectives At the end of the session the participants will be able to: � define the design of x-sectional studies, � describe the measures used in x-sectional studies � explain the biases of x-sectional studies, � list the uses of x-sectional studies.
Epidemiological Studies Observational Experimental • Randomized Controlled Trials Descriptive • Quasi Experimental Analytical • Cohort • Case-control • Cross-sectional • Ecological
Cross-sectional (Prevalence) Studies A cross-sectional study provides information about a health condition / disease that exists at a given time/during a given period. �Descriptive �Analytical
Design of Cross-sectional Studies Defined Population Gather data on exposure and disease Exposure + Outcome + Exposure + Outcome - Exposure Outcome + Exposure Outcome -
CROSS-SECTIONAL STUDIES DON’T HAVE A DIRECTION Cohort Exposure Cross-sectional Case-control Outcome
Sampling strategy In cross-sectional studies the sample should be representative of the study population. 1. Sample size 2. Sample design
Sample Size Once upon a time a researcher was presenting the findings of a trial where he assessed the effectiveness of a new drug for sheep. ‘After administering the drugs’ he said ‘one third of the sheep improved significantly, one third did not show any change, and the last one ran away’
Sample size The sample size for an estimation is determined by the assumptions and the precision required. There should be a high probability that the estimate is close to the true value margin of error ≈ 95% confidence
Example To estimate the mean systolic blood pressure for adults with a margin of error of 1 with 95% confidence. (sd=15 mm-Hg) Margin of error: 1 Confidence: 95% Sd: 15 mm-Hg If the mean is 120 mm-Hg 119 120 121
Estimating a population mean standard deviation margin of error sample size needed Z score: the distance from the mean of a stipulated probability, in sd units, of a hypothetical normal distribution with a mean of 0. Zα/2 : Z score associated with the stipulated level of α.
Example To estimate the mean systolic blood for adults with a margin of error of 1 with 95% confidence. (sd=15 mm. Hg) Margin of error: 1 Confidence: 95% Sd: 15 mm-Hg n = (1. 96 x 15 / 1)2 n = 866
Estimating a population proportion 1 -p margin of error sample size needed estimate of the population proportion
Example To estimate the proportion of hypertensive adults with a margin of error of 0. 05 with 95% confidence. (p=20%) Margin of error: 0. 05 Confidence: 95% p = 20% n = (1. 96/0. 05)2 (0. 20 x 0. 80) n = 246 If we have no idea of p, then assume p=50%
Sampling design Probability sampling is one in which every member of the population has a known and nonzero probability of being selected into the sample. Simple random sampling Systematic sampling Stratified sampling Probability sampling Cluster sampling Multi-stage sampling
Simple Random Sampling � Each member of the population has an equal chance of being selected. � We need a sampling frame (list of all members of the population from which the sample is to be drawn) � Sampling frame should be current and accurate.
Methods of simple random sampling �Lottery �Table of random numbers �Computer programs
Systematic sampling � It is used when elements can be ordered. � A selection interval (n) is determined, by dividing the total population listed by the sample size. � A random starting point is choosen and every nth person is selected
Stratified sampling � The target population is divided into suitable, non- overlapping strata. � Each stratum should be homogenous within and heterogenous between other strata. � A random sample is selected within each startum • Each startum is more accuretly represented • Seperate estimates can be obtained for each stratum, and an overall estimate can be obtained for the entire population
Cluster sampling � It is used when the population is geographically dispersed or when a sampling frame is not available. � Units first sampled are not individuals, but clusters of individuals � Looses some degree of precision so design effect should be used. � Villages � Neighborhoods � Households Clusters � Schools � Factories
Non-response bias Non-respondents / nonparticipants may bias the findings because respondents and non-respondents may differ with respect to what ever is being studied. Compare the demographic characteristics of the respondents with those of the non-respondents
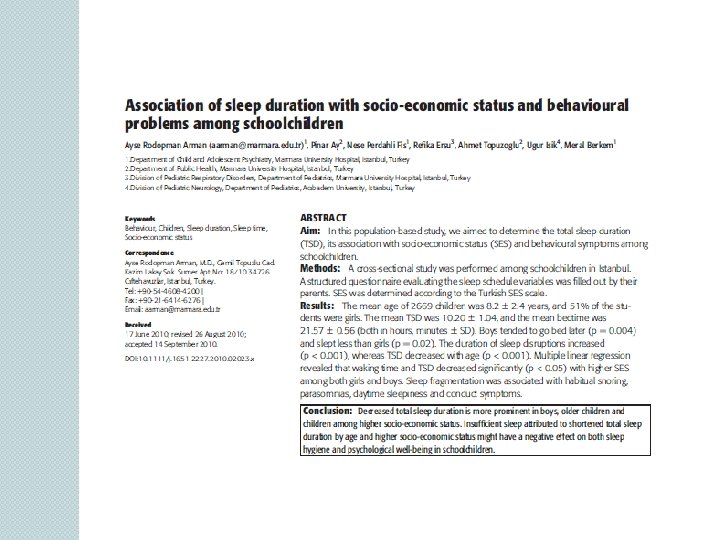
THE PREVALENCE OF HEADACHE AND ITS ASSOCIATION WITH SOCIOECONOMIC STATUS AMONG SCHOOLCHILDREN IN ISTANBUL, TURKEY
Prevalence Rate ‘Stopping the clock’ and assessing disease/attribute frequency at a point of time Fixed calendar time Number of prevalent cases Prevalence = x k Number of individuals studied
Prevalence Rates �Point prevalence �Period prevalence Number of prevalent cases in the stated time period Prevalence = x k Population at risk Average size of the population during the specified period
Point vs. Period Prevalence Question Measure Do you currently smoke? Point prevalance Have you had smoked during the last (n) years? Period Prevalance
Incidence vs. Prevalence � Incidence rates: measure the occurrence of new cases of a disease/other events � Prevalence rates: measure the presence of a disease/other events
Incidence and Prevalence = Incidence x mean duration of disease
Measures of Associations Exposure Outcome Yes No Total Yes a b a+b No c d c+d a+c b+d n Total OR = (a/c) / (b/d) = ad/bc
Measures of Associations Exposure Outcome Yes No Total Yes a b a+b No c d c+d a+c b+d n Total If the factor is a risk factor Excess risk among exposed: a/(a+b) – c/(c+d) Attributable fraction (exposed): [a/(a+b) – c/(c+d)] / [a/(a+b)] x 100 Attributable fraction (population): [(a+c)/n – c/(c+d)] / [a+c)/n] x 100
Measures of Associations Factor Outcome Yes No Total Yes a b a+b No c d c+d a+c b+d n Total If the factor is a protective factor Excess risk among unexposed: c/(c+d) - a/(a+b) Prevented fraction (exposed): [c/(c+d) - a/(a+b)] / [c/(c+d)] x 100 Prevented fraction (population): [c/(c+d) - (a+c)/n] / [c/(c+d)] x 100
Which measure to use? � Causal relationships � Magnitude of a health problem ORs Differences between prevalences What is the impact on productivity? What are the treatment costs? How many people have the disease in a population because of the exposure?
Data collection methods Clinical observations and special tests 2. Interviews and questionnaires 3. Clinical records and other documentary sources 1. Prevalence studies should use more than one method and combine the findings
Capture-recapture analysis �Prevalence surveys that use more than one method and combine the findings �Originally used in estimating animal populations
Capture-recapture 1. Mark and release a batch of captured fish 2. Calculate how many are recaptured in the next batch
Capture recapture n 1 = number in first sample n 2 = number in second sample ntotal = number in two samples N = total population size N = [(n 1+1) (n 2 +1) / (ntotal +1)] -1
Estimating problem drug use in Ankara, Istanbul and Izmir Aim: to estimate the prevalence of PDU at a local level, in the three cities Ankara, Izmir and Istanbul. Methods: Capture-recapture method was used to estimate the number of problem drug users, Data was available from: � the Ministry of Interior – Turkish National Police, � the Ministry of Justice – Prisons and Detention Houses, � the Ministry of Justice – Probation Services, � the Ministry of Health, the Ministry of Social Affairs – Social Security Institution.
Estimating problem drug use in Ankara, Istanbul and Izmir � Data include a personal ID code, demographic information such as age, gender and region, and, depending on data source, diagnosis of substance use disorders or type of drug use. � The total number of opiate-related cases is 2, 637 in Ankara, 7, 094 in Istanbul and 235 in Izmir, respectively.
Uses of X-sectional Studies Community Health Care Community diagnosis � Surveillance � Community education and community involvement � Evaluation of community’s health care � Clinical Practice Individual care � Family care �
Uses I: Community Diagnosis 1 2 3 4 • Define the Health Problems in the Community and the factors that influence it • Prioritize the Health Problems and Select one Problem • Develop and Implement an Intervention • Evaluate the Intervention
Length Time Bias Point prevalence provides an incomplete picture due to underrepresentation of conditions with short duration. Famine in Chad in 1985 • Cross-sectional study • Severe malnutrition among children did not exist! • Many children died too soon to be included in the survey.
Uses II: Determinants of health and disease �The aim is what causal factors or correlates are active in the specific community and to measure their impact. �The primary aim is not to generate new knowledge about etiology The presence of both exposure and disease is determined simultenously, so often it is not possible to establish a causal relationship
Uses III: Intervention and Policy Decisons Measures of impact: Basis for intervention and policy decisions Attributable fraction in the population � Prevented fraction �
Uses IV: Surveillance Ongoing surveillance: identification of changes in health status and its determinants in the community Repeated cross-sectional studies: but does not indicate changes in the risk of developing the disease • Interplay of of incidence, recovery and fatality rates • Changes in the demographic aspects • Changes in methods of case identification, use of medical services, diagnostic procedures, recording, notification or registration practices
Temporal trends in overweight and obesity of children and adolescents from nine Provinces in China from 1991 -2006. OBJECTIVES: To assess temporal changes in mean body mass index (BMI) and the impact of socio-economic status on the prevalence of overweight and obesity among Chinese children and adolescents in nine provinces between 1991 and 2006. METHODS: Analysis of height and weight data in children and adolescents aged 717 years with complete information on age, gender, region, height and weight from consecutive China Health and Nutrition Surveys (CHNS). CONCLUSIONS: The prevalence of overweight and obesity among Chinese children and adolescents has increased steadily over the past 15 years with the increase being apparent in all age, sex and income groups.
Uses V: Evaluation of a Community’s Health Care � Form a basis for decisions about the provision of care; � Compliance for medical advice, � Satisfaction with medical care � A special attention should be given to population subgroups because the impact of health programe varies with age, gender, social class etc.