Minnesota Master Marketer Mankato MN Livestock Markets Slides


 Change Commercial from Year Slaughter Year Ago")
 Year Quarter 2015 I II IV Year")
 Year Quarter 2015 I II IV Year")


: West (19. 9%) Southeast (18. 0%) Great")


")
 (http: //www 2.")

: -$0. 34 (-5. 4%) Retail (All Fresh): -$0. 10")
 Wholesale-Retail Share (43. 9%) Farm-Wholesale Share (8. 9%) 2014 2015")
 is the big mover among competitors § Peso (-18%) much")


 (http: //www 2.")


 Sources: USDA/NASS; USDA/AMS Livestock Market News;")
 Sources: USDA/NASS; USDA/AMS Livestock Market News;")

 +394, 863 14. 6% (‘")

 Sioux City, IA ― Seaboard/Triumph Coldwater, MI ― Clements")
")
 is the big mover among competitors § Peso (-18%) much")


- Slides: 56
Minnesota Master Marketer Mankato, MN Livestock Markets Slides by: Lee Schulz Department of Economics February 10, 2016 Presented by: Chad Hart Department of Economics Iowa State University (515) 294 -3356 (515) 294 -9911 lschulz@iastate. edu chart@iastate. edu
Key livestock market highlights § Crop & feedstuffs situation – ADVANTAGEOUS for livestock sector § Size of hog industry driven by recent profitability – Productivity to guide 2 nd half 2016 supply prospects § Still relatively tight cattle-beef supplies but expansion well underway – 2015 was a year of transition § HPAI in poultry in 2015 -16 – Rebuild/expansion underway § Relatively stable domestic dairy herd expected through 2017 – Worldwide production up, prices lower § U. S. consumer demand has been GOOD – International trade a bit of a drag but should improve
Broad 2016 Beef Situation & Outlook Industry at tipping point on role of tight supplies – Cow-calf: Good (but not 2015; definitely not 2014) – Stocker: VOG estimates low & volatile – Feedlot: Improved (2015 historically low), still red ink
Quarterly Cattle & Beef Forecasts (LMIC: 2/5/2016) Change Commercial from Year Slaughter Year Ago Quarter (1, 000 hd) (%) 2014 7, 374 -5. 2 I 7, 837 -5. 9 II III 7, 632 -8. 3 7, 326 -8. 8 IV Year 30, 170 -7. 1 2015 I 6, 967 -5. 5 II 7, 227 -7. 8 7, 288 -4. 5 III IV 7, 257 -0. 9 Year 28, 739 -4. 7 2016 I 7, 052 1. 2 II 7, 280 0. 7 7, 559 3. 7 III IV 7, 455 2. 7 29, 346 2. 1 Year 2017 I 7, 366 4. 5 II 7, 583 4. 2 III 7, 765 2. 7 IV 7, 788 4. 5 Year 30, 502 3. 9 Average Change Dressed from Weight Year Ago (lbs) (%) Commercial Change Beef from Production Year Ago (mil lbs) (%) 796 789 810 822 804 0. 3 0. 9 1. 9 2. 8 1. 5 5, 868 6, 184 6, 179 6, 021 24, 252 -5. 0 -5. 1 -6. 5 -6. 3 -5. 7 813 810 832 841 824 2. 2 2. 7 2. 8 2. 4 2. 5 5, 664 5, 855 6, 066 6, 105 23, 690 -3. 5 -5. 3 -1. 8 1. 4 -2. 3 822 813 836 840 828 1. 1 0. 4 -0. 1 0. 4 5, 795 5, 921 6, 316 6, 265 24, 297 2. 3 1. 1 4. 1 2. 6 828 818 839 843 832 0. 8 0. 6 0. 4 0. 3 0. 5 6, 101 6, 203 6, 514 6, 563 25, 381 5. 3 4. 8 3. 1 4. 8 4. 5
Quarterly Cattle & Beef Forecasts (LMIC: 2/5/2016) Year Quarter 2015 I II IV Year 2016 I II IV Year 2017 I II IV Year Live Sltr. Steer Price 5 -Mkt Avg ($/cwt) 162. 43 158. 11 144. 22 127. 72 148. 12 Change from Year Ago (%) 11. 0 7. 0 -9. 0 -22. 9 -4. 2 136 -138 -15. 7 139 -142 -11. 1 133 -137 -6. 4 131 -136 4. 5 2014: +23% from-7. 8 2013 135 -138 132 -138 133 -140 127 -135 127 -136 131 -136 -1. 5 -2. 8 -3. 0 -1. 5 -2. 2 7 -800# Feeder Steer Price Southern Plains 5 -600# 215. 87 225. 29 214. 38 177. 29 -26. 1% 208. 21 +0. 3% 276. 14 279. 32 246. 04 203. 51 -28. 8% 251. 25 +2. 0% 164 -168 167 -172 162 -168 159 -166 -20. 3% 2014: +38% 163 -169 195 -200 198 -205 200 -208 191 -200 -20. 6% 2014: +43% 196 -203 from 2013 159 -167 160 -169 156 -166 153 -165 159 -165 -2. 4% from 2013 194 -204 196 -208 189 -202 183 -197 193 -200 -1. 5%
Quarterly Cattle & Beef Forecasts (LMIC: 2/5/2016) Year Quarter 2015 I II IV Year 2016 I II IV Year 2017 I II IV Year Live Sltr. Steer Price 5 -Mkt Avg ($/cwt) Change from Year Ago (%) 7 -800# 162. 43 158. 11 144. 22 127. 72 148. 12 11. 0 7. 0 -9. 0 -22. 9 -4. 2 136 -138 139 -142 133 -137 131 -136 135 -138 -15. 7 -11. 1 -6. 4 4. 5 -7. 8 164 -168 167 -172 162 -168 159 -166 163 -169 132 -138 133 -140 127 -135 127 -136 131 -136 -1. 5 -2. 8 -3. 0 -1. 5 -2. 2 159 -167 160 -169 156 -166 153 -165 159 -165 Feeder Steer Price Southern Plains 5 -600# 215. 87 225. 29 214. 38 177. 29 -26. 1% 208. 21 +0. 3% 276. 14 279. 32 246. 04 203. 51 -28. 8% 251. 25 +2. 0% -20. 3% 195 -200 198 -205 200 -208 191 -200 196 -203 -20. 6% -2. 4% 194 -204 196 -208 189 -202 183 -197 193 -200 -1. 5%
$ Per Cow ESTIMATED AVERAGE COW CALF RETURNS Returns Over Cash Cost (Includes Pasture Rent), Annual 500 1/4/16 Projections (vs 9/4/15) 2015: $301 (vs $467) 2016: $200 (vs $394) 400 300 200 100 0 -100 1987 1989 Data Source: USDA & LMIC, Compiled by LMIC Livestock Marketing Information Center 1991 1993 1995 1997 1999 2001 2003 2005 2007 2009 2011 2013 2015
Expansion Observations • Beef cow culling historically low • Heifer retention continues Youngest herd in history • Expanding less expensive BUT profitability lower • Con’t strength in replacement-to-feeder heifer premium • Production costs and longevity key to profitability • Herd expansion ongoing; not uniformly • Most significant upturn in cattle cycle in 20 years
Top 10, 2015 to 2016 Head % TX +160, 000 +3. 9% OK +73, 000 +3. 9% MO +61, 000 +3. 3% NE +96, 000 +5. 5% SD +79, 000 +4. 9% KS +61, 000 +4. 3% MT -10, 000 -0. 7% KY +24, 000 +2. 4% IA +40, 000 +4. 4% FL +9, 000 +1. 0% Total 593, 000 +3. 5% 2016: +3. 5% 30. 3 million Data Source: USDA/NASS
HEIFERS HELD AS BEEF COW REPLACEMENTS January 1, U. S. Mil. Head 7, 0 + TX, OK (40, 000, +9. 5%), MO, IA (10, 000, 5. 6%), KY – MT, NE (-30, 000, 7. 1%), SD (-30, 000, 7. 4%), KS, FL 3 Largest +% Years Since 1986 2015: +9. 6% 1993: +8. 0% 1982: +7. 7% 6, 5 2016: +3. 5% 6, 0 5, 5 5, 0 4, 5 1986 Data Source: USDA-NASS Livestock Marketing Information Center 1989 1992 1995 1998 2001 2004 2007 2010 2013 2016
Data Source: USDA/NASS
1. 2. 3. 4. 5. 1996 (%): West (19. 9%) Southeast (18. 0%) Great Plains (17. 3%) Cornbelt (16. 7%) S. Plains (16. 1%) U. S. = 17. 5% 1. 2. 3. 4. 5. 2006 (%): Great Plains (19. 5%) West (18. 8%) Cornbelt (17. 6%) Southeast (16. 5%) S. Plains (16. 9%) U. S. = 17. 9% 1. 2. 3. 4. 5. 2016 (%): West (23. 0%) Great Plains (22. 8%) Cornbelt (20. 5%) S. Plains (19. 9%) Southeast (17. 4%) U. S. = 20. 7% Data Source: USDA/NASS
JANUARY 1 FEEDER CATTLE SUPPLIES Residual, Outside Feedlots, U. S. Mil. Head 40 3 Largest +% Years Since 1965 1974: +10. 1% 1975: +9. 1% 2016: +5. 3% 38 + OK, KS (225, 000, 13. 4%), NE (130, 000, 9. 5%), CA, IA (50, 000, 4. 3%), SD, MN, CO – 36 TX (-110, 000, 3. 4%), WI 34 32 30 2016: +5. 6% 28 26 24 22 20 Data Source: USDA-NASS 1986 1989 Livestock Marketing Information Center 1992 1995 1998 2001 2004 2007 2010 2013 2016
Added Investment Cost per Cow Expanding is getting less expensive BUT… profitability projections much lower also 55% 18% Increase in investment cost 6% Data Source: USDA/AMS
Net Present Value of Beef Replacement Females * Schulz & Gunn forecasts of 2016 -2022 calf & cull cow prices, weaning weights
Net Present Value of Beef Replacement Females Using base values; NPV = $0, Max bid price = $1, 460 ($1, 460 purchase price, 7 calves, 100% marketable, 5% discount rate, $800 cow costs) 1) Marketable calves o Every 1% ∆ in marketable calves worth ~$64 in NPV (or in max bid price) 2) Calving years o Every 1 year ∆ in calving year worth ~$124 in NPV 3) Annual cow costs o Every $1 ∆ in annual cow cost worth ~$5. 79 in NPV 4) Targeted rate of return (discount rate) o Every 1% ∆ in targeted rate of return worth ~$80. 24 in NPV 5) Calf and cull cow prices o Every 1% ∆ in calf/cull prices worth ~$70. 88 in NPV 6) Weaning weights o Every 1% ∆ in weaning weights worth ~$63. 26 in NPV
How Much Expansion? USDA & FAPRI Projections http: //www. usda. gov/oce/commodity/projections/index. htm http: //www. fapri. missouri. edu/wp-content/uploads/2015/09/FAPRI_MU_Report_03 -15. pdf Would be largest herd since 2001 Yr-over-Yr FAPRI 2016: +3. 4% 2017: +2. 3% 2018: +0. 6% 2019: +0. 3% 2020: – 0. 6% 2015 -20: +6. 1% Yr-over-Yr USDA 2016: +2. 4% 2017: +1. 3% 2018: +1. 6% 2019: +1. 6% 2020: +1. 3% 2015 -20: +8. 4% 2015 -25: +11. 8%
Feedlot Observations • Poor 2015 cash returns – “Extra heavy” situation + demand concerns • Structural concerns & uncertainty persist: – Excess capacity, heifer retention, plant closures, cash trade & price discovery
Data Source: USDA/NASS
Cattle on Feed More than 120 Days, 1000+ head Capacity Feedlots, January 1 Change in Number of Head 2016 vs Avg 2010 -14 2015 U. S. 216, 200 287, 000 IA (1, 000+) 22, 600 11, 000 IA (<1, 000) 45, 600 33, 000 MN 48, 000 15, 000 SD -400 30, 000 NE -33, 000 30, 000 KS 48, 000 15, 000 CO -28, 000 5, 000 TX 130, 000 110, 000 OK -18, 200 16, 000 Percent Difference 2015 vs Avg 2010 -14 2014 6. 6% 9% 12. 6% 6% 21. 6% 15% -1. 2% 41% -0. 7% 115% -6. 2% 6% 7. 8% 2% -10. 9% 2% 14. 9% 12% -18. 2% 24% Data Source: USDA/NASS
Source: USDA/AMS
Source: USDA/AMS
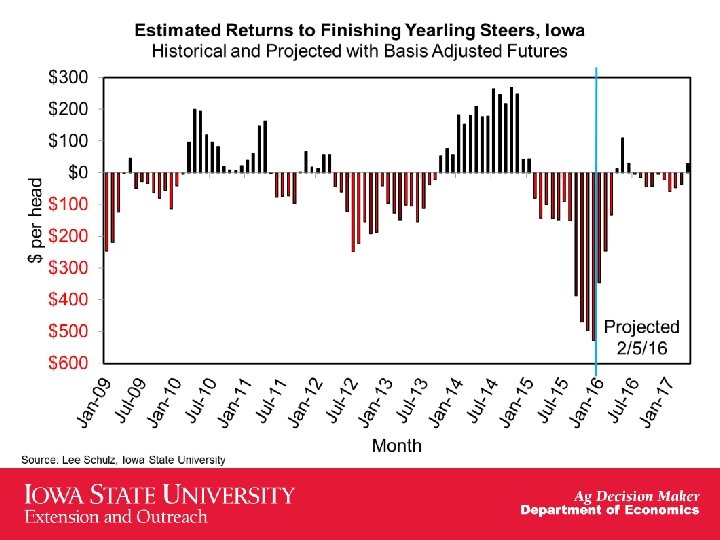
Historical and Projected Iowa Finishing Yearling Steer Returns (http: //www 2. econ. iastate. edu/estimated-returns/) December 2015 Summary Revenue: $1, 627/steer (1, 300 lbs @ $125. 15/cwt) Feeder Cattle Purchase: $1, 733/steer (750 lbs @ $231. 10/cwt) Gross Margin (Fat-Feeder): -$106/steer Break-Even COG (550 lbs added): -$0. 19/lb VS Estimated COG: $0. 77/lb = -$530/steer margins
Historical and Projected Iowa Finishing Yearling Steer Returns (as of 2/5/16) (http: //www 2. econ. iastate. edu/estimated-returns/) Place Closeout Mo-Yr Jul-15 Aug-15 Sep-15 Oct-15 Nov-15 Dec-15 Jan-16 Feb-16 Mar-16 Apr-16 May-16 Jun-16 Jul-16 Mo-Yr Dec-15 Jan-16 Feb-16 Mar-16 Apr-16 May-16 Jun-16 Jul-16 Aug-16 Sep-16 Oct-16 Nov-16 Dec-16 2013 2014 2015 2016 Net Fed Feeder Breakeven Return* FCOG** Price -529. 76 77. 00 125. 15 231. 10 -346. 71 76. 45 131. 10 217. 41 -246. 94 76. 31 134. 39 209. 92 -132. 66 76. 46 134. 66 195. 03 13. 71 76. 83 136. 34 178. 16 110. 23 76. 94 128. 87 152. 26 29. 40 77. 84 127. 18 159. 45 -4. 09 77. 99 121. 16 153. 37 -14. 75 78. 19 120. 62 153. 71 -43. 59 78. 98 119. 45 154. 94 -42. 15 78. 73 119. 89 155. 69 -4. 31 78. 10 120. 53 152. 22 -22. 70 77. 61 120. 37 154. 75 -59. 43 197. 24 -225. 12 -58. 71 112. 76 85. 05 79. 08 77. 54 126. 16 154. 15 147. 87 126. 21 143. 91 178. 52 228. 33 169. 74 Breakeven FCOG** -19. 32 13. 41 31. 41 52. 34 79. 32 96. 98 83. 19 77. 24 75. 51 71. 05 71. 07 77. 32 73. 48 Fed Price 165. 90 157. 77 153. 39 144. 86 135. 29 120. 39 124. 92 121. 48 121. 76 122. 80 123. 13 120. 86 122. 11 Feeder Price 160. 46 171. 18 176. 99 177. 34 179. 98 166. 96 163. 37 152. 83 151. 74 149. 12 150. 07 151. 65 151. 72 101. 95 120. 91 38. 15 66. 86 130. 73 138. 97 165. 19 130. 73 135. 99 204. 82 198. 32 161. 91 * Net return is $/head and all other values are $/carcass cwt. ** FCOG = Feeding cost of gain.
Rolling 12 -month average Net Return: Dec 2014: $197 Jan 2015: $186 Aug 2015: -$3 Feb 2016 (projected): -$271 Previous worst (-$148) was Jun 2013 … Apr 2017 (projected): -$9
Dec-15 vs Dec-14 Retail (Choice): -$0. 34 (-5. 4%) Retail (All Fresh): -$0. 10 (+1. 55%) Wholesale: -$0. 68 (-18. 0%) Net Farm: -$0. 77 (-22. 1%) Data Source: USDA/ERS
Farmers’ Share (47. 2%) Wholesale-Retail Share (43. 9%) Farm-Wholesale Share (8. 9%) 2014 2015 55. 2% 51. 5% 2014 2015 38. 9% 42. 4% 2014 2015 5. 9% 6. 2% Data Source: USDA/ERS
§ Real (-50% yr/yr) is the big mover among competitors § Peso (-18%) much weaker than year ago § Won and Yen have improved some but still weaker than year ago § CAN (-19%) weaker; customer/competitor impact B E E F Data Source: Policy Analysis Computing & Information Facility In Commerce
U. S. Beef Exports, Jan-Nov 2015 Nov-15/Oct-15 Country Mexico Japan Canada South Korea Hong Kong China (Taiwan) Vietnam Netherlands Philippines United Arab Emirates Dominican Republic Chile Italy Other Countries Total WASDE U. S. : 2014: 2, 573 mil lbs Percent -11% 0% 8% 17% 7% -3% 8% 4% 25% -31% -24% 21% 47% 16% 4% Nov-15/Nov-14 Percent 12% -29% 0% 8% 8% 13% 143% -15% 110% 16% -7% 0% -43% 20% -1% 2015: 2, 263 (-12%) (Volume excluding byproducts & variety meats) Year-to-Date 1, 000 lbs -69, 053 -116, 705 -39, 577 15, 516 -90, 431 3, 734 3, 774 1, 873 4, 095 1, 437 2, 902 -2, 694 -1, 462 -3, 948 -290, 540 Percent -17% -19% -12% 6% -25% 4% 52% 5% 16% 11% 17% -11% -8% -3% -12% 2016: 2, 475 (+9%) Source: USDA/ERS
U. S. Beef Imports, Jan-Nov 2015 Nov-15/Oct-15 Country Australia Canada New Zealand Brazil Uruguay Mexico Nicaragua Costa Rica Ireland Other Countries Total Nov-15/Nov-14 Percent -25% -9% -43% -9% -18% -12% -9% -26% -40% 1% -20% WASDE U. S. : 2014: 2, 947 mil lbs Percent -43% -11% -31% 21% 19% 21% -53% -46% -74% -27% 2015: 3, 372 (+14%) (Volume excluding byproducts & variety meats) Year-to-Date 1, 000 lbs Percent 241, 093 25% 27, 690 5% 83, 800 15% 67, 871 93% 44, 814 54% 81, 711 29% -22, 644 -19% 321 1% 2, 712 -2, 762 -23% 524, 606 20% 2016: 2, 845 (-16%) Source: USDA/ERS
Broad Global Factors • Recent adverse developments – Geo-political risks – Global GDP forecast reductions – U. S. $ strength = Exports (constraint), imports (support) • Long-term positive aspects – Global population & income growth – U. S. maintains multiple comparative advantages
Data Source: CME Group and Economic Research Federal Reserve Bank of St. Louis.
Take-Home Summary Points o Industry at tipping point on role of tight supplies o Demand’s role will become clearer going forward o Identifying & acting upon comparative advantage will increasingly be key!
Broad 2016 Pork Situation & Outlook • Supplies Ø Large supplies + Strong $US + Weaker global GDPs = more lbs at home • Demand Ø Hidden success story of industry profits Ø 13 straight quarters of growth!
2013 = +$6. 21 2014 = +$61. 85 2015 = +$7. 93 2016* = +$10. 23 [-$25. 60 to +$24. 57] [+$13. 15 to +$107. 25] [-$18. 40 to +$26. 25] [-$14. 39 to +$31. 70]
Historical and Projected Iowa Farrow to Finish Returns (as of 2/5/16) (http: //www 2. econ. iastate. edu/estimated-returns/) Farrow Closeout Total Cost Lean Hog Price Net Return Mo-Yr $/carcass cwt $/head 2013 87. 34 90. 41 3. 07 6. 21 2014 75. 34 105. 89 30. 54 61. 85 2015 64. 70 68. 61 3. 91 7. 93 Jan-Mar Apr-Jun Jun-Sep Oct-Dec 2016 = 2016 61. 71 62. 95 63. 70 63. 00 = 62. 84 60. 82 72. 68 75. 32 62. 74 = 67. 89 -0. 89 9. 73 11. 63 -0. 26 = 5. 05 -1. 80 19. 70 23. 54 -0. 52 = 10. 23 Jan-Mar Apr-Jun 2017 63. 63 64. 99 63. 76 69. 11 0. 13 4. 13 0. 25 8. 36
USDA Quarterly Hogs and Pigs Report – United States December 23, 2015 2014 2015 as % of 2014 Inventories on Dec 1 * All hogs and pigs Kept for breeding Market Under 50 pounds 50 -119 pounds 120 -179 pounds 180 pounds and over 67, 776 5, 939 61, 838 19, 801 17, 366 13, 000 11, 671 68, 299 6, 002 62, 297 19, 508 17, 282 13, 210 12, 296 100. 8 101. 1 100. 7 98. 5 99. 5 101. 6 105. 4 100. 7 - 101. 9 100. 0 - 102. 1 100. 7 - 102. 2 99. 0 - 100. 3 100. 0 - 101. 0 99. 6 - 103. 1 103. 0 - 108. 0 101. 4 100. 9 101. 5 99. 6 100. 4 101. 4 105. 3 -0. 6 0. 2 -0. 8 -1. 1 -0. 9 0. 2 0. 1 Farrowing ** Sep – Nov sows farrowed Dec – Feb intentions Mar – May intentions 2, 994 2, 895 2, 854 2, 875 2, 840 2, 850 96. 0 98. 1 99. 9 97. 5 - 98. 5 98. 6 - 100. 3 98. 5 - 103. 3 98. 1 99. 6 100. 5 -2. 1 -1. 5 -0. 6 Sep – Nov Pig Crop * Sep – Nov Pigs per Litter 30, 633 10. 23 30, 271 10. 53 98. 8 102. 9 99. 2 - 100. 2 101. 0 - 102. 3 99. 7 101. 6 -0. 9 1. 3 * 1, 000 head Pre-Report Range Pre-Report Actual Estimate ** 1, 000 litters Data Source: USDA/NASS. Urner Barry pre-report estimates
DECEMBER 1 ALL HOGS AND PIGS U. S. Inventory Mil. Head 72 69 66 63 60 57 54 51 48 45 Data Source: USDA-NASS 1990 Livestock Marketing Information Center 1993 1996 1999 2002 2005 2008 2011 2014
DECEMBER 1 MARKET HOGS U. S. Inventory Mil. Head 65 60 55 50 45 40 35 Data Source: USDA-NASS 1990 Livestock Marketing Information Center 1993 1996 1999 2002 2005 2008 2011 2014
16, 000 breeding herd additions Sep 1, 2015 to Dec 1, 2015 Data Source: USDA/NASS
Data Source: USDA/NASS
PIG CROP Quarterly Mil. Head 34 32 30 28 26 24 22 20 18 1990 Data Source: USDA-NASS Livestock Marketing Information Center 1993 1996 1999 2002 2005 2008 2011 2014
LMIC Pork Production and Price Quarterly Forecasts (2/5/16) Sources: USDA/NASS; USDA/AMS Livestock Market News; Projections and Forecasts by LMIC Year Quarter 2014 I II IV Year 2015 I II IV Year 2016 I II IV Year 2017 I II IV Year Comm’l Slaughter (1, 000 hd) 27, 131 25, 575 25, 558 28, 612 106, 876 % Chg. Year Ago 28, 723 27, 848 28, 474 30, 369 115, 414 5. 9% 8. 9% 11. 4% 6. 1% 8. 0% 215 213 210 213 29, 796 27, 838 28, 606 30, 631 116, 871 3. 7% 0. 0% 0. 5% 0. 9% 1. 3% 30, 363 28, 241 28, 549 31, 381 118, 534 1. 9% 1. 4% -0. 2% 2. 4% 1. 4% -2. 6% -4. 4% -7. 6% -4. 0% -4. 6% Avg Carcass % Chg. Weight Year Ago (lbs) 213 2. 7% 215 4. 4% 212 4. 3% 215 1. 7% 214 3. 3% Comm’l Pork Production (mil. Lbs) 5, 784 5, 504 5, 424 6, 131 22, 843 % Chg. Year Ago 0. 8% -1. 1% -1. 3% -0. 9% -0. 6% 6, 161 5, 925 5, 957 6, 456 24, 499 6. 5% 7. 6% 9. 8% 5. 3% 7. 2% 215 213 210 214 213 -0. 2% 0. 0% 0. 4% 0. 1% 6, 395 5, 941 5, 998 6, 542 24, 876 3. 8% 0. 3% 0. 7% 1. 3% 1. 5% 215 214 210 214 213 0. 2% 6, 530 6, 041 5, 997 6, 715 25, 283 2. 1% 1. 7% 0. 0% 2. 6% 1. 6% 0. 2% -3. 5% -2. 3% -1. 5%
LMIC Pork Production and Price Quarterly Forecasts (2/5/16) Sources: USDA/NASS; USDA/AMS Livestock Market News; Projections and Forecasts by LMIC Year Quarter 2014 I II IV Year 2015 I II IV Year 2016 I II IV Year 2017 I II IV Year Per Capita Consumption (retail wt) 11. 3 11. 0 11. 1 13. 0 46. 4 % Chg. Year Ago 12. 3 11. 8 12. 2 13. 5 49. 8 9. 1% 8. 0% 9. 2% 4. 0% 7. 4% 12. 7 11. 8 11. 9 13. 0 49. 4 2. 8% -0. 6% -2. 0% -3. 2% -0. 8% 60 -62 73 -76 73 -77 59 -64 66 -70 -11. 0% 1. 3% 0. 5% -0. 7% -2. 9% 64. 51 75. 72 76. 13 65. 91 70. 57 12. 8 11. 7 13. 1 49. 4 0. 6% 0. 4% -1. 7% 0. 6% 0. 0% 60 -66 70 -77 70 -78 59 -68 65 -72 3. 3% -1. 3% 3. 3% 0. 7% 67. 45 72. 15 -1. 1% -2. 7% -2. 4% 2. 2% -0. 9% Prices Nat Wtd % Chg. Avg Base Year Ago ($/cwt) 91. 44 12. 8% 111. 84 25. 2% 110. 03 15. 5% 90. 13 8. 6% 100. 86 15. 7% 68. 55 73. 52 74. 60 61. 91 69. 65 CME Lean Hogs ($/cwt) (2/5/16) -25. 0% -34. 3% -32. 2% -31. 3% -30. 9%
Data Source: CME Group
Feeder Pigs 10. 2% (‘ 15 vs ‘ 14) +394, 863 14. 6% (‘ 16 vs ‘ 15) +34, 479 Slaughter B&G’s Incorrect data from APHIS 65. 2% (‘ 15 vs ‘ 14) +273, 303 9. 7% (‘ 16 vs ‘ 15) +3, 350 Data Source: USDA/AMS & APHIS
Data Source: USDA/AMS. * Steve Meyer, Vice President, Pork Analysis, Express Markets Inc. Analytics.
New Pork Packing Plants (2017) Sioux City, IA ― Seaboard/Triumph Coldwater, MI ― Clements Foods Data Source: USDA/AMS. * Steve Meyer, Vice President, Pork Analysis, Express Markets Inc. Analytics.
2015 = +5. 3% Yr/Yr increases in last 13 quarters (since Q 4. 2012) 2015 Per Capita Consumption = +7. 4% (yr/yr) Real Pork Prices = -4. 3% IF Real Pork Prices -8. 9% ($3. 66/lb nominal) = 0. 0% Demand Change Data Source: USDA/ERS & USDL/BLS, Compiled & Analysis by Glynn Tonsor
§ Real (-50% yr/yr) is the big mover among competitors § Peso (-18%) much weaker than year ago § Won & Yen have improved but still weaker than year ago § Strong Renmimbi but not as strong as year ago § CAN (-19%) weaker; customer/competitor impact P O R K Data Source: Policy Analysis Computing & Information Facility In Commerce
Data Source: Inter. Pig
U. S. Pork Exports, Jan-Nov 2015 Nov-15/Oct-15 Country Japan Mexico Canada South Korea China (Mainland) Hong Kong Australia Philippines China (Taiwan) Honduras Colombia Dominican Republic Guatemala Chile Other Countries Total Percent 4% 5% 8% 24% -5% 16% 11% -48% -66% 30% 0% 24% 29% -38% 11% 5% WASDE U. S. : 2014: 4, 857 mil lbs Nov-15/Nov-14 Percent 15% 26% 3% 9% 90% 55% 72% 18% 26% 40% -15% 56% 28% -62% -2% 19% 2015: 4, 946 (+2% vs 2014) (Volume excluding byproducts & variety meats) Year-to-Date 1, 000 lbs -27, 271 162, 566 -14, 198 108, 051 -82, 764 -4, 035 18, 375 -24, 088 11, 508 13, 149 -19, 484 16, 546 5, 049 -2, 831 -111, 678 48, 894 Percent -2% 13% -3% 32% -26% -4% 13% -26% 48% 29% -16% 38% 17% -41% 1% 2016: 5, 125 (+4% vs 2015) Source: USDA/ERS
U. S. Pork Imports, Jan-Nov 2015 Nov-15/Oct-15 Country Canada Denmark Poland Mexico Italy Netherlands Ireland United Kingdom Spain Other Countries Total Nov-15/Nov-14 Percent -1% 6% 1% -8% -27% 63% -22% -2% 52% 68% -1% WASDE U. S. : 2014: 1, 008 mil lbs Percent 6% 35% 42% 25% -7% 84% -29% 179% 11% 125% 12% 2015: 1, 106 (+10%) (Volume excluding byproducts & variety meats) Year-to-Date 1, 000 lbs Percent 82, 410 12% -6, 119 -8% 10, 447 18% 3, 508 19% 3, 951 24% 686 7% 3, 113 29% 5, 804 84% 740 9% -108 -1% 104, 433 12% 2016: 1, 000 (-10%) Source: USDA/ERS
Take-Home Summary Points Ø Supplies will continue to grow Ø Demand has been key – MUST APPRECIATE Ø Role of exports will expand further = Break-evens for average cost producers
Thank You! More information available at: Iowa Farm Outlook & News www. econ. iastate. edu/ifo/ Ag Decision Maker www. extension. iastate. edu/agdm/ ISU Estimated Livestock Returns www. econ. iastate. edu/estimated-returns/ ISU Livestock Crush Margins www. econ. iastate. edu/margins/ http: //www. iowabeefcenter. org/ http: //www. ipic. iastate. edu/