
FAOs Global Livestock Information System from data collection

FAO’s Global Livestock Information System: from data collection to application EMPRES Expert Consultation 6 -9 June 2005, India Room A Living from Livestock Pro-Poor Livestock Policy Initiative
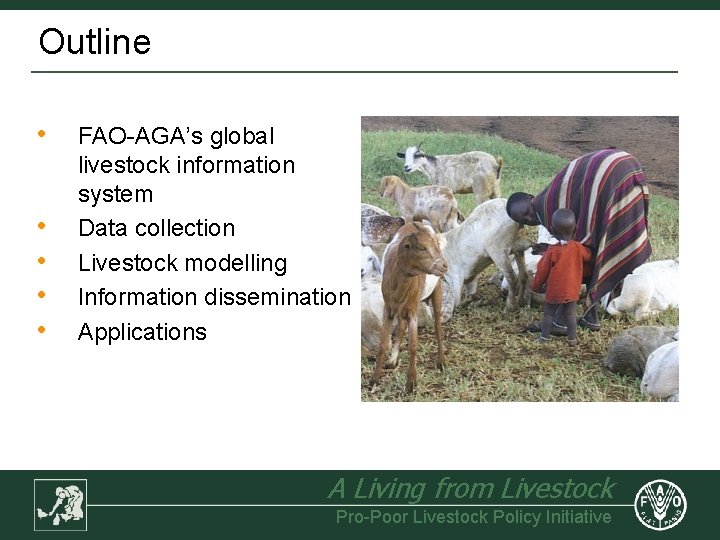
Outline • • • FAO-AGA’s global livestock information system Data collection Livestock modelling Information dissemination Applications A Living from Livestock Pro-Poor Livestock Policy Initiative
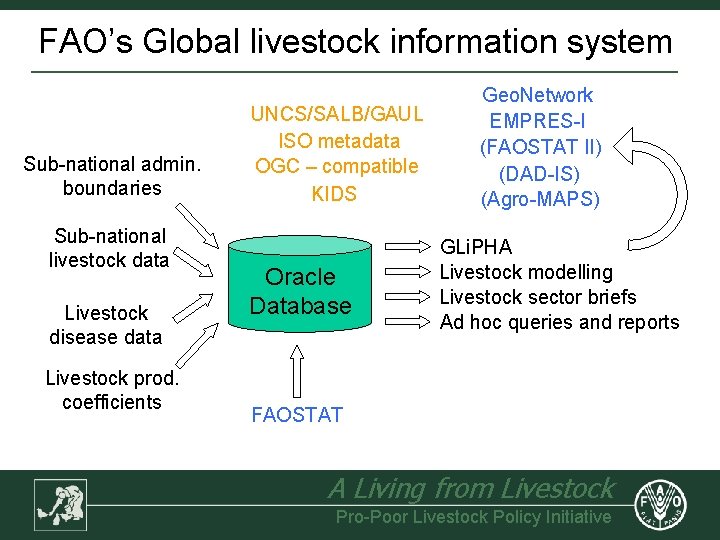
FAO’s Global livestock information system Sub-national admin. boundaries Sub-national livestock data Livestock disease data Livestock prod. coefficients UNCS/SALB/GAUL ISO metadata OGC – compatible KIDS Oracle Database Geo. Network EMPRES-I (FAOSTAT II) (DAD-IS) (Agro-MAPS) GLi. PHA Livestock modelling Livestock sector briefs Ad hoc queries and reports FAOSTAT A Living from Livestock Pro-Poor Livestock Policy Initiative
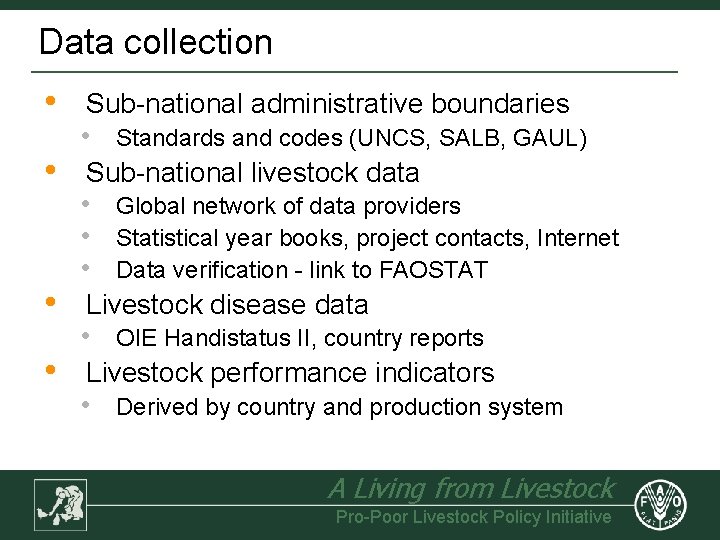
Data collection • • Sub-national administrative boundaries • Standards and codes (UNCS, SALB, GAUL) Sub-national livestock data • • • Global network of data providers Statistical year books, project contacts, Internet Data verification - link to FAOSTAT Livestock disease data • OIE Handistatus II, country reports Livestock performance indicators • Derived by country and production system A Living from Livestock Pro-Poor Livestock Policy Initiative
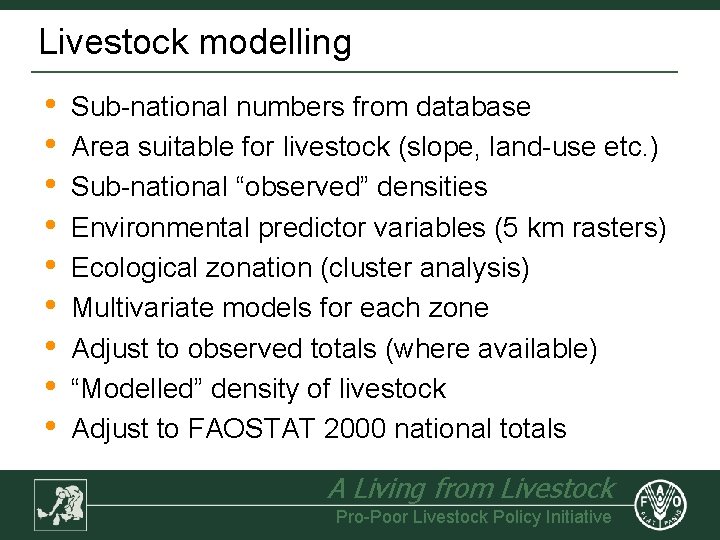
Livestock modelling • • • Sub-national numbers from database Area suitable for livestock (slope, land-use etc. ) Sub-national “observed” densities Environmental predictor variables (5 km rasters) Ecological zonation (cluster analysis) Multivariate models for each zone Adjust to observed totals (where available) “Modelled” density of livestock Adjust to FAOSTAT 2000 national totals A Living from Livestock Pro-Poor Livestock Policy Initiative
Livestock modelling • • • Sub-national numbers from database Area suitable for livestock (slope, land-use etc. ) Sub-national “observed” densities Environmental predictor variables (5 km rasters) Ecological zonation (cluster analysis) Multivariate models for each zone Adjust to observed totals where available “Modelled” density of livestock Adjust to FAOSTAT 2000 national totals A Living from Livestock Pro-Poor Livestock Policy Initiative
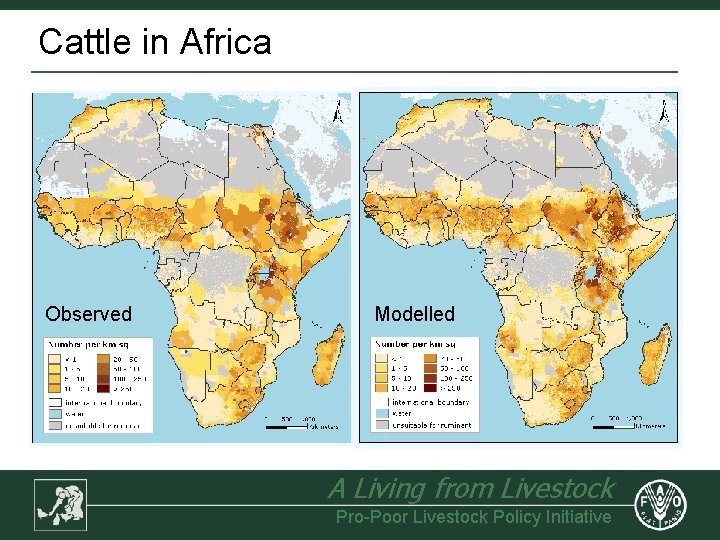
Cattle in Africa Observed Modelled A Living from Livestock Pro-Poor Livestock Policy Initiative
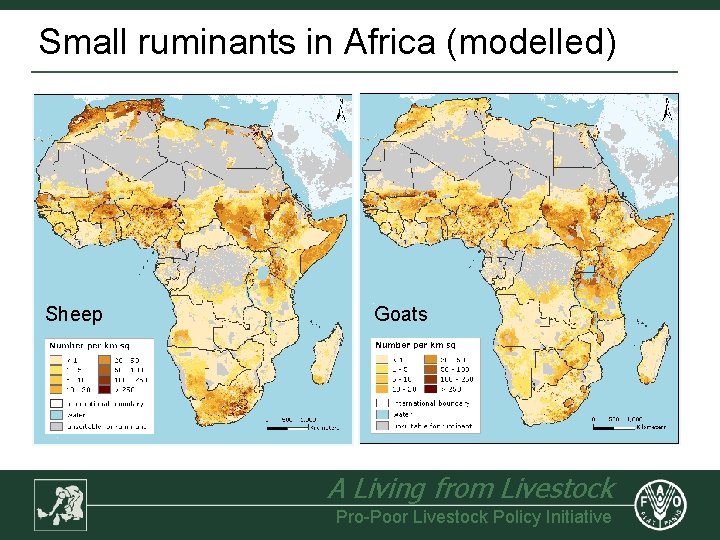
Small ruminants in Africa (modelled) Sheep Goats A Living from Livestock Pro-Poor Livestock Policy Initiative
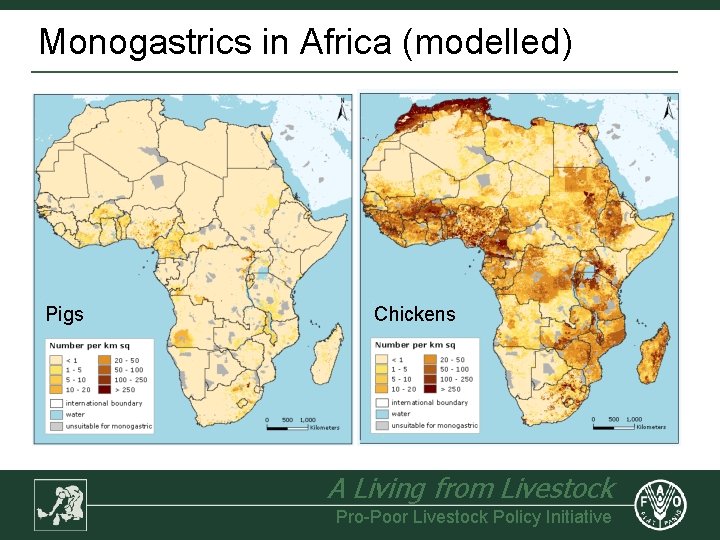
Monogastrics in Africa (modelled) Pigs Chickens A Living from Livestock Pro-Poor Livestock Policy Initiative
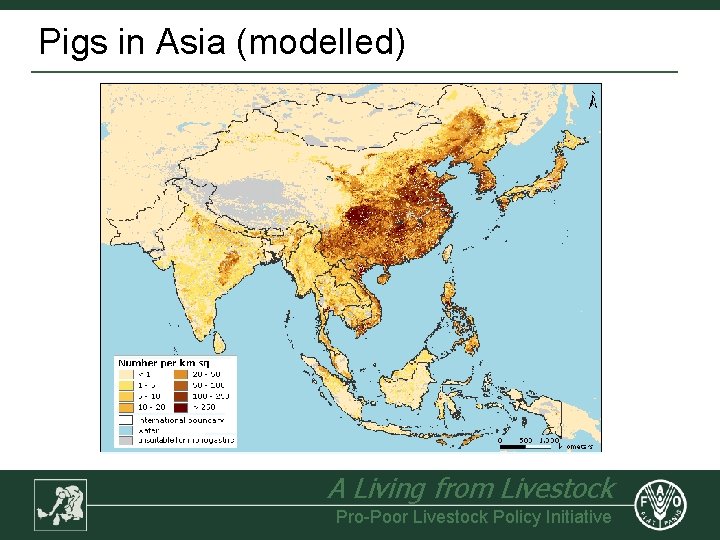
Pigs in Asia (modelled) A Living from Livestock Pro-Poor Livestock Policy Initiative
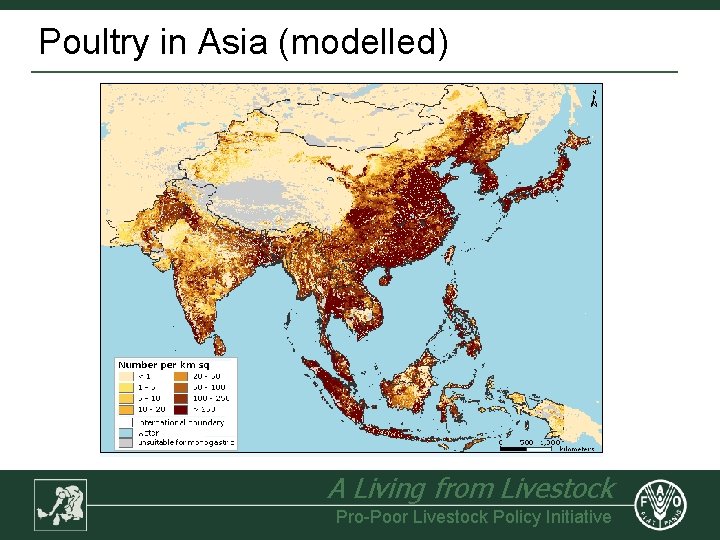
Poultry in Asia (modelled) A Living from Livestock Pro-Poor Livestock Policy Initiative
Information dissemination • Web-based information dissemination • • • Database query • • • GLi. PHA Geo. Network Livestock sector briefs Ad hoc queries and reports Planned output to other FAO applications • • • EMPRES-I Agro-MAPS FAOSTAT II A Living from Livestock Pro-Poor Livestock Policy Initiative
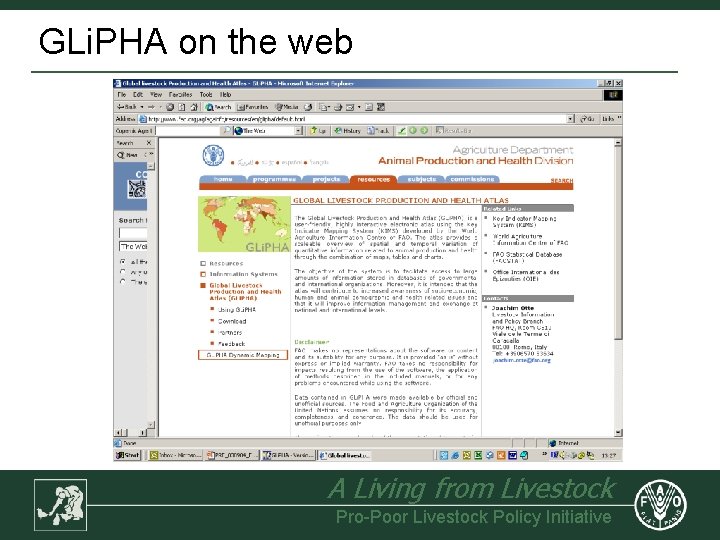
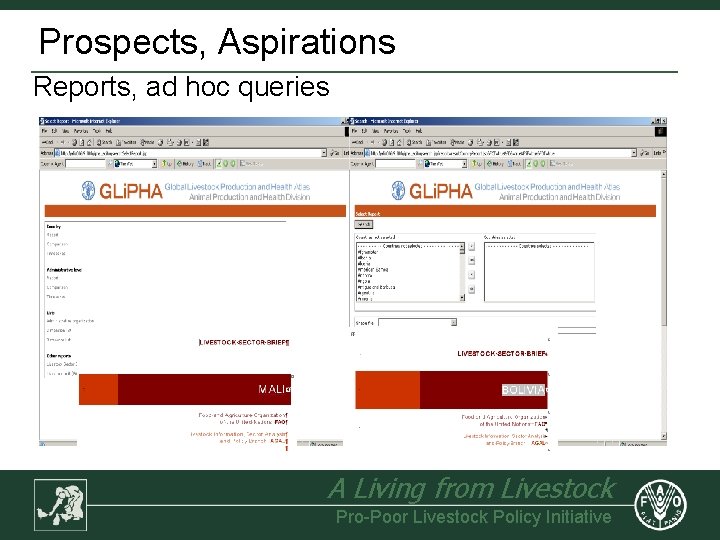
GLi. PHA on the web A Living from Livestock Pro-Poor Livestock Policy Initiative
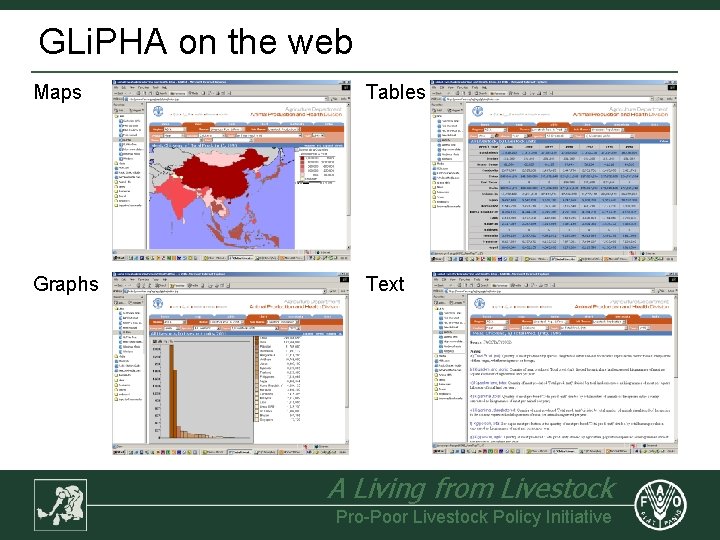
GLi. PHA on the web Maps Tables Graphs Text A Living from Livestock Pro-Poor Livestock Policy Initiative
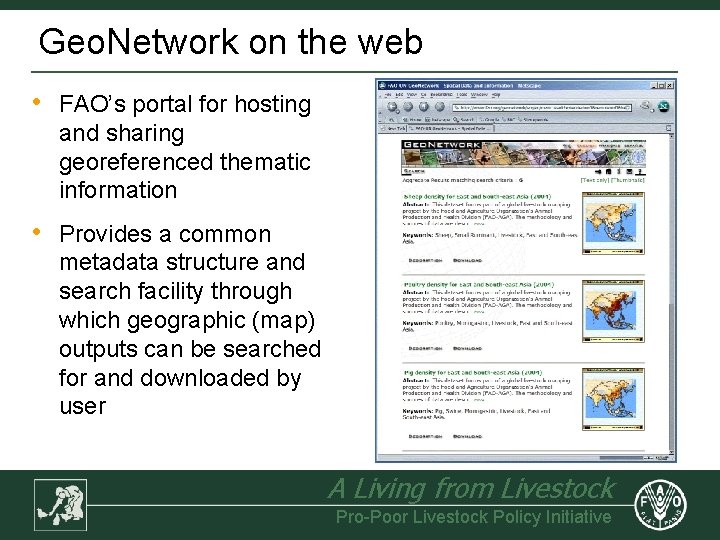
Geo. Network on the web • FAO’s portal for hosting and sharing georeferenced thematic information • Provides a common metadata structure and search facility through which geographic (map) outputs can be searched for and downloaded by user A Living from Livestock Pro-Poor Livestock Policy Initiative
Applications • • • Livestock projections Livestock production system classification Livestock production estimates Livestock disease impact analysis Livestock disease risk mapping Livestock disease spread Environmental risk mapping Public health risk mapping Poverty analysis Policy analysis A Living from Livestock Pro-Poor Livestock Policy Initiative
Applications • • • Livestock projections Livestock production system classification Livestock production estimates Livestock disease impact analysis Livestock disease risk mapping Livestock disease spread Environmental risk mapping Public health risk mapping Poverty analysis Policy analysis A Living from Livestock Pro-Poor Livestock Policy Initiative
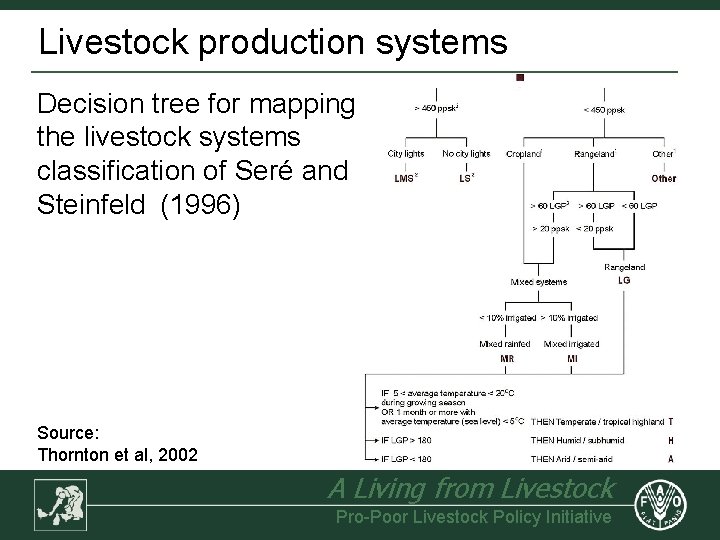
Livestock production systems Decision tree for mapping the livestock systems classification of Seré and Steinfeld (1996) Source: Thornton et al, 2002 A Living from Livestock Pro-Poor Livestock Policy Initiative
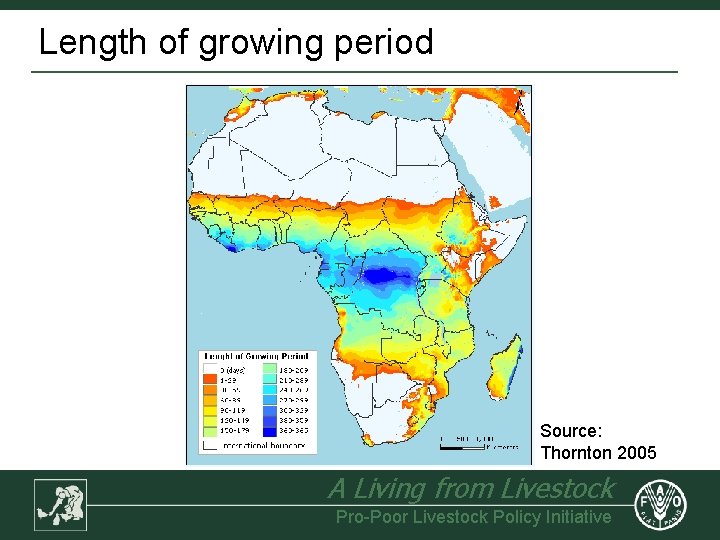
Length of growing period Source: Thornton 2005 A Living from Livestock Pro-Poor Livestock Policy Initiative
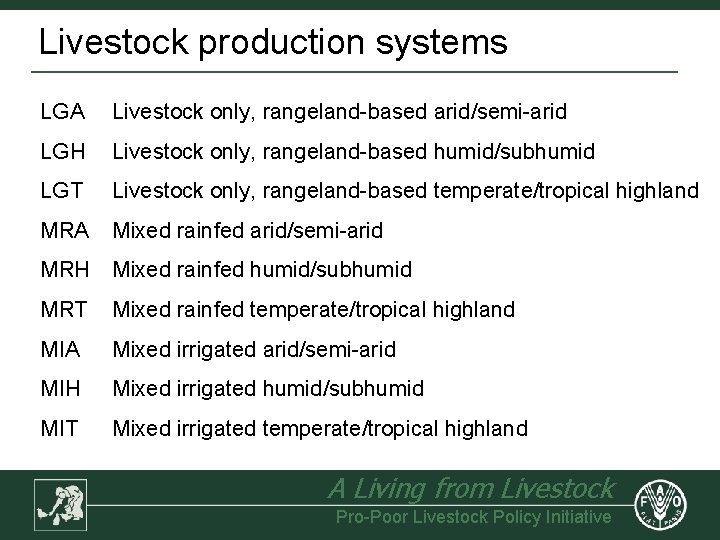
Livestock production systems LGA Livestock only, rangeland-based arid/semi-arid LGH Livestock only, rangeland-based humid/subhumid LGT Livestock only, rangeland-based temperate/tropical highland MRA Mixed rainfed arid/semi-arid MRH Mixed rainfed humid/subhumid MRT Mixed rainfed temperate/tropical highland MIA Mixed irrigated arid/semi-arid MIH Mixed irrigated humid/subhumid MIT Mixed irrigated temperate/tropical highland A Living from Livestock Pro-Poor Livestock Policy Initiative
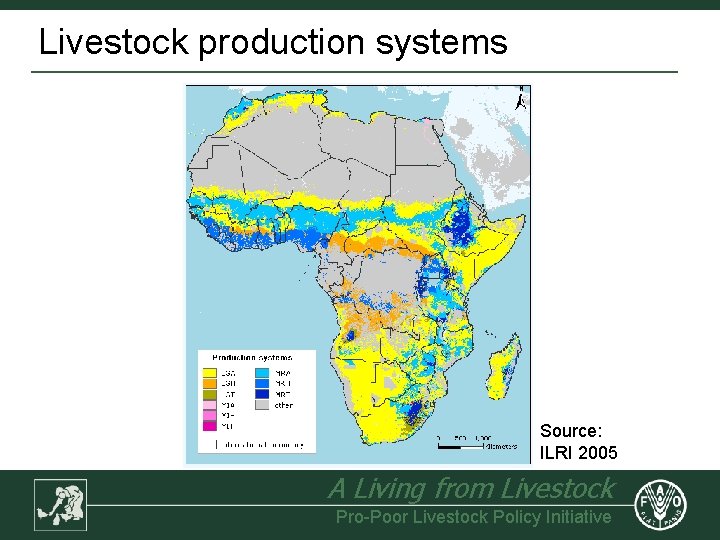
Livestock production systems Source: ILRI 2005 A Living from Livestock Pro-Poor Livestock Policy Initiative
Production modelling • • Meat and milk production rates estimated by system using Livestock Development and Planning System Model (LDPS 2) LDPS 2 output (by system) multiplied by livestock density maps by to obtain output / km² Can be scaled to other GIS layers available, e. g. human population i. e. output / person, Draught power availability mapped using herd structures (by system) A Living from Livestock Pro-Poor Livestock Policy Initiative
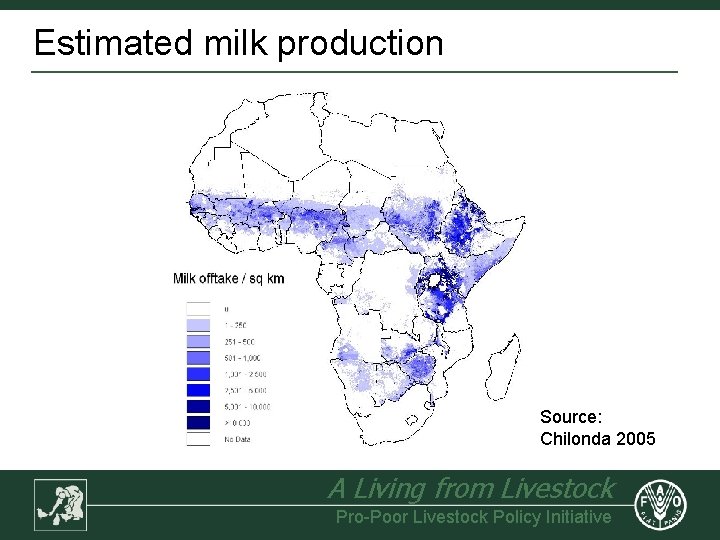
Estimated milk production Source: Chilonda 2005 A Living from Livestock Pro-Poor Livestock Policy Initiative
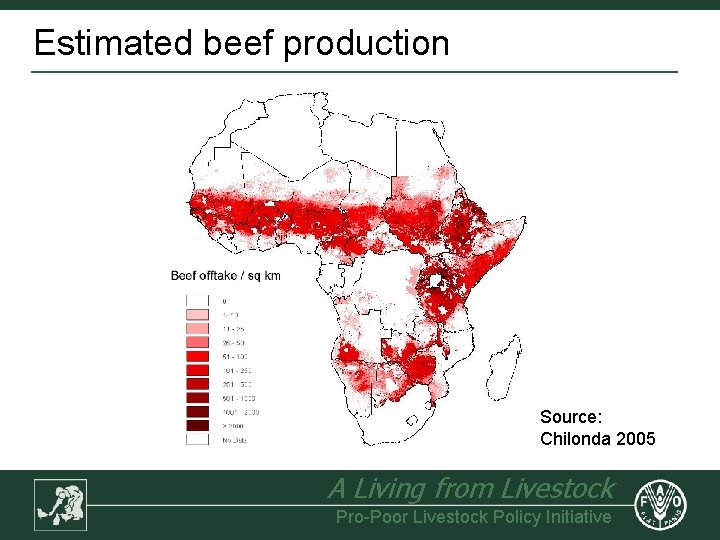
Estimated beef production Source: Chilonda 2005 A Living from Livestock Pro-Poor Livestock Policy Initiative
Disease impact (brucellosis control) • • Average sero-prevalence estimated to be 16. 2% and elimination of disease would improve fertility rate & calf mortality rates LDPS 2 used to estimate current offtake and potential additional milk and meat resulting from brucellosis control (by system) Assumed values: milk $0. 20/ltr; meat $2. 00/kg Model assumes that cattle population growth rates remain unchanged, i. e. additional animals used for increasing replacement rate and thus offtake A Living from Livestock Pro-Poor Livestock Policy Initiative
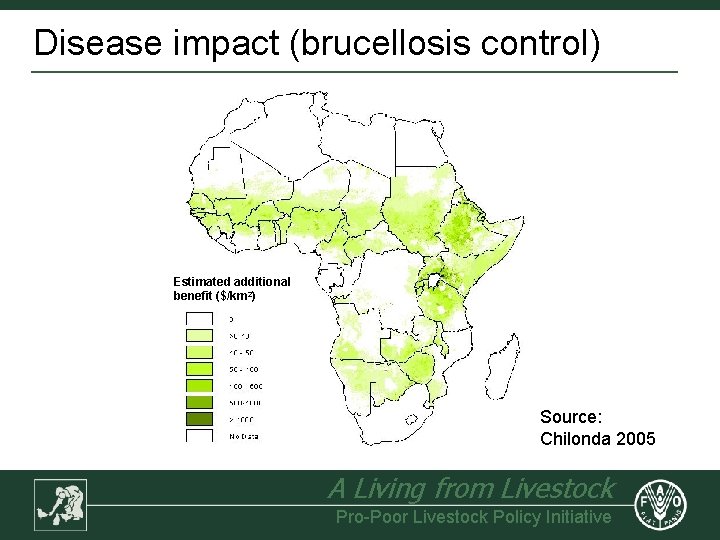
Disease impact (brucellosis control) Estimated additional benefit ($/km 2) Source: Chilonda 2005 A Living from Livestock Pro-Poor Livestock Policy Initiative
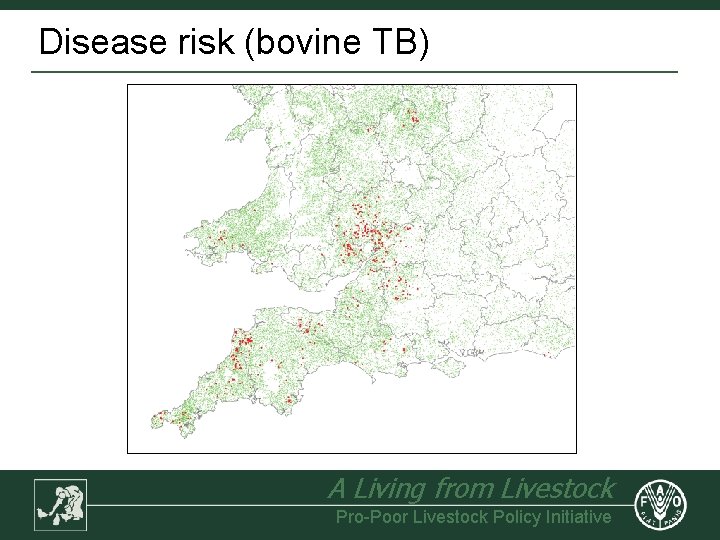
Disease risk (bovine TB) A Living from Livestock Pro-Poor Livestock Policy Initiative
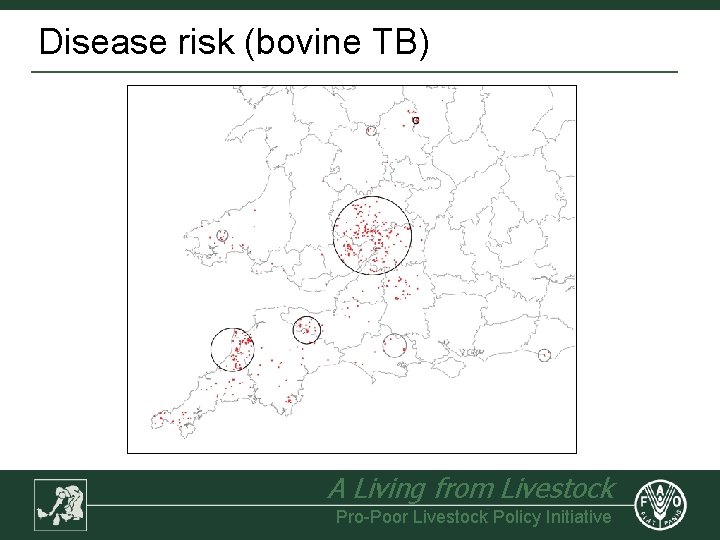
Disease risk (bovine TB) A Living from Livestock Pro-Poor Livestock Policy Initiative
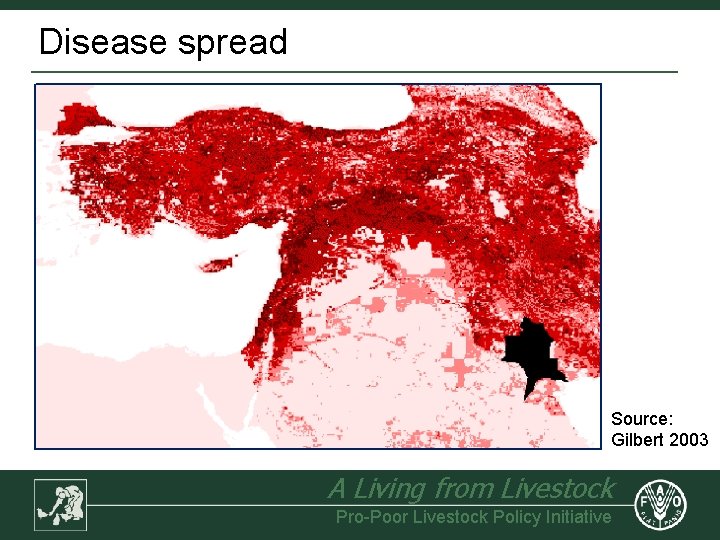
Disease spread Source: Gilbert 2003 A Living from Livestock Pro-Poor Livestock Policy Initiative
A Living from Livestock Pro-Poor Livestock Policy Initiative
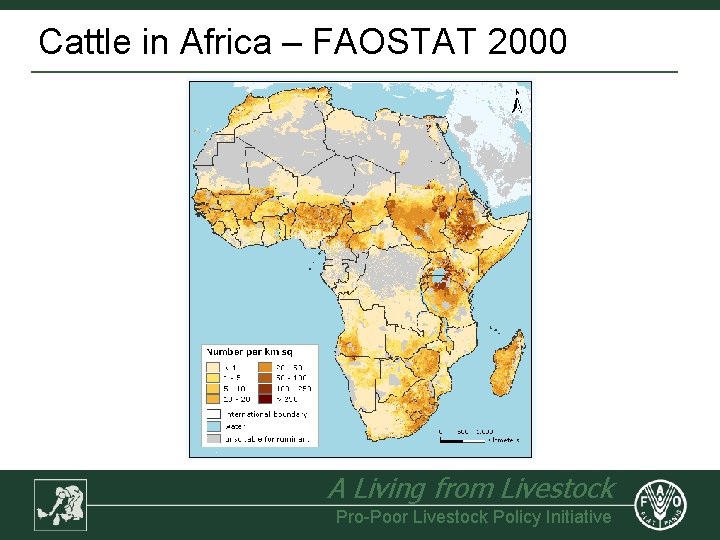
Cattle in Africa – FAOSTAT 2000 A Living from Livestock Pro-Poor Livestock Policy Initiative
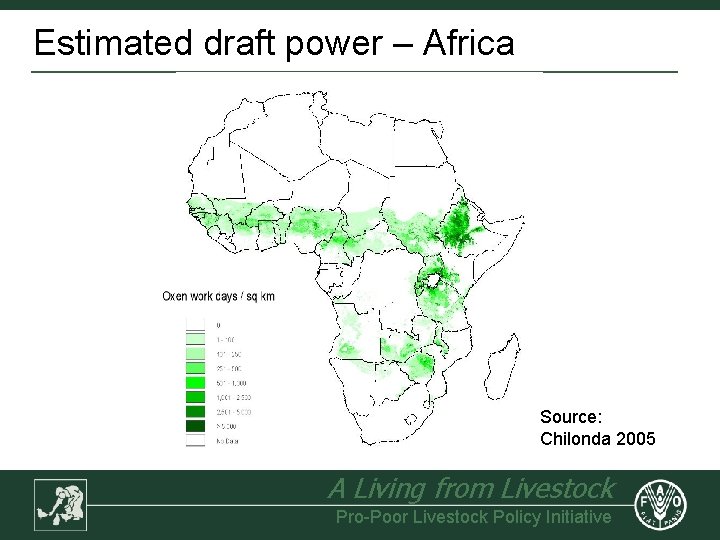
Estimated draft power – Africa Source: Chilonda 2005 A Living from Livestock Pro-Poor Livestock Policy Initiative
Prospects, Aspirations Reports, ad hoc queries A Living from Livestock Pro-Poor Livestock Policy Initiative
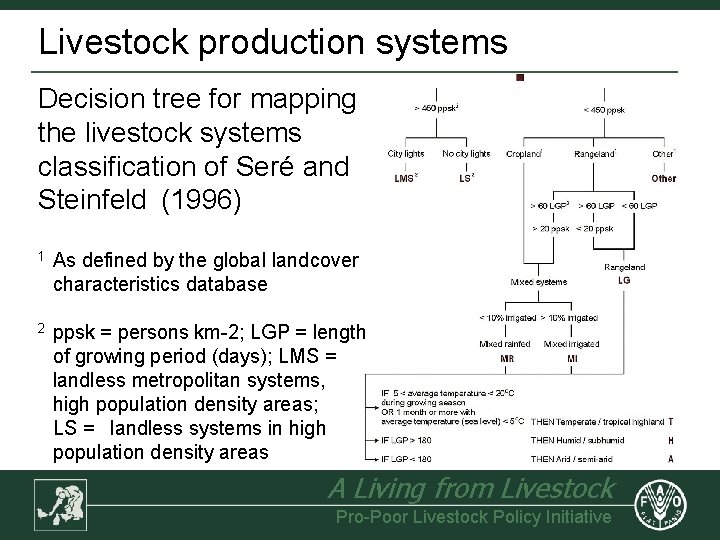
Livestock production systems Decision tree for mapping the livestock systems classification of Seré and Steinfeld (1996) 1 As defined by the global landcover characteristics database 2 ppsk = persons km-2; LGP = length of growing period (days); LMS = landless metropolitan systems, high population density areas; LS = landless systems in high population density areas A Living from Livestock Pro-Poor Livestock Policy Initiative
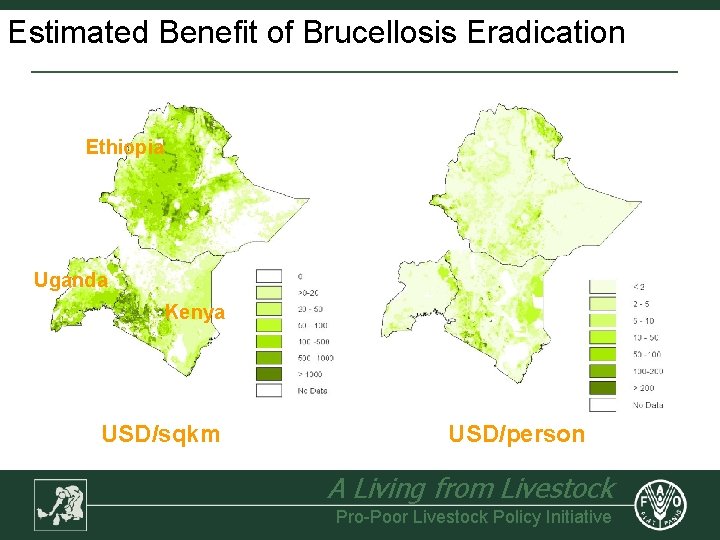
Estimated Benefit of Brucellosis Eradication Ethiopia Uganda Kenya USD/sqkm USD/person A Living from Livestock Pro-Poor Livestock Policy Initiative
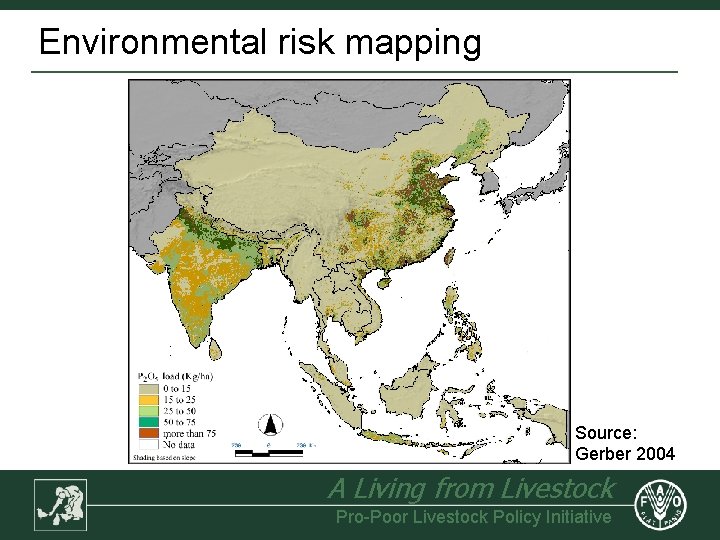
Environmental risk mapping Source: Gerber 2004 A Living from Livestock Pro-Poor Livestock Policy Initiative
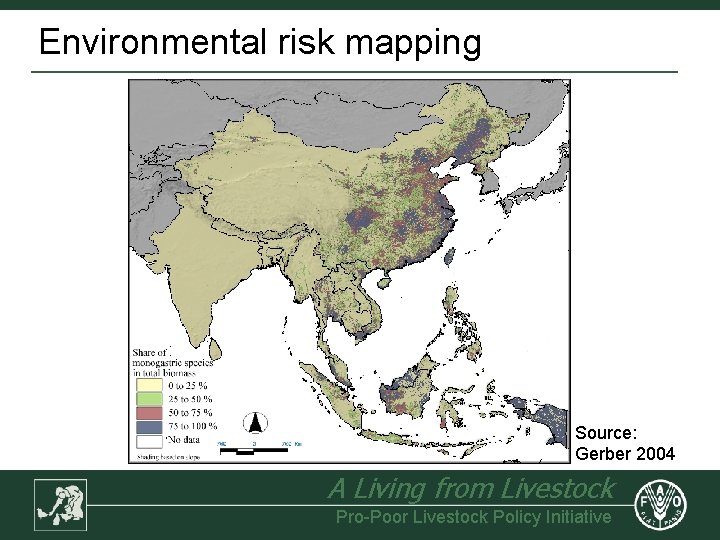
Environmental risk mapping Source: Gerber 2004 A Living from Livestock Pro-Poor Livestock Policy Initiative
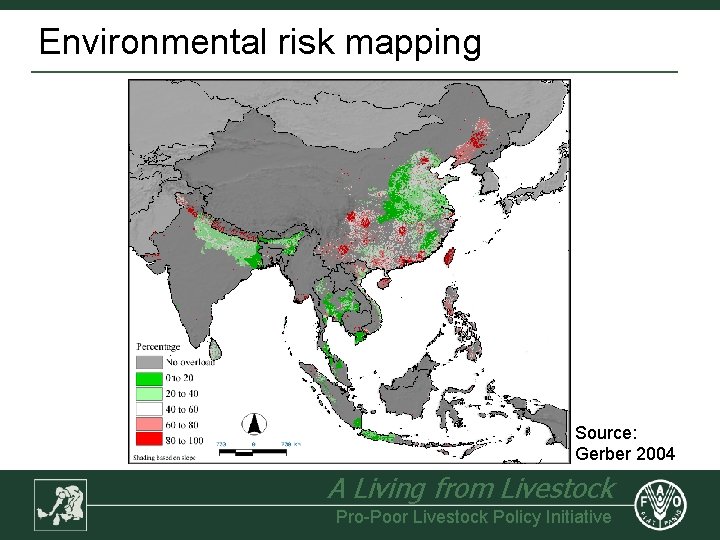
Environmental risk mapping Source: Gerber 2004 A Living from Livestock Pro-Poor Livestock Policy Initiative
- Slides: 38