MATLAB workspace whos who command window clear clear

MATLAB ﻣﺤیﻂ کﺎﺭی ﺩﺭ workspace ﻣﺸﺎﻫﺪﻩ ی ﺍﻃﻼﻋﺎﺕ : whos ﻭ who ﺩﺳﺘﻮﺭﺍﺕ . command window clear ﺩﺳﺘﻮﺭ clear name clc help ﺩﺳﺘﻮﺭ help command helpwin Lookfor keyword
![ﻣﺜﺎﻝ Array=[1 2 3; 4 5 6; 7 8 9; 10 11 12]](http://slidetodoc.com/presentation_image_h/7e222555215d07b70d7d63ba5e0e2d32/image-11.jpg "ﻣﺜﺎﻝ Array=[1 2 3; 4 5 6; 7 8 9; 10 11 12]")
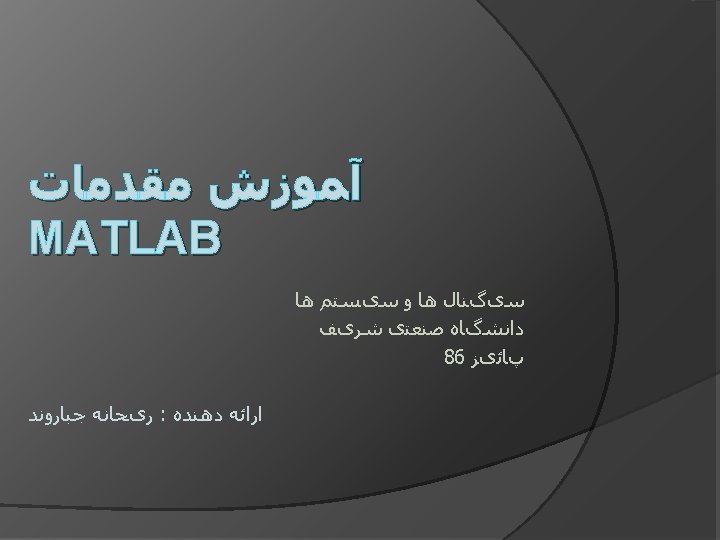
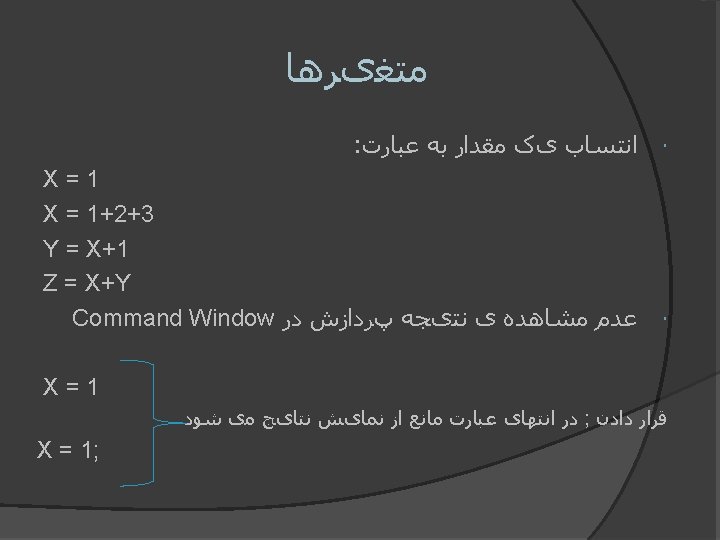
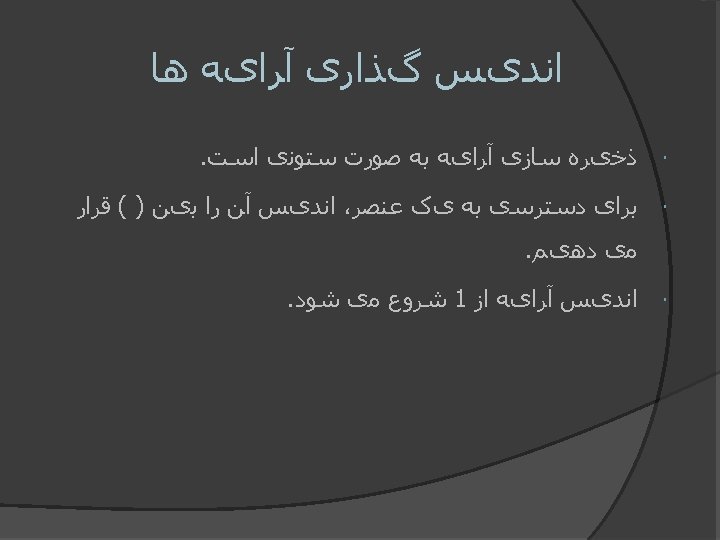
ﻣﺜﺎﻝ Array=[1 2 3; 4 5 6; 7 8 9; 10 11 12] Array = 1 2 3 4 5 6 7 8 9 10 11 12 Array[1] = ? 1 Array[3] = ? 7 Array[? ] = 2 5
 147 Array(2, : ) 456 Array(: , 3) 3")
ﺩﺳﺘیﺎﺑی ﺑﻠﻮکی Array(1: 3) 147 Array(2, : ) 456 Array(: , 3) 3 6 9 12 Array(: , : ) = ? Array = 1 2 3 4 5 6 7 8 9 10 11 12

ﺩﺳﺘﻮﺭﻫﺎی ﻣﻔیﺪ Array = start : end Array = 1: 6 1 2 3 4 5 6 Array = start : increment : end Array = 1: 2: 6 1 3 5 Length(Array) 4 Size(Array) 4 3 Linespace(start , end , number) Linespace(1, 10, 5) 1 3. 25 5 7. 75 آﺮﺍیﻪ ﻫﺎی ﺗک ﺑﻌﺪی آﺮﺍیﻪ ﻫﺎی چﻨﺪ ﺑﻌﺪی 10
 Zeros(3) - Ones(n) Ones(3) 0 0 0 0 0")
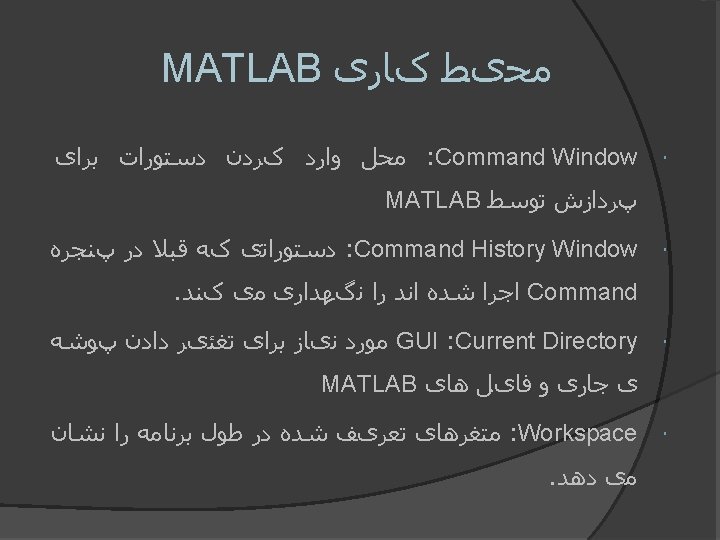
ﺩﺳﺘﻮﺭﻫﺎی ﻣﻔیﺪ - Zeros(n) Zeros(3) - Ones(n) Ones(3) 0 0 0 0 0 - Zeros(m, n) Zeros(2, 3) 1 1 1 1 - Ones(m, n) Ones(2, 3) 0 0 0
![ﺗﺮﺍﻧﻬﺎﺩﻩ Array=[1 2 3; 4 5 6; 7 8 9; 10 11 12]](http://slidetodoc.com/presentation_image_h/7e222555215d07b70d7d63ba5e0e2d32/image-15.jpg "ﺗﺮﺍﻧﻬﺎﺩﻩ Array=[1 2 3; 4 5 6; 7 8 9; 10 11 12]")
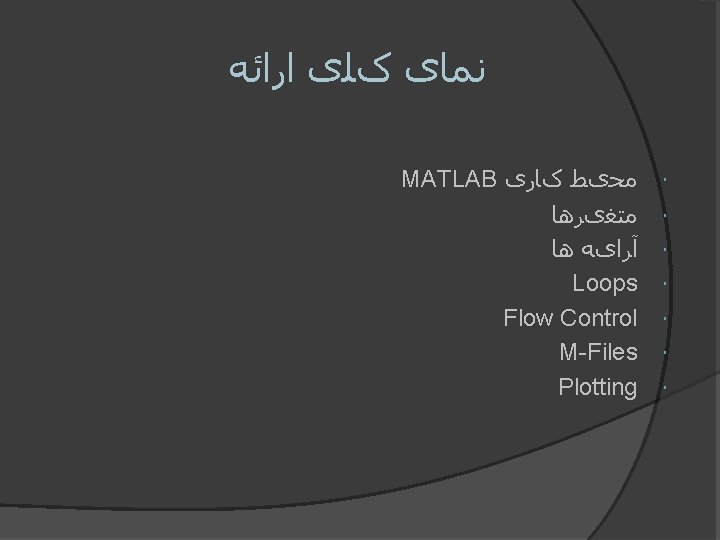
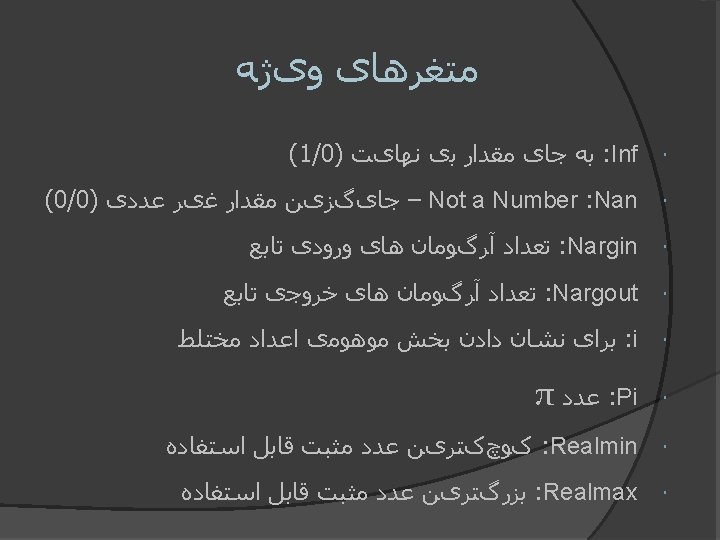
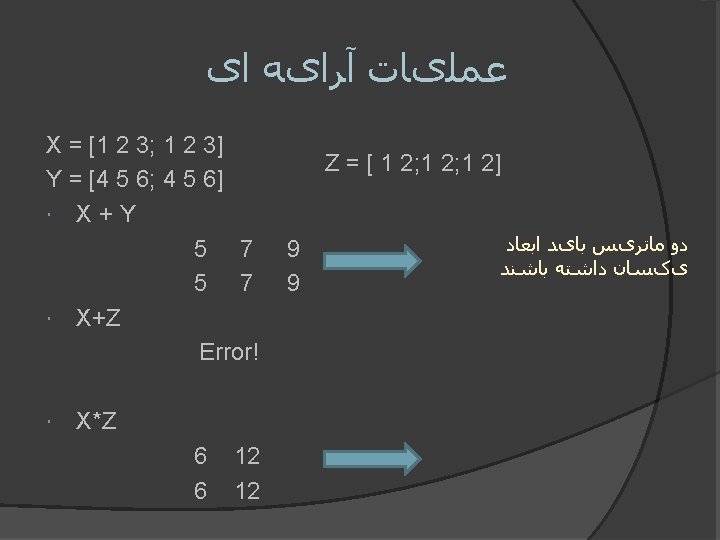
ﺗﺮﺍﻧﻬﺎﺩﻩ Array=[1 2 3; 4 5 6; 7 8 9; 10 11 12] Array = 1 2 3 4 5 6 7 8 9 10 11 12 Array’ 1 4 7 10 2 5 8 11 3 6 9 12

Loops For variable = expression Commands end Y=0; for x = 1: 10 y=y+1; end Y = 10
 x=x-1; y=y+1; end Y=")
loops While expression command end Y=0; X=10; while (x~= 0) x=x-1; y=y+1; end Y= 10;

Flow Control If logical expression command elseif logical command else command end

Flow Control Switch expression case test expression 1 command case test expression 2 command … otherwise command end
; Y= sin(X); Plot(X, Y); Z= cos(X); Plot(X, Y, X,")
Plot X= linspace(0, 2*pi, 40); Y= sin(X); Plot(X, Y); Z= cos(X); Plot(X, Y, X, Z);
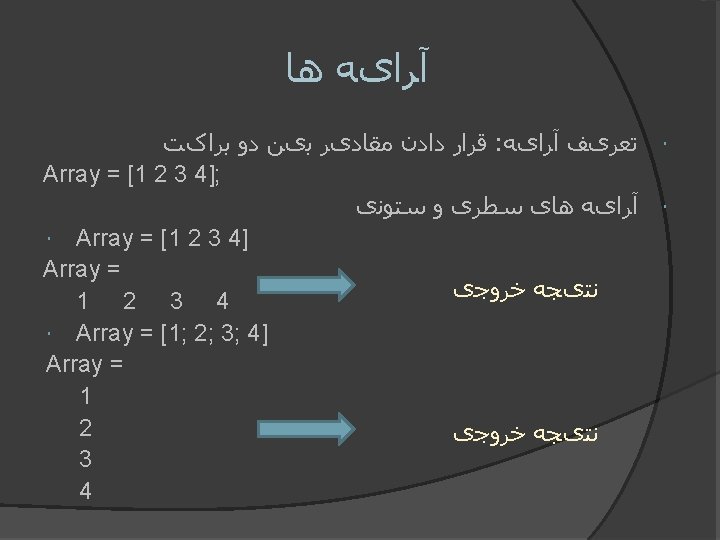
![Plot(con’t) Axis([xmin xmax ymin ymax]); X= linspace(0, 2*pi, 40); Y= sin(X); Plot(X, Y); axis[(0](http://slidetodoc.com/presentation_image_h/7e222555215d07b70d7d63ba5e0e2d32/image-25.jpg "Plot(con’t) Axis([xmin xmax ymin ymax]); X= linspace(0, 2*pi, 40); Y= sin(X); Plot(X, Y); axis[(0")
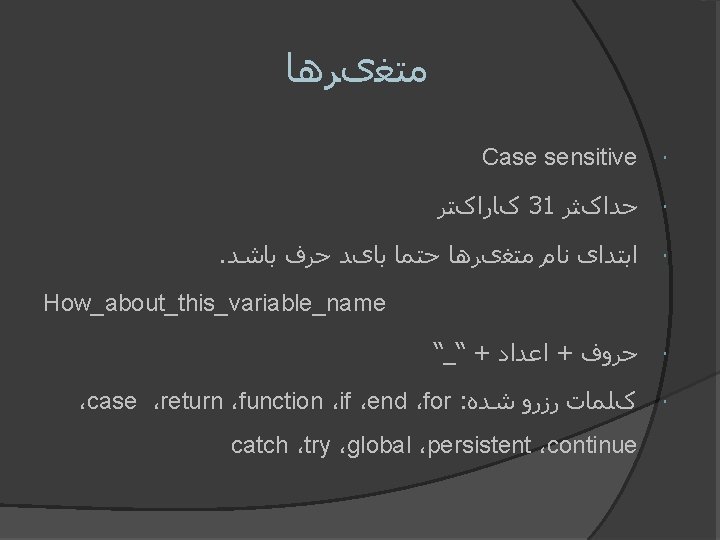
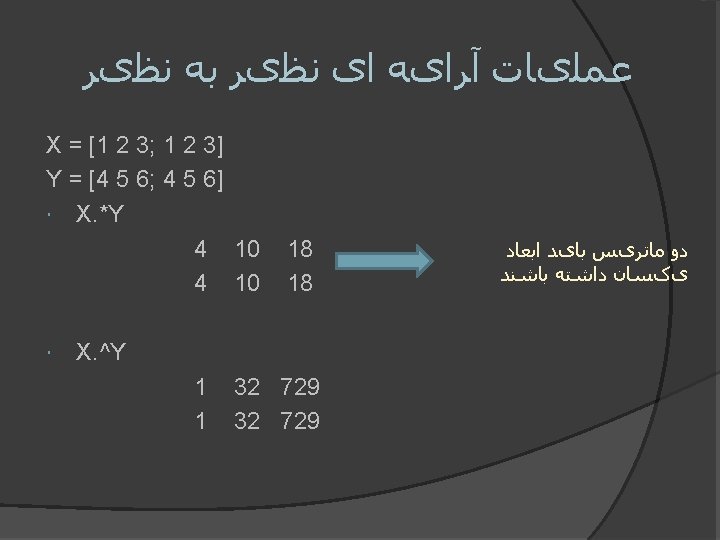
Plot(con’t) Axis([xmin xmax ymin ymax]); X= linspace(0, 2*pi, 40); Y= sin(X); Plot(X, Y); axis[(0 2*pi -1 1]);
 ﺩﺳﺘﻮﺭﺍﺗی ﺟﻬﺖ ﺗکﻤیﻞ ﻧﻤﻮﺩﺍﺭﻫﺎ Xlable(‘statement’); Ylable(‘statement’); Title(‘statement’); Text(variables , statements); Legend(‘statement’ , ’statement’,")
Plot(con’t) ﺩﺳﺘﻮﺭﺍﺗی ﺟﻬﺖ ﺗکﻤیﻞ ﻧﻤﻮﺩﺍﺭﻫﺎ Xlable(‘statement’); Ylable(‘statement’); Title(‘statement’); Text(variables , statements); Legend(‘statement’ , ’statement’, …); Hold on Hold off Figure Close Grid
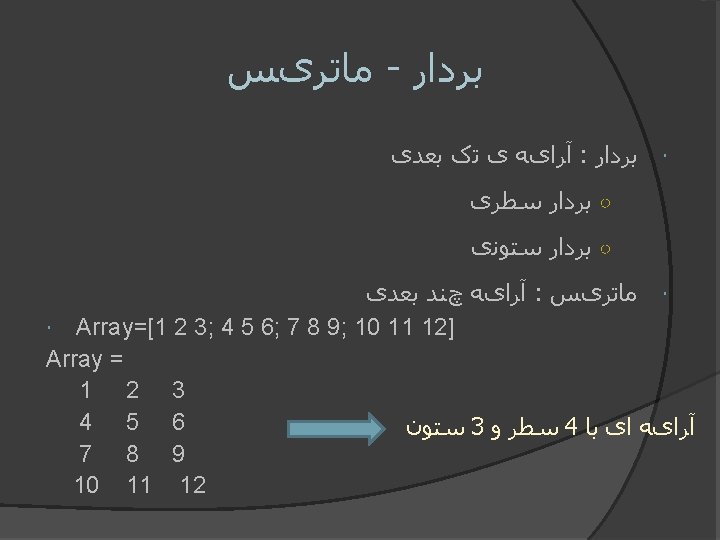
 Subplot(a, b, c); ﻣﺜﺎﻝ X= linspace(0, 2*pi, 40); Y= sin(X); Z= cos(X); W=")
Plot(con’t) Subplot(a, b, c); ﻣﺜﺎﻝ X= linspace(0, 2*pi, 40); Y= sin(X); Z= cos(X); W= 2*sin(X). *cos(X); Subplot(2, 2, 1); Plot(X, Y); Subplot(2, 2, 2); Plot(X, Z); Subplot(2, 2, 3); Plot(X, W);


- Slides: 29