Main Clustering Algorithms KMeans Hierarchical SOM KMeans Mac


 = <C, D> Problem: Would like:")
 = <F(X), F(Y)>, where,")
 = (<X, Y> + 1) §")
>Di) (1) § Convergence: T")
, N(Fk-1)>")
 , where ai*= lim {ain=(1/m)Sajn-1 K(Di , Dj)} for n")


- Slides: 43
Main Clustering Algorithms § K-Means § Hierarchical § SOM
K-Means § Mac. Queen, 1967 § clusters defined by means/centroids § Many clustering algorithms are derivatives of KMeans § Widespread use in industry and academia, despite it’s many problems
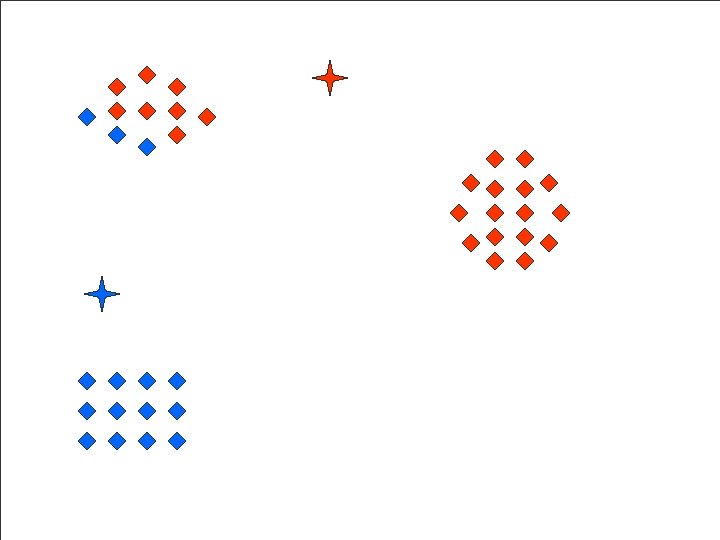
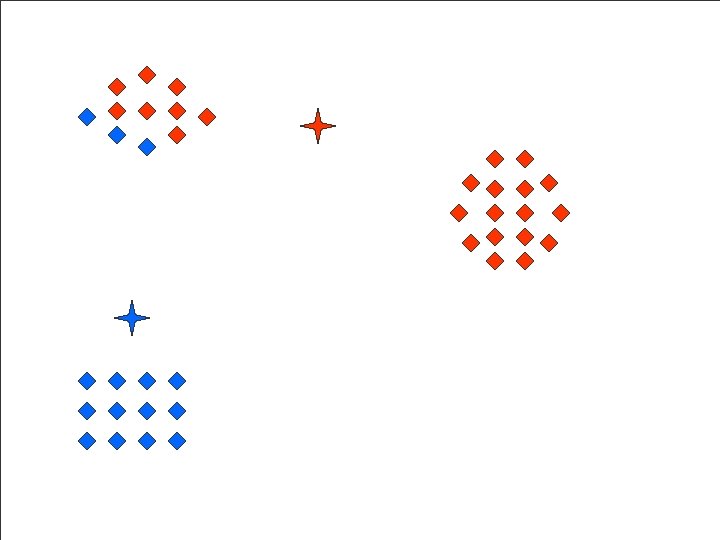
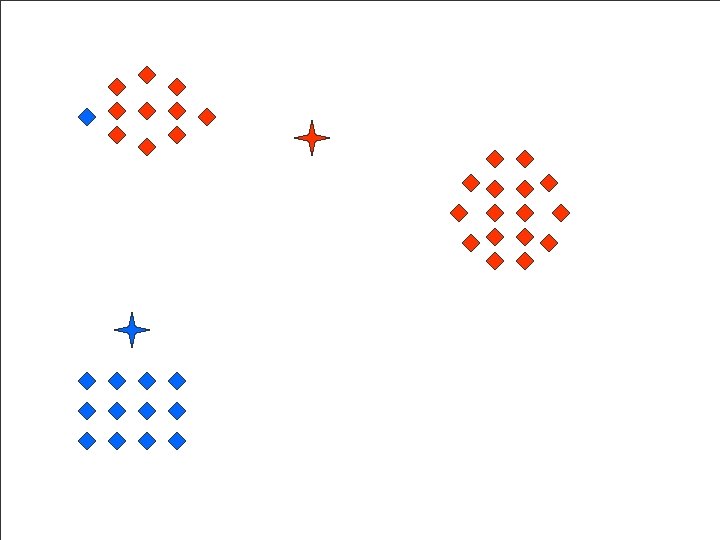
K-Means Example
Hierarchical Clustering § Starts by assuming each point as a cluster § Iteratively links most similar pair of clusters § User-defined threshold parameter specifies the output clusters
Hierarchical Clustering Variants © In Minitab Linkage Methods Distance Measures § § § Average Centroid Complete Mc. Quitty Median Single Ward Euclidean Manhattan Pearson Squared Euclidean Squared Pearson
Hierarchical Clustering Example
Results
Still There are Problems
Clustering Documents “bag of words” W 1 W 2 W 3. . Wi. . . Wj. . Wn D 1: f 11 f 21 f 31. . fi 1. . . fj 1. . fn 1 D 2: f 12 f 22 f 32. . fi 2. . . fj 2. . fn 2 Dm : f 1 m f 2 m f 3 m. . fim. . . fjm. . fnm § Di: vector of length l § Distance between Di and Dj: <Di, Dj> M
Cluster Centroid § Cluster defined by distance to centroid: C C = 1/m SDi, where m is the # of vectors
Elevations Elevation of D: El(D) = <C, D> Problem: Would like:
Mapping to higher Dimension § Utilizing Kernel Function K(X, Y) = <F(X), F(Y)>, where, X, Y are vectors in Rn, and F is a mapping into Rd, d >> n § Key element in Support Vector Machines § Data needs to appear as Dot Product only: <Di, Dj>
Kernel Function Examples § Polynomial: n K(X, Y) = (<X, Y> + 1) § Feedforward Neural Network Classifier K(X, Y) = tanh(β<X, Y> + b) § Radial Basis K(X, Y) = e-<X, Y>^2/2 s^2
First Step: Penalizing Outliers § Ck = 1/m S(<Di, N(Ck-1)>Di) (1) § Convergence: T l C¥ = Principal Eigenvector of M M, where M is the matrix of Di’s T L l C¥ = lim L ¥(M M) U (2) § Both (1) and (2) are efficient methods of computing C¥
Using Kernels to replace F § Cannot with: l Fk = 1/m S(<F(Di), N(Fk-1)> F(Di)) § Or by using (2): l M= F(D 1) MTM has unmanageable F(D 2) (eventually infinite) dimension. . § So instead we use aik = <F(Di), N(Fk-1)> = (1/m)S(ajk-1<F(Di), F(Dj)>) (3)
Theorem F = Sai*F(Di) , where ai*= lim {ain=(1/m)Sajn-1 K(Di , Dj)} for n ¥ § El(D): Elevation of vector D = Sai*K(Di , D)
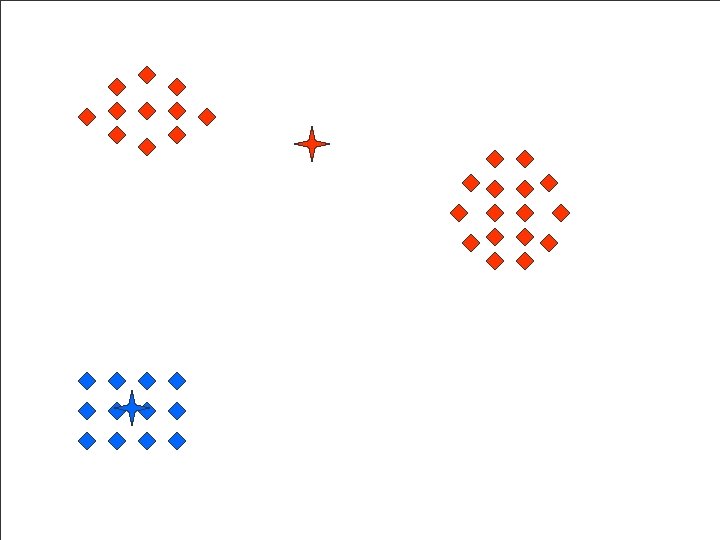
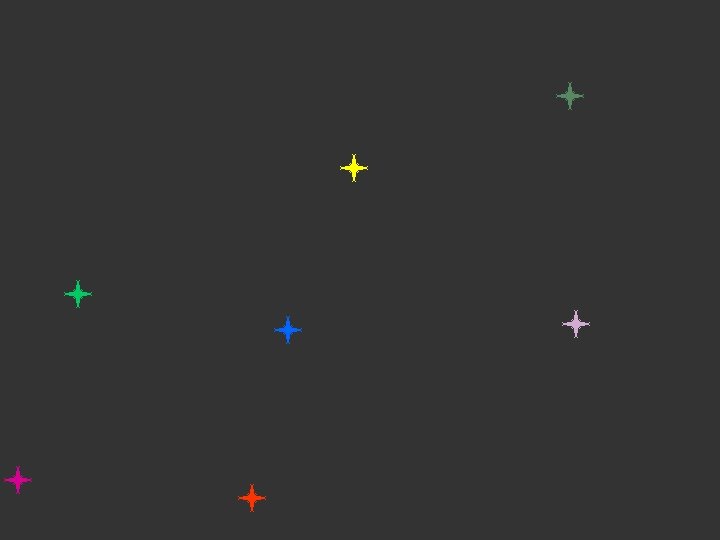
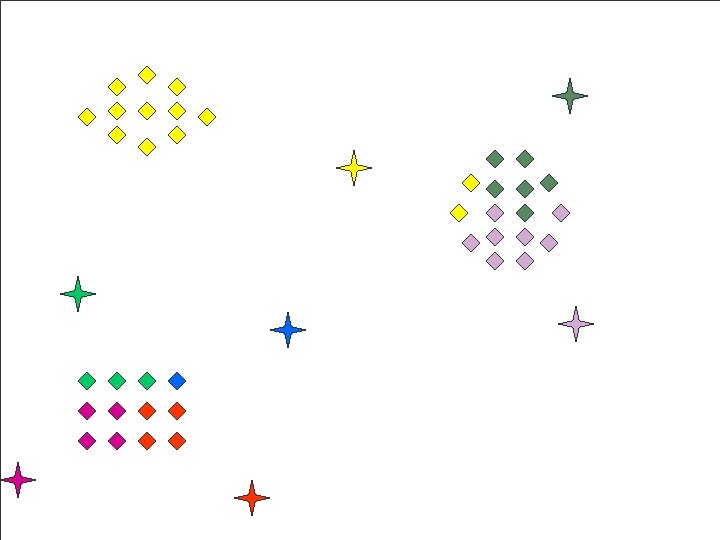
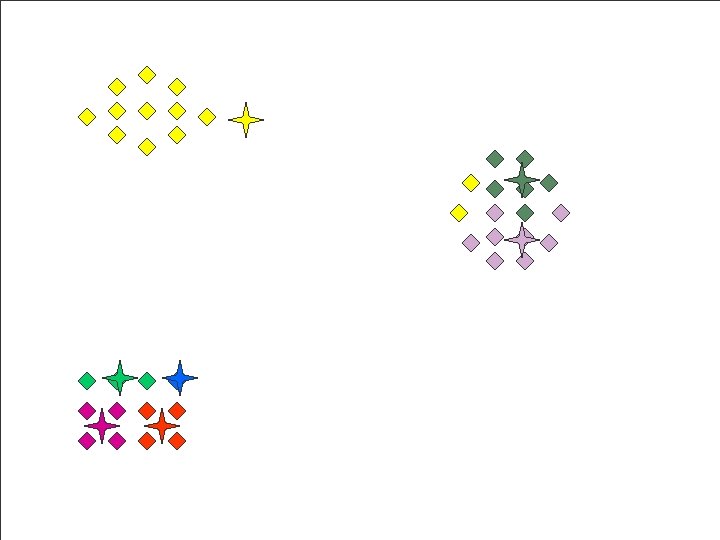
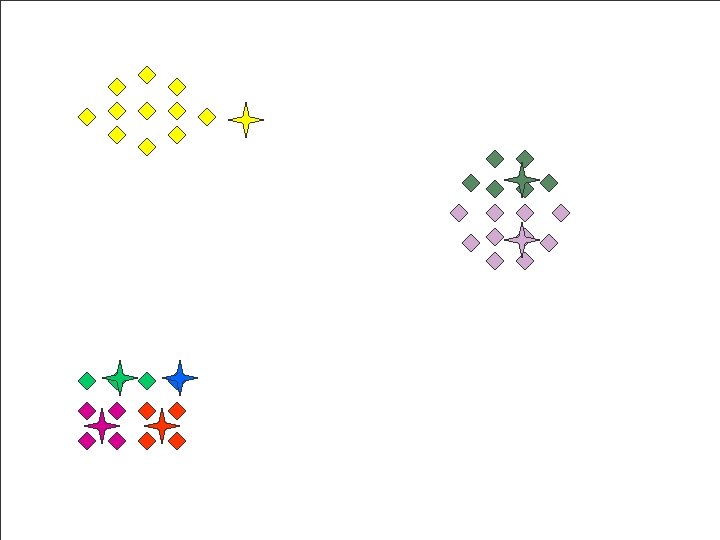
Zoomed Clusters § Clusters defined through peaks l Peaks: all vectors, which are the highest in their vicinity: PEAKS = {Dj | El(Dj) ³ (El(Di)<Di, Dj>S) for all i} § S: Sharpening/Smoothing Parameter § Cluster: Set of vectors, which are in the vicinity of a peak
Clustering Example
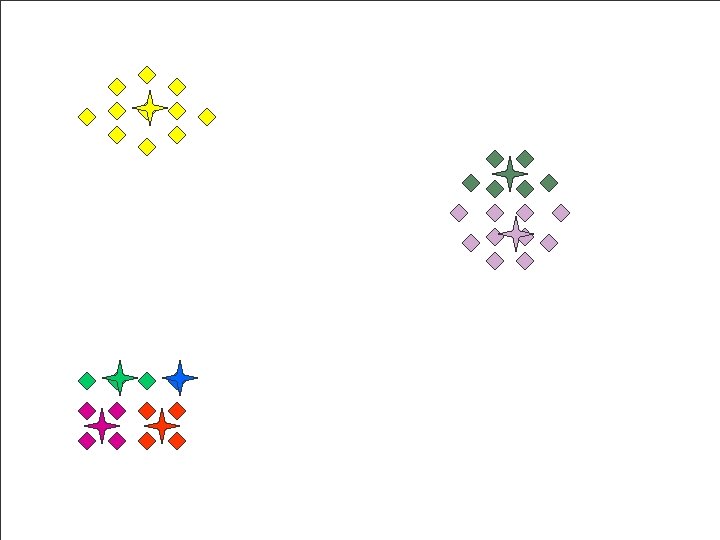
Zooming Example
Zoomed Clusters Results Default
Clustering Micro. Array Data Experiments Expression Level of Gene i during Experiment j Genes
Micro. Arrays As Time Series
Clustering Time Series § Reveals groups of genes, which have similar reactions to experiments § Functionally related genes should cluster
Simulated Time Series § Simulated 180 Time Series, with 3 clusters and 9 sub-clusters (20 per sub-cluster) § Each time series is a vector with 1000 components l Each component is expression level at a given time
Results Kernel: Polynomial Degree 36 S: 7615
HMM Parameter Estimation Baum-Welch Algorithm Initial HMM Model Refinement of HMM Model Viterbi Algorithm Sequential K -Means Final HMM Model Refinement of HMM Model Final HMM Model
Parameter Estimation with Zoomed Clusters Initial HMM Model Advantages: • Flexibility with number of states • Initial Model is closer to the final one Consequences: • Higher accuracy and faster convergence for either Baum-Welch or Viterbi
Example: Coins Coin 1: 100% Heads Coin 1: 100% Tails Coin 3: 50% Tails 50% Heads HHHHHTTTTTTTHHHHHHHTHTHTTTTTTTT • Regions with similar statistical distribution of Heads and Tails represent the states in the initial HMM Model • Use Elevation Functions, separately for Heads and Tails to represent these distributions
2, Step 3: Create point D in R ipoints Step 4: Cluster all the Step 3: 2: For Calculating 3: Get each the position Elevation in the whose components are the obtained from each position Step 1: Separating Letters Function sequence for of Heads each throws and letter … Tails elevations HHHHHHH H H Position i TTTTTTT Point Di = [Eh, Et] T T TTTTTTTT
What Clustering Achieves § Each cluster defines regions of similar distributions of heads and tails § Each Cluster is a state in the initial HMM model § State transition/emission probabilities, are estimated from the clusters
References § Mac. Queen, J. 1967. Some methods for classification and analysis of multivariate observations. Pp. 281 -297 in: L. M. Le Cam & J. Neyman [eds. ] Proceedings of the fifth Berkeley symposium on mathematical statistics and probability, Vol. 1. University of California Press, Berkeley. xvii + 666 p. § Jain, A. K. , Murty, M. N. , and Flynn, P. J. Data Clustering: A Review. ACM Computing Surveys, Vol. 31, No. 3, September 1999 § http: //www. gene-chips. com/ by Leming Shi, Ph. D.