Supervised and Unsupervised learning http dataaspirant com20140919supervisedandunsupervisedlearning Supervised


 q ) vs Classification and Clustering are")


 Clustering • Agglomerative - \"Bottom up approach” assume all members")


 Problem - Cluster these data")

 Manhattan distance: ||a-b||1 = Σ|ai-bi| (4) Maximum distance: ||a-b||INFINITY =")


- Slides: 19
Supervised and Unsupervised learning http: //dataaspirant. com/2014/09/19/supervised-and-unsupervisedlearning/
Supervised and Unsupervised learning Supervised learning is a data mining task of inferring a function from labeled training data. The training data consist of a set of training examples. Supervised learning is a data mining task of inferring a function from labeled training data. The training data consist of a set of training examples. Supervised learning: Learning from the know label data to create a model then predicting target class for the given input data. Unsupervised learning: Learning from the unlabeled data to differentiating the given input data Real-Life EXAMPLE Task to arrange collection of fruits Supervised Learning: • From previous work we know the physical characters of fruits • In data mining terminology the earlier work is called as training the data. You already learn the things • from your train data. This is because of response variable which is a decision variable No. SIZE COLOR SHAPE FRUIT NAME (response variable) 1 Big Red Rounded shape with depression at the top Apple 2 Small Red Heart-shaped to nearly globular Cherry 3 Big Green Long curving cylinder Banana 4 Small Green Round to oval, Bunch shape Cylindrical Grape
Supervised Learning Algorithms: All classification and regression algorithms come under supervised learning. Logistic Regression Decision trees Support vector machine (SVM) k-Nearest Neighbours Naive Bayes Random forest Linear regression polynomial regression SVM for regression
Unsupervised Learning: This time, you don’t know anything about the fruits, this is the first time you have seen them. as You have no clue about those. You will take a fruit and you will arrange them by considering the physical character of that particular fruit. Suppose you have considered color. Then the groups will be something like this. RED COLOR GROUP: apples & cherry fruits. GREEN COLOR GROUP: bananas & grapes. So now you will take another physical character such as size. RED COLOR AND BIG SIZE: apple. RED COLOR AND SMALL SIZE: cherry fruits. GREEN COLOR AND BIG SIZE: bananas. GREEN COLOR AND SMALL SIZE: grapes. The job has done, . Here you did not learn anything before , means no train data and no response variable. In data mining or machine learning, this kind of learning is known as unsupervised learning.
Unsupervised learning algorithms: All clustering algorithms come under unsupervised learning algorithms. q q q K – means clustering Hierarchical clustering Hidden Markov models
Classification (वरग करण clustering (समह करण ) q ) vs Classification and Clustering are the two types of learning methods which characterize objects into groups by one or more features. BASIS FOR COMPARIS ON Basic Involved in Training sample CLASSIFICATION CLUSTERING This model function classifies the data into one of numerous already defined definite classes. This function maps the data into one of the multiple clusters where the arrangement of data items is relies on the similarities between them. Supervised learning Unsupervised learning Labeled data is provided. Unlabelled data provided. Key Differences Between Classification and Clustering 1. Classification is the process of classifying the data with the help of class labels. On the other hand, Clustering is similar to classification but there are no predefined class labels. 2. Classification is geared with supervised learning. As against, clustering is also known as unsupervised learning. 3. Training sample is provided in classification method while in case of clustering training data is not provided.
Types of clustering • https: //www. youtube. com/watch? v=Xvwt 7 y 2 jf 5 E A cluster refers to a collection of data points aggregated together because of certain similarities. K-means - division of objects into clusters such that each object is in exactly one cluster, not several Fuzzy means clustering - division of objects into cluster such that each object belong to multiple cluster
Various types of clustering methods • Clustering: Types • Clustering can be broadly divided into two subgroups: • Hard clustering: in hard clustering, each data object or point either belongs to a cluster • Soft clustering: in soft clustering, a data point can belong to more than one cluster with some probability or likelihood value.
Clustering Algorithms • Clustering algorithms can be categorized into 4 classes • Connectivity-based clustering: the main idea behind this clustering is that data points that are closer in the data space are more related (similar) than to data points farther away. The clusters are formed by connecting data points according to their distance. At different distances, different clusters will form and can be represented using a dendrogram, which gives away why they are also commonly called "hierarchical clustering". These methods do not produce a unique partitioning of the dataset, rather a hierarchy from which the user still needs to choose appropriate clusters by choosing the level where they want to cluster. They are also not very robust towards outliers, which might show up as additional clusters or even cause other clusters to merge. • Centroid-based clustering/Partition clustering: in this type of clustering, clusters are represented by a central vector or a centroid. This centroid might not necessarily be a member of the dataset. This is an iterative clustering algorithms in which the notion of similarity is derived by how close a data point is to the centroid of the cluster. k-means is a centroid based clustering, • Distribution-based clustering: this clustering is very closely related to statistics: distributional modeling. Clustering is based on the notion of how probable is it for a data point to belong to a certain distribution, such as the Gaussian distribution, for example. Data points in a cluster belong to the same distribution. These models have a strong theoritical foundation, however they often suffer from overfitting. Gaussian mixture models, using the Fuzzy C-means , expectation-maximization algorithm is a famous distribution based clustering method. • Density-based methods search the data space for areas of varied density of data points. Clusters are defined as areas of higher density within the data space compared to other regions. Data points in the sparse areas are usually considered to be noise and/or border points. The drawback with these methods is that they expect some kind of density guide or parameters to detect cluster borders. DBSCAN and OPTICS are some prominent density based clustering. [Source of this slide – Datacamp] • Source: https: //www. datacamp. com/community/tutorials/k-means-clustering-r
Hierarchical (शरण बदध ) Clustering • Agglomerative - "Bottom up approach” assume all members as a separate cluster, then merge them in to larger and larger groups form a tree shaped structure (dendrogram) • Divisive - "Top down approach begin with the whole set and proceed to divide
Hierarchical Clustering steps • It starts by calculating the distance between every pair of observation points and store it in a distance matrix. • It then puts every point in its own cluster. • Then it starts merging the closest pairs of points based on the distances from the distance matrix and as a result the amount of clusters goes down by 1. • Then it recomputes the distance between the new cluster and the old ones and stores them in a new distance matrix. • Lastly it repeats steps 2 and 3 until all the clusters are merged into one single cluster. Hands-on exercise: Clustering using genome sequences to be given separately
Centroid-based clustering K-means clustering • Step-1 Initially two centroids are assigned randomly • Step-2: the Euclidean distance is used to find out which centroid is closest to each data point and the data points are assigned to the corresponding centroids. Application: • Step-3 Reposition the two centroids for optimization • Step-4 The process is iteratively repeated till the repositioning of the centroids stops. Same means in two successive steps • cluster these data points – {2, 3, 4, 10 11, 12, 20, 25, 30} • Example K 1={2, 3, 4, 10, 11, 12} mean 7 and k 2={20, 25, 30} mean 25 academic performance, search engine, diagnostic, wireless sensor network
Problem for Centroid-based clustering Characters (Weight in Kg. ) Problem - Cluster these data points – {2, 3, 4, 10 11, 12, 20, 25, 30} using Kmeans clustering. Description: In this exercise, of Gender Taxonomy, we want to group Homo sapiens species into – Male and Female categories based on characters as shown in the opposite figure. Since it is not possible to do hands-on calculations in the classroom with several characters, we have taken just one character – weight. We have following individual species (OTUs) having character (weight in Kg) – {47, 48, 49, 55, 56, 57, 65, 70, 85}. Since hand calculations of such large numbers may take time, to facilitate we have subtracted 45 from each data and our data of OTUs is as follows – {2, 3, 4, 10 11, 12, 20, 25, 30} so that calculations can be performed in short time. Now Cluster and classify these gender based OTUs Answer: K 1={2, 3, 4, 10, 11, 12} mean 7 and k 2={20, 25, 30} mean 25
Various types of Distances Distance measure will determine the similarity between two elements and it will influence the shape of cluster • There are multiple metrics for deciding the closeness of two clusters • (1) Euclidean distance (d) and • (2) Euclidean square distance (d 2)
• • (3) Manhattan distance: ||a-b||1 = Σ|ai-bi| (4) Maximum distance: ||a-b||INFINITY = maxi|ai-bi| (5) Mahalanobis distance: √((a-b)T S-1 (-b)) {where, s : covariance matrix} (6) Cosine distance
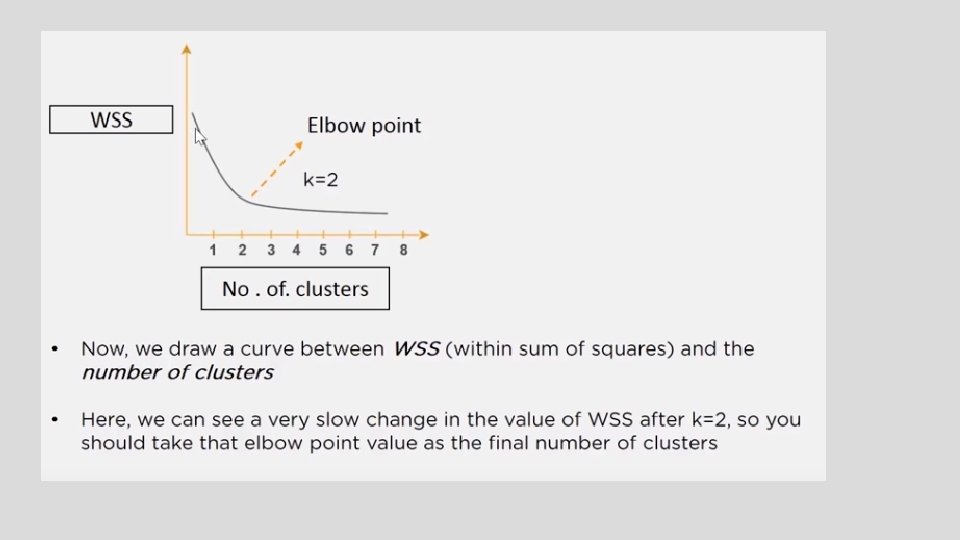
How do we find the optimum number of clusters? • One of the most common method is - Elbow method
Leisure reading: Various approaches of finding optimum clusters • 1. Cross Validation: It’s a commonly used method for determining k value. It divides the data into X parts. Then, it trains the model on X-1 parts and validates (test) the model on the remaining part. • The model is validated by checking the value of the sum of squared distance to the centroid. This final value is calculated by averaging over X clusters. Practically, for different values of k, we perform cross validation and then choose the value which returns the lowest error. • 2. Elbow Method: This method calculates the best k value by considering the percentage of variance explained by each cluster. It results in a plot similar to PCA’s scree plot. In fact, the logic behind selecting the best cluster value is the same as PCA. • In PCA, we select the number of components such that they explain the maximum variance in the data. Similarly, in the plot generated by the elbow method, we select the value of k such that percentage of variance explained is maximum. • 3. Silhouette Method: It returns a value between -1 and 1 based on the similarity of an observation with its own cluster. Similarly, the observation is also compared with other clusters to derive at the similarity score. High value indicates high match, and vice versa. We can use any distance metric (explained above) to calculate the silhouette score. • 4. X means Clustering: This method is a modification of the k means technique. In simple words, it starts from k = 1 and continues to divide the set of observations into clusters until the best split is found or the stopping criterion is reached. But, how does it find the best split ? It uses the Bayesian information criterion to decide the best split.
Leisure reading and hands-on exercise resource • TYPES OF CLUSTERING METHODS: OVERVIEW AND QUICK START R CODE • https: //www. datanovia. com/en/blog/types-of-clustering-methodsoverview-and-quick-start-r-code/