Introduction to Earth Science Prologue INTRODUCTION TO EARTH


 meteorology 2) astronomy 3) geology 4) oceanography")


")

 The graph should be as simple and easy to")
 On each axis, equal intervals must represent equal changes")
 Time is always plotted on the “x” (horizontal) axis")
 When possible, make best fit line(s)")
 Fit the graph to the paper. Make it large")
 Label each axis with quantity and units")
 The graph should make sense.")


- Slides: 66
Introduction to Earth Science Prologue
INTRODUCTION TO EARTH SCIENCE Earth science-study of Earth’s systems Includes:
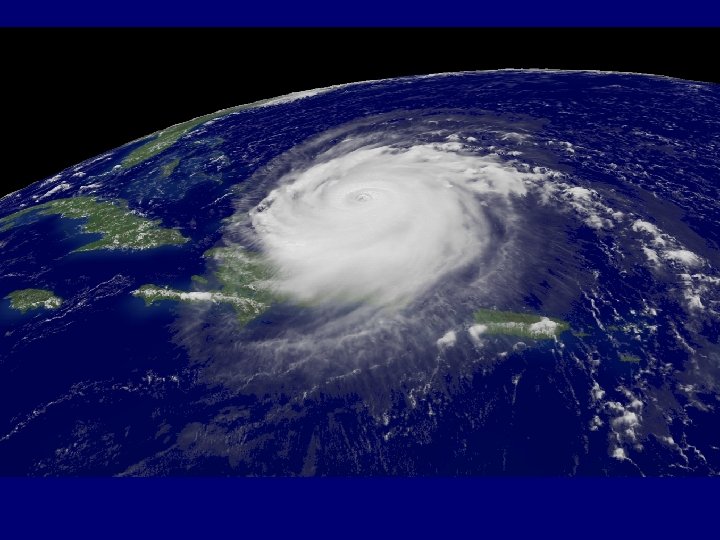
Includes: -meteorology
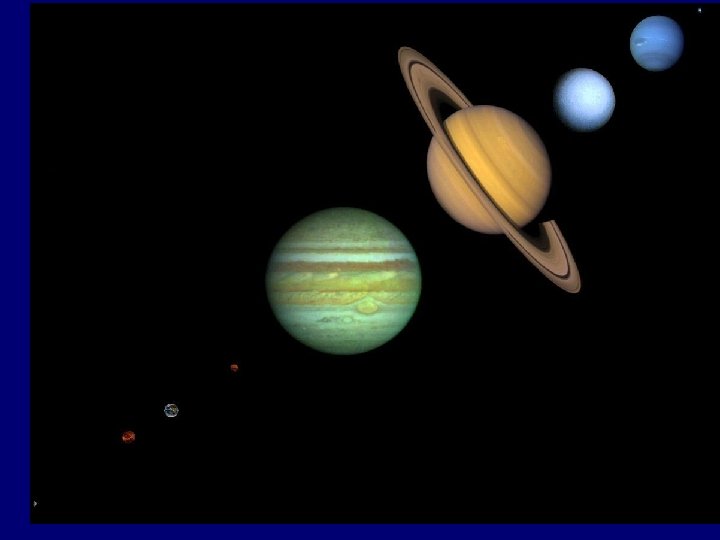
Includes: -meteorology -astronomy
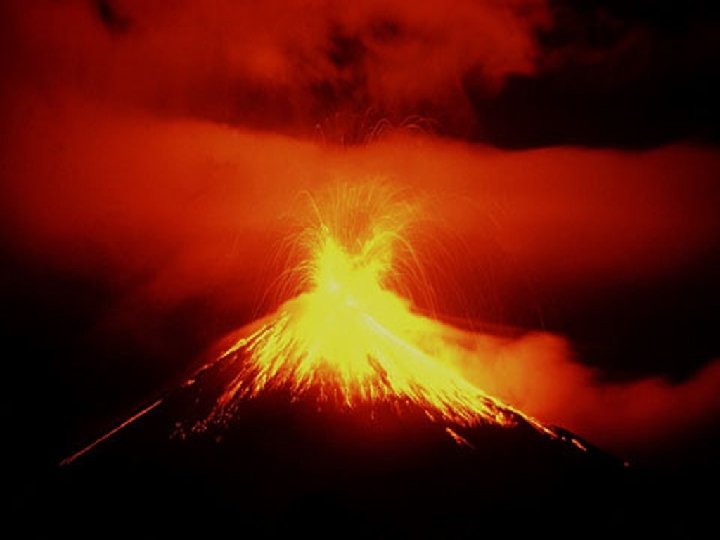
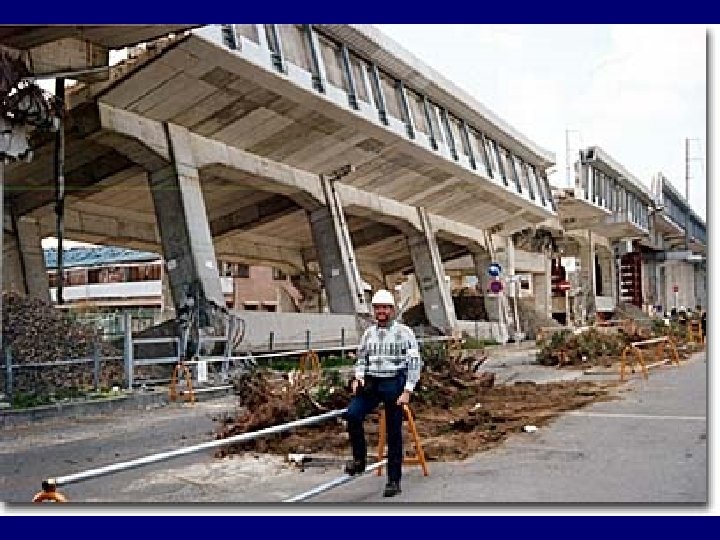
Includes: -meteorology -astronomy -geology
Includes: 1) meteorology 2) astronomy 3) geology 4) oceanography
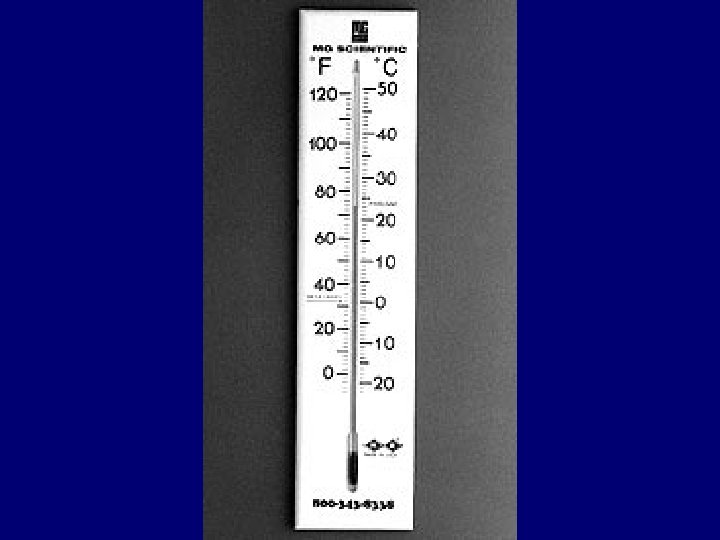
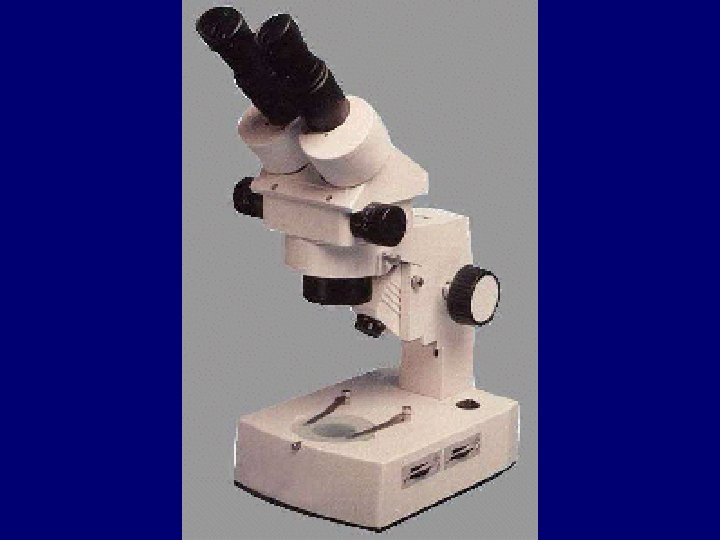
OBSERVATION-Use senses for information -We use INSTRUMENTS to extend the senses
OBSERVATION-Use senses for information -We use INSTRUMENTS to extend the senses INFERENCE-make a conclusion (guess) -making sense of observations
CLASSIFICATION-arranging into groups -helps organize information
Scientific notation- “shorthand” for numbers Example: - 3. 0 x 103 = - 3. 0 x (10 x 10) = 3000
Do now: 3. 5 x 103 = _______ 8. 6 x 105 =________ 7. 4 x 102 =________
80, 000 = 8 x 10⁴ 9500= 520, 000 = 42, 000, 000=
PERCENT ERROR-how wrong you are
? Accepted value = correct answer Measured value = your guess Temperature? Accepted value - measured value PCT ERROR = ----------------------- x 100% accepted value
? Temperature? Accepted value - measured value PCT ERROR = ----------------------- x 100% accepted value
There are 495 jellybeans. Accepted value - measured value PCT ERROR = ----------------------- x 100% accepted value
Practice: A student measures a table to be 1. 9 m long. In reality it is 2. 0 m long. What is the percent error of the student? 2. 0 – 1. 9 X 100 = 5% 2. 0
A student measures a room to be 6. 9 m. If the actual length is 7. 5 m, the student’s percent error is? 7. 5 – 6. 9 X 100 = 8% 7. 5
A student determines the volume of a cube to be 8. 6 cm 3. The correct volume is really 8. 0 cm 3. What is the student’s percent error? 8. 6 – 8. 0 X 100 = 7. 5% 8. 0
Graphs A visual way to present data Types of graphs: -line graphs
Types of graphs: -line graphs Uses coordinates (x and y axis)
Types of graphs: -line graphs direct relationship indirect or inverse relationship cyclic relationship
Rules for making graphs: 1) The graph should be as simple and easy to read as possible.
Rules for making graphs: 2) On each axis, equal intervals must represent equal changes
Rules for making graphs: 3) Time is always plotted on the “x” (horizontal) axis
Rules for making graphs: 4) When possible, make best fit line(s)
Rules for making graphs: 5) Fit the graph to the paper. Make it large enough to fit most of the paper.
Rules for making graphs: 6) Label each axis with quantity and units
Rules for making graphs: 7) The graph should make sense.
Can you find the error in this graph? Should be a line graph
Line should not start at zero Neither axis is labeled with units
Labels on axis switched
Graph does not fit line Vertical axis does not increase evenly
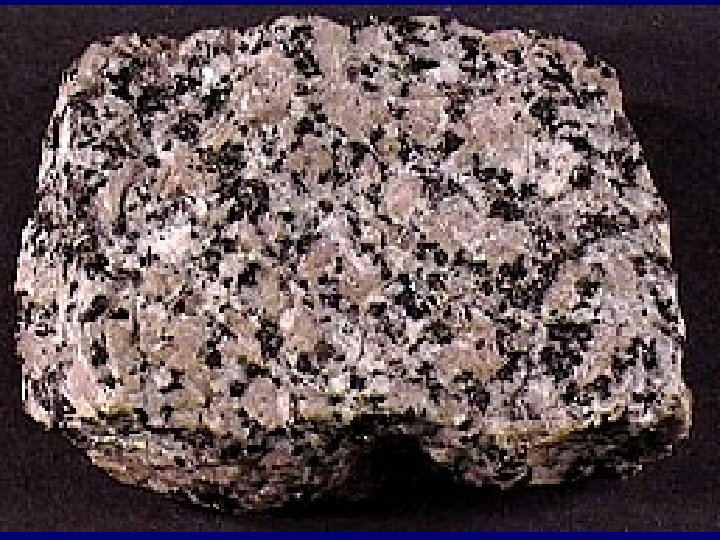
DENSITY
Density-how “heavy” an object is compared to an object of the same size mass Density = ---------volume units for mass = g units for volume = cm 3 or ml units for density = g/cm 3 or g/ml
example: volume of cube = 40 cm 3 mass of cube = 70 g density = ?
But…What if you cut the cube in half? Do now: volume = 40 cm 3 20 cm 3 mass = 70 g 35 g density = ________ **the density of an object doesn’t change**
Example #2: volume of rectangle = _____ mass of rectangle = 100 g density = ? 4 cm 3 cm Volume = length x width x height 2 cm
Which is more dense?
Which is more dense?
Which is more dense?
Which is more dense?
Which is more dense?
Average densities: -water = 1 g/cm 3 at 4 o C *** below 4 o. C the density of water decreases. Above 4 o. C, the density of water increases -Ice 0. 5 g/cm 3 -Earth = 5. 5 g/cm 3 -Saturn = 0. 7 g/cm 3 -human = ?
rate of change-How fast something changes change in value rate of change = -----------change in time
example: From 3: 00 pm to 6: 00 pm the air temperature falls from 85 o. F to 79 o. F. What is the rate of change for temperature during this time? Rate of change =
Do now: In 60 years, the shoreline at Rye Beach has shrunk by 30 inches. What is the rate of change for the shoreline?
Some changes are cyclic. Examples: