DPT Relative Humidity Charts Handy Dandy Earth Science


- Slides: 19

DPT & Relative Humidity Charts Handy Dandy Earth Science Reference Tables Page 12

The “Dry Bulb” n Don’t let it fool you. It is just a thermometer. n It measures the air temperature. n Duh! 20°C

The “Wet Bulb” n Has a little wet booty tied to the bottom. n Gets cool when water evaporates. Wet Booty 12°C

A Dry Day… n. A lot of moisture will evaporate. n The wet bulb will be a lot cooler than the dry bulb. 20°C Difference between wet bulb & dry bulb is 12 °C. 20°C 14°C 12°C 8°C

A Humid Day… n. A little bit of moisture will evaporate. n The wet bulb will not be much cooler than the dry bulb. 20°C Difference between wet bulb & dry bulb is 6 °C. 14°C

Page 12 of your Handy Dandy Earth Science Reference Tables Warning #1: Be sure to READ the correct chart: DPT or RH n Warning #2: Dew Point Temperature IS NOT “Difference between wet bulb and dry bulb”. n Warning #3: The wet bulb temp IS NOT the DPT. n

Dry-bulb temperature is your air temperature. 20 °C

14 °C

4 °C

Subtract (the difference) between the dry bulb and wet bulb

20°C 14°C 20 -14=6

18°C 16°C 18 -16=2

Put it all together 20°C 8°C 20 -8=12 Relative Humidity = 11%

14°C 10°C 14 -10=4 Relative Humidity = 60%

The Dew Point Chart works the same way 14°C 10°C 14 -10=4 Dew Point = 6°C

Try These. Dry Bulb Wet Bulb 26°C 20 °C 6 °C 5 °C 12 °C 8 °C 17 °C 14 °C 0 °C -3 °C R Humidity DPT 57% 86% 57% 91% 100% 45% 17 °C 4 °C 16 °C 14 °C -9 °C

More Difficult. Dry Bulb Wet Bulb 21°C 19°C 11°C 6 °C 17°C 2°C -3 °C 9°C 6. 5 °C 70°F 21 °C 60 °F 15 °C R Humidity DPT 82% 45. 5% 18 °C -. 5 °C 100% 20% 69% 52% 17 °C -17 °C 3. 5 °C 11 °C(50 °F)


 Handy dandy earth science reference tables
 Relative humidity reference table
 Calculate relative humidity
 Relative humidity chart
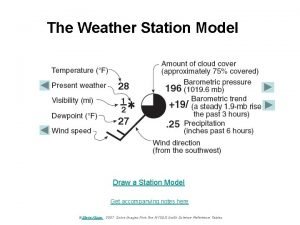
 Present weather station model
 Relative humidity
 Relative humidity on a station model
 What lessons did the skunk teach brian
 Dandy aesthetic movement
 Ventriculocele
 He did not wear his scarlet coat
 Complication of hydrocephalus
 Dandy innovations
 Limitations of liquid penetrant testing
 Dpt psychology
 Dpt 110
 Dpt 110
 Dpt psychology
 For unsaturated air the value of dpt is
 Vcu dpt

