
Mapping the Earth Big Question Why Map the
Mapping the Earth
Big Question Why Map the Earth?
Major Understandings • Earths True Shape • The spheres of Earth • Earths Coordinate system of latitude and longitude • Polaris’ connection to Earth’s shape and latitude • Time zones and their relationship to longitude • Draw and interpret isolines on various types of maps • Identify surface features using topographic maps • Draw and interpret topographic profiles • Understand gradient visually and mathematically
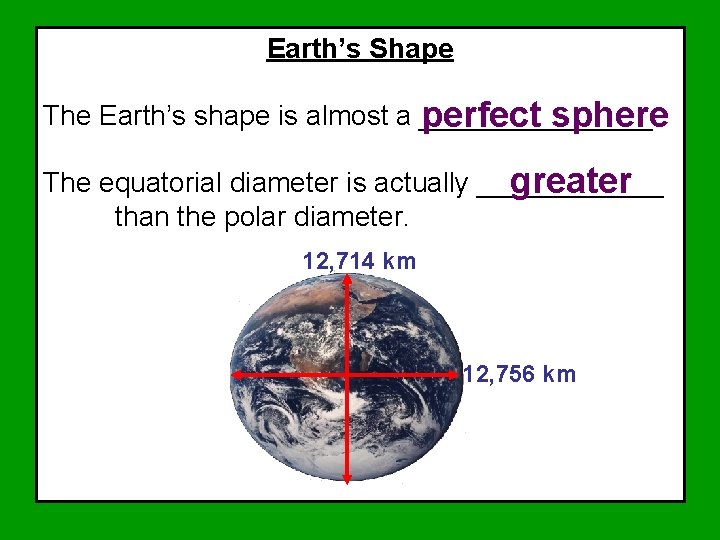
Earth’s Shape The Earth’s shape is almost a ________. perfect sphere The equatorial diameter is actually ______ greater than the polar diameter. 12, 714 km 12, 756 km
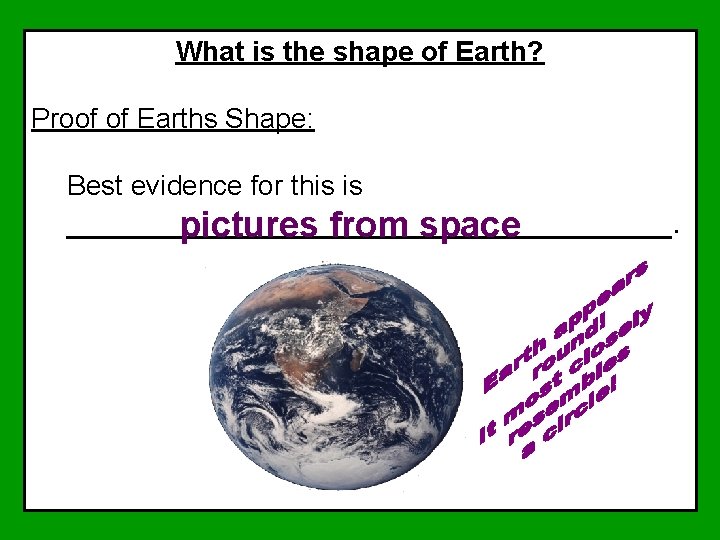
What is the shape of Earth? Proof of Earths Shape: Best evidence for this is _________________. pictures from space
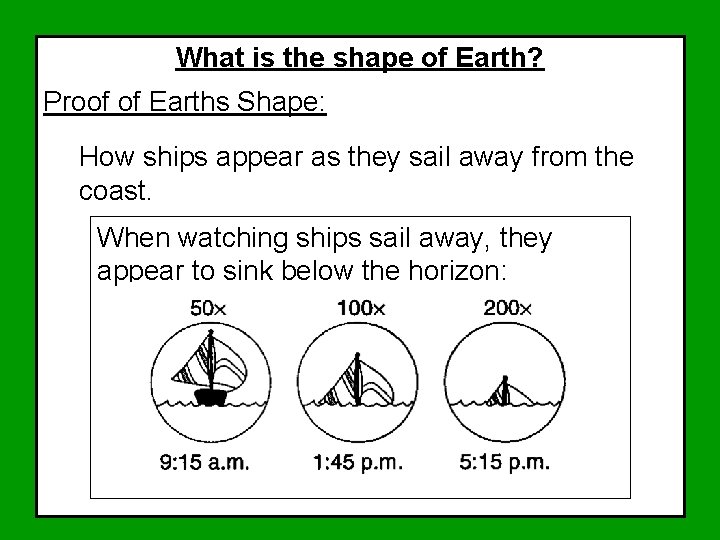
What is the shape of Earth? Proof of Earths Shape: How ships appear as they sail away from the coast. When watching ships sail away, they appear to sink below the horizon:
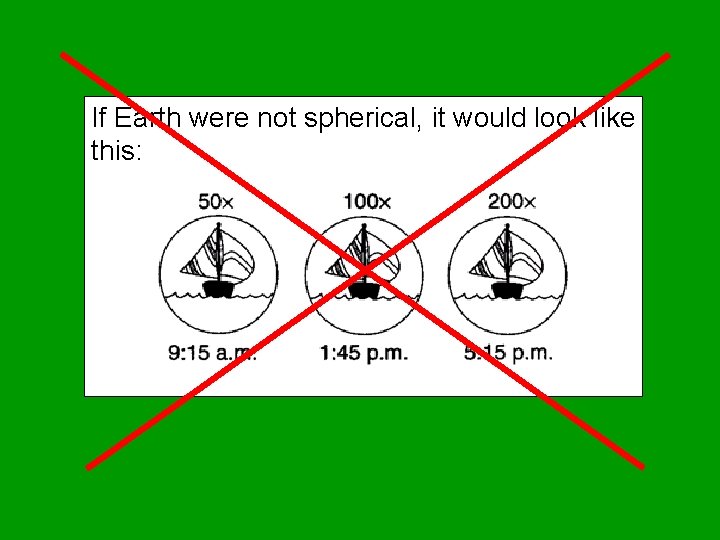
If Earth were not spherical, it would look like this:
Other Evidence that Earth’s Shape is Spherical:
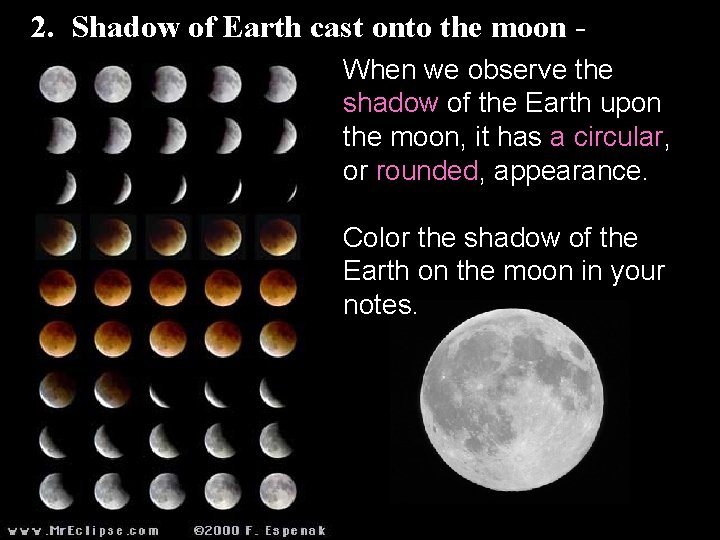
2. Shadow of Earth cast onto the moon When we observe the shadow of the Earth upon the moon, it has a circular, or rounded, appearance. Color the shadow of the Earth on the moon in your notes.
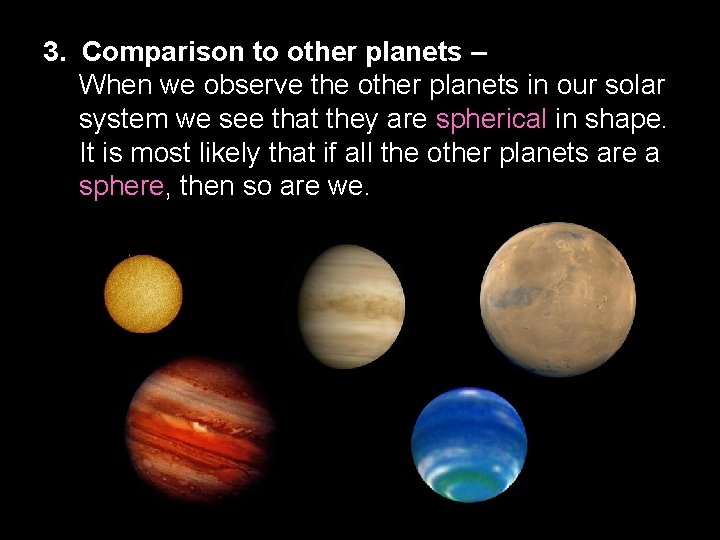
3. Comparison to other planets – When we observe the other planets in our solar system we see that they are spherical in shape. It is most likely that if all the other planets are a sphere, then so are we.
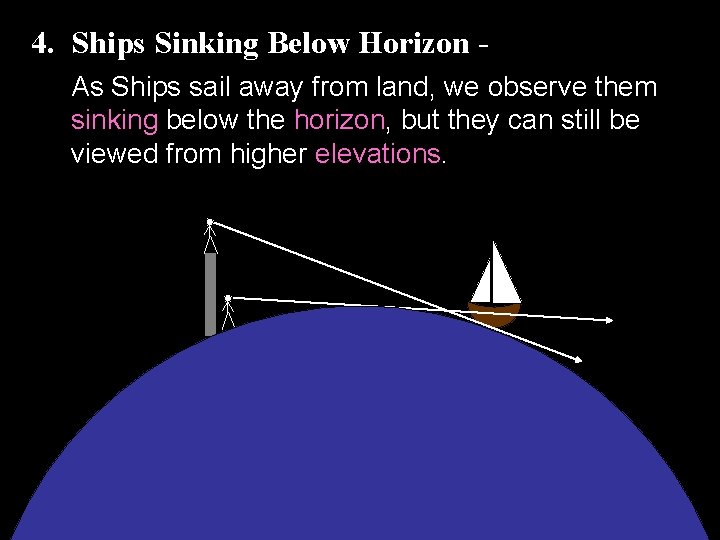
4. Ships Sinking Below Horizon As Ships sail away from land, we observe them sinking below the horizon, but they can still be viewed from higher elevations.
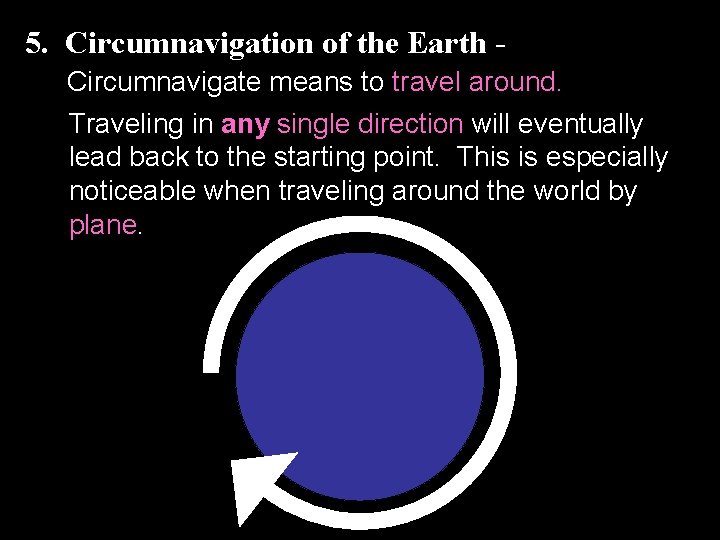
5. Circumnavigation of the Earth Circumnavigate means to travel around. Traveling in any single direction will eventually lead back to the starting point. This is especially noticeable when traveling around the world by plane.
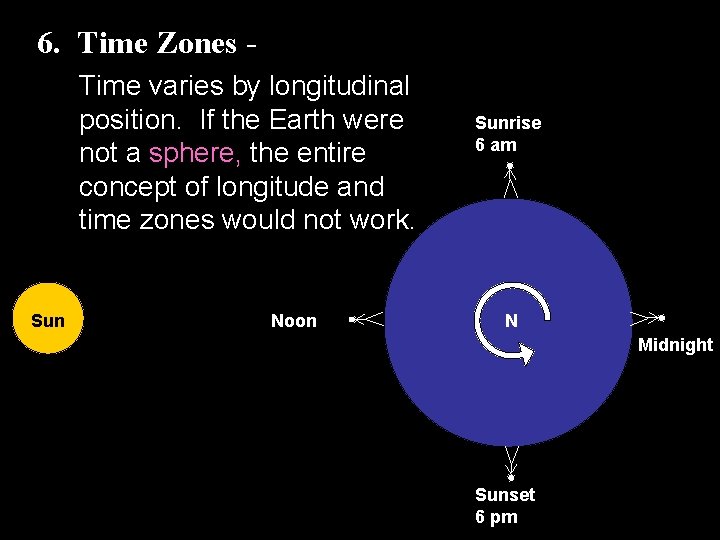
6. Time Zones Time varies by longitudinal position. If the Earth were not a sphere, the entire concept of longitude and time zones would not work. Sun Noon Sunrise 6 am N Midnight Sunset 6 pm
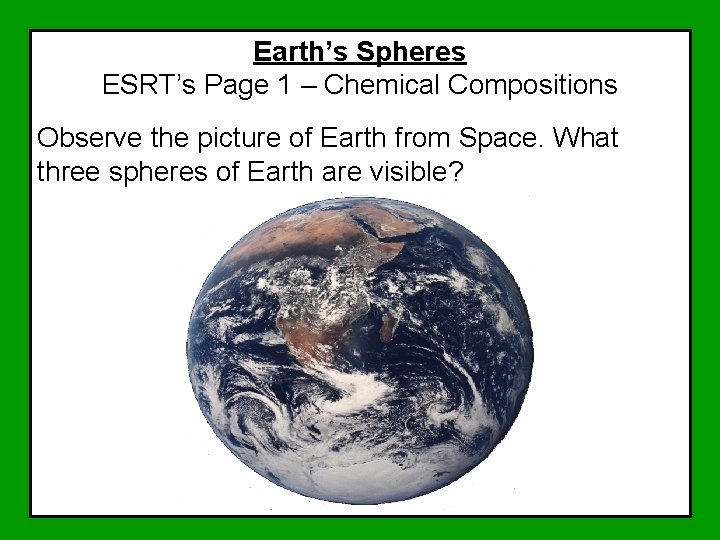
Earth’s Spheres ESRT’s Page 1 – Chemical Compositions Observe the picture of Earth from Space. What three spheres of Earth are visible?
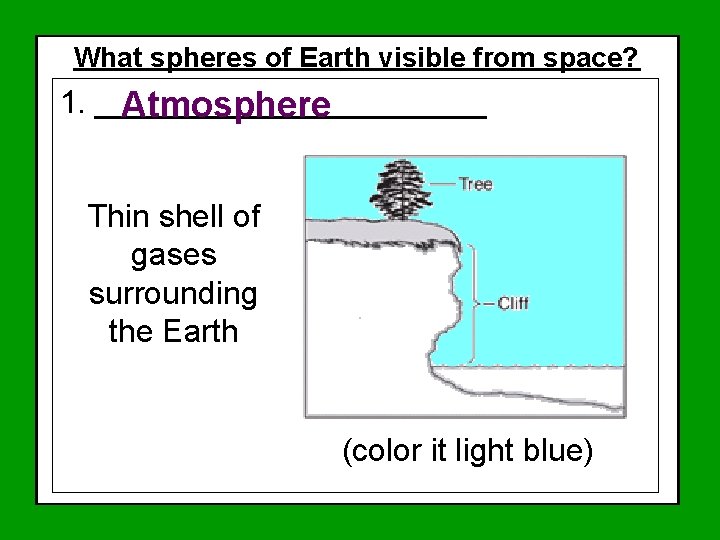
What spheres of Earth visible from space? ESRT’s Page 1 – Chemical Compositions 1. ___________ Atmosphere Thin shell of gases surrounding the Earth (color it light blue)
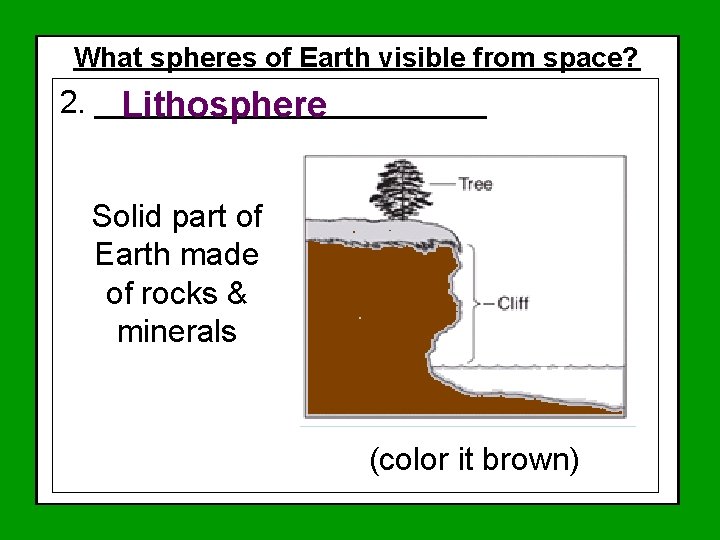
What spheres of Earth visible from space? ESRT’s Page 1 – Chemical Compositions 2. ___________ Lithosphere Solid part of Earth made of rocks & minerals (color it brown)
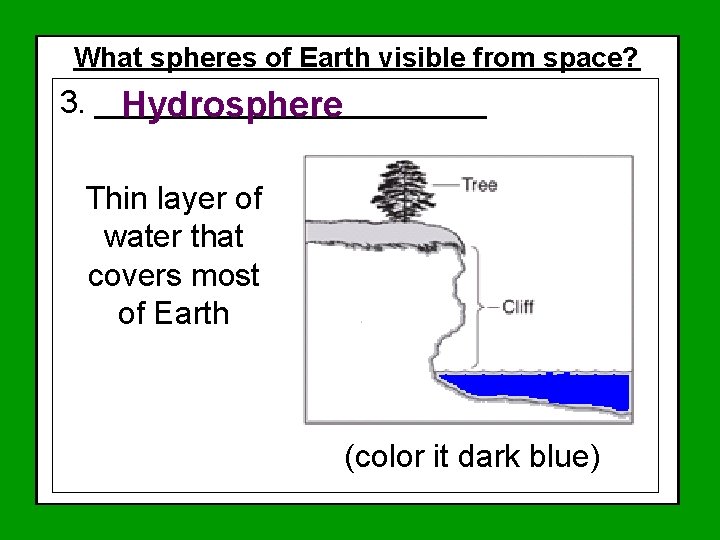
What spheres of Earth visible from space? ESRT’s Page 1 – Chemical Compositions 3. ___________ Hydrosphere Thin layer of water that covers most of Earth (color it dark blue)
Spheres of Earth Lab

What would you do if…… You were in a plane over the Pacific Ocean (remember, we live near the Atlantic Ocean) and the pilot suddenly tells you that you have to jump! The pilot shows your location and gives you a map and a satellite phone. You put on your life jacket and parachute and out you go. The next thing you know, you are floating somewhere in the pacific ocean. Who will you call? How will you tell them where to find you so they can send out a rescue party?
What are Latitude & Longitude? Directions North, South, East, or West Never Eat Shredded Wheat! Use a compass to determine Found on all Maps
Everyone stand up. Clear the area where you are standing.
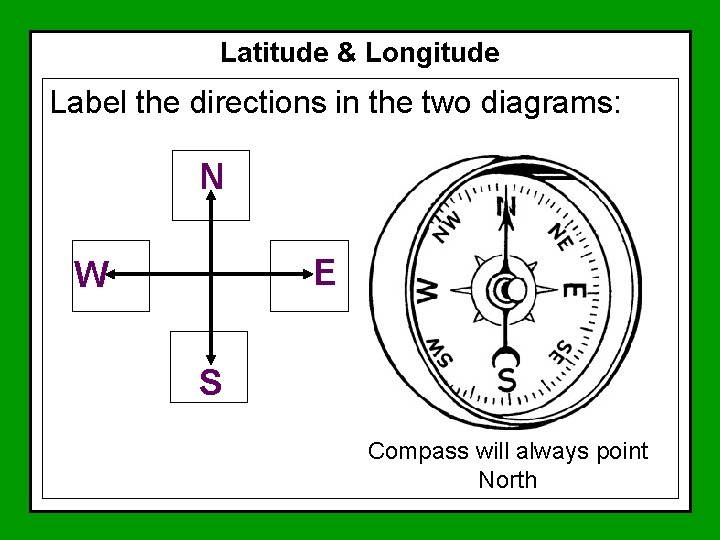
Latitude & Longitude Label the directions in the two diagrams: N E W S Compass will always point North
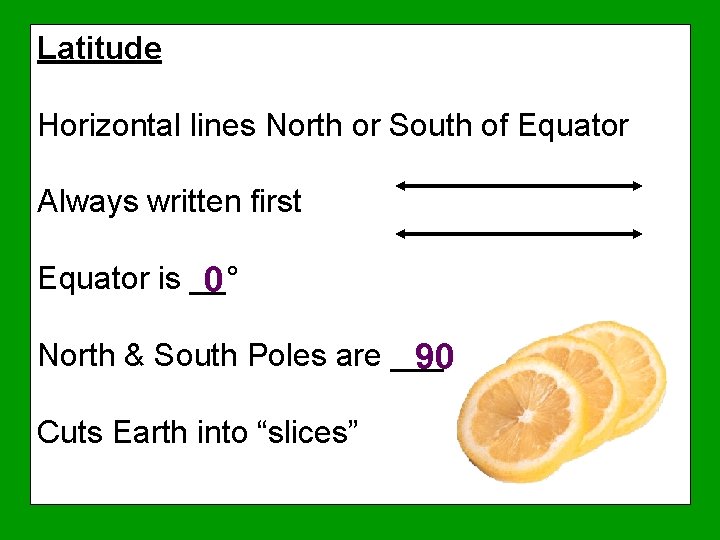
Latitude Horizontal lines North or South of Equator Always written first Equator is __° 0 North & South Poles are ____° 90 Cuts Earth into “slices”
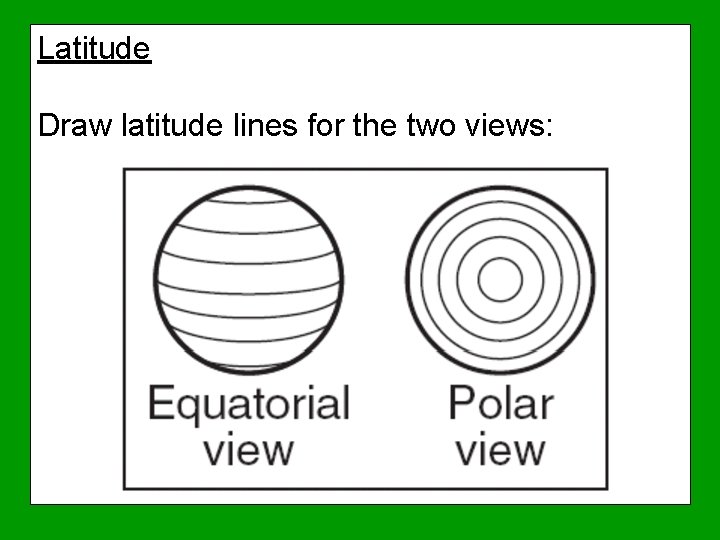
Latitude Draw latitude lines for the two views:
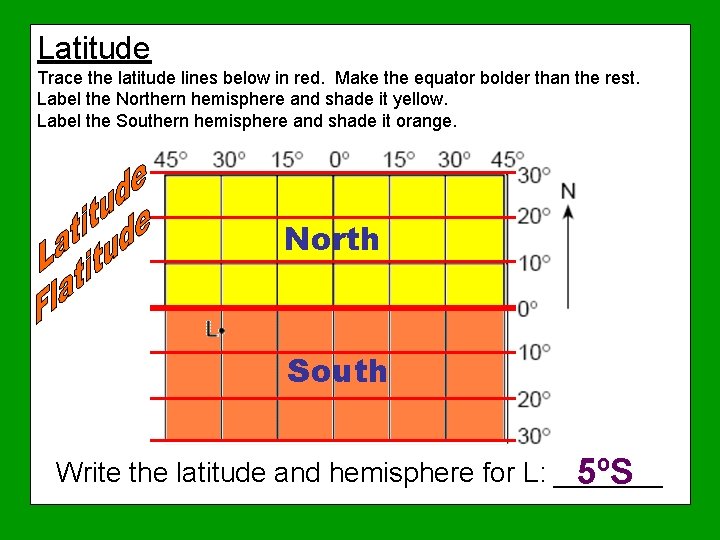
Latitude Trace the latitude lines below in red. Make the equator bolder than the rest. Label the Northern hemisphere and shade it yellow. Label the Southern hemisphere and shade it orange. North South Write the latitude and hemisphere for L: _______ 5ºS
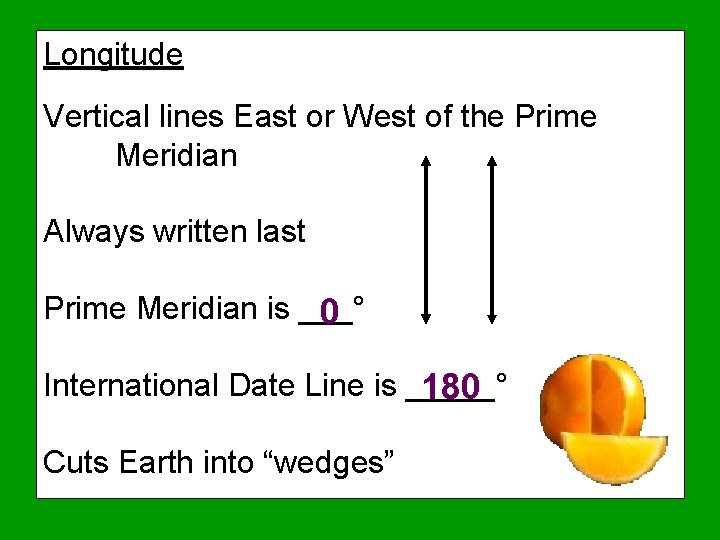
Longitude Vertical lines East or West of the Prime Meridian Always written last Prime Meridian is ___° 0 International Date Line is _____° 180 Cuts Earth into “wedges”
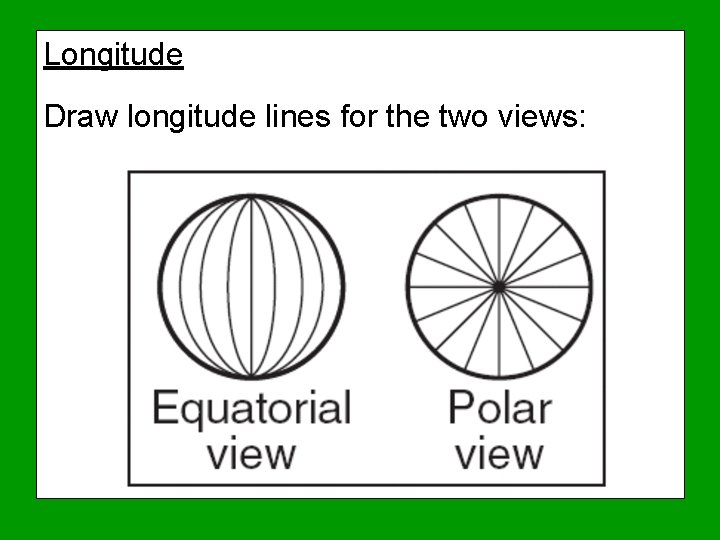
Longitude Draw longitude lines for the two views:
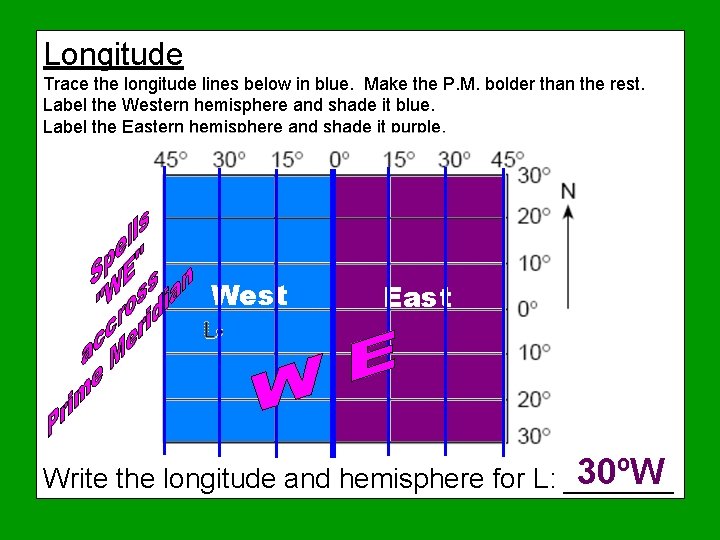
Longitude Trace the longitude lines below in blue. Make the P. M. bolder than the rest. Label the Western hemisphere and shade it blue. Label the Eastern hemisphere and shade it purple. West East 30ºW Write the longitude and hemisphere for L: _______
Coordinates are a combination of latitude ________ and _________. longitude Step by Step Procedure for determining or plotting coordinates: 1. Determine the view of the map 2. Trace and label the equator, prime meridian, and international date line 3. Write in the hemispheres for latitude and longitude (spells WE across PM) 4. Determine the scale of the map & and label lines (degrees or degrees & minutes) 5. Plot or write the coordinates – Latitude comes first!
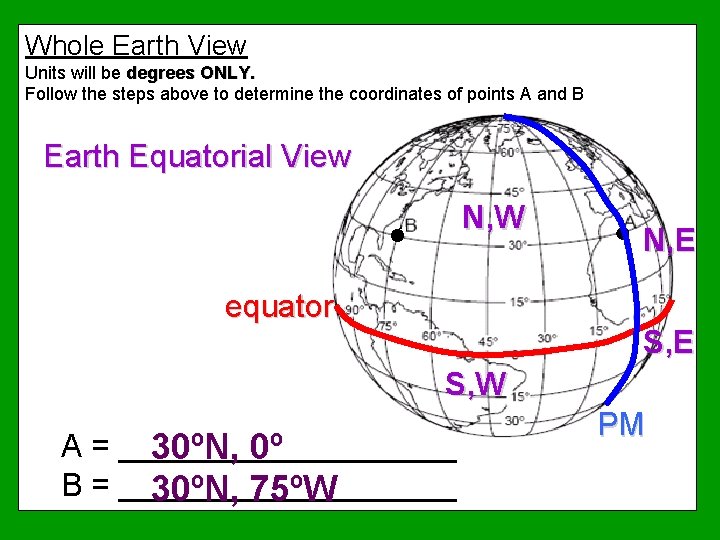
Whole Earth View Units will be degrees ONLY. Follow the steps above to determine the coordinates of points A and B Earth Equatorial View N, W equator N, E S, W A = __________ 30ºN, 0º B = __________ 30ºN, 75ºW PM
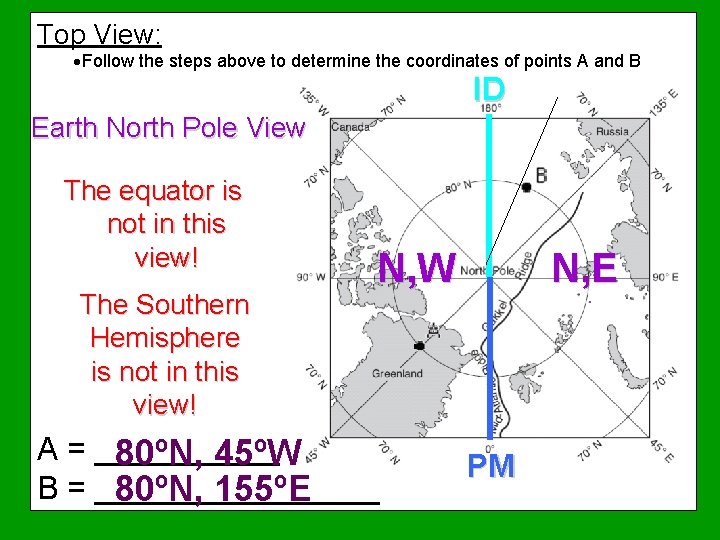
Top View: ·Follow the steps above to determine the coordinates of points A and B ID Earth North Pole View The equator is not in this view! The Southern Hemisphere is not in this view! N, E N, W A = ________ 80ºN, 45ºW B = ________ 80ºN, 155ºE PM
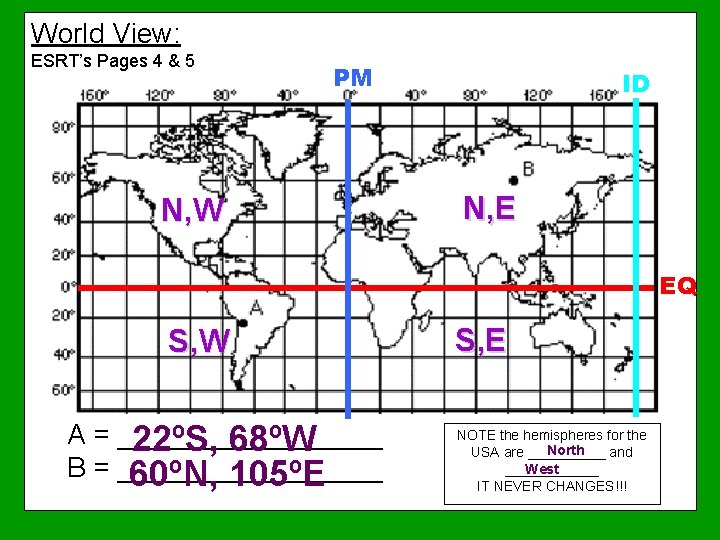
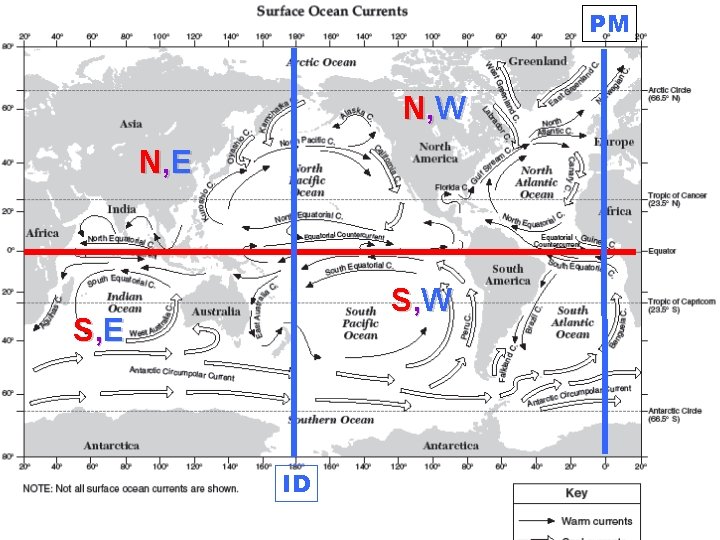
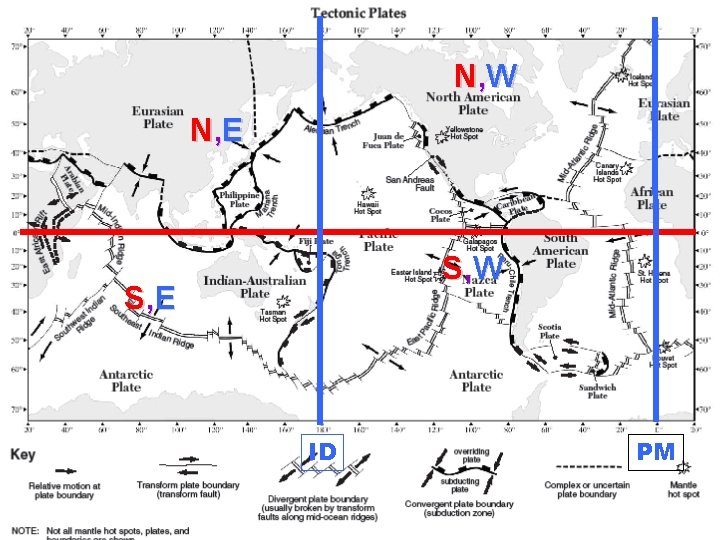
World View: ESRT’s Pages 4 & 5 PM N, W ID N, E EQ S, W A = _________ 22ºS, 68ºW B = _________ 60ºN, 105ºE S, E NOTE the hemispheres for the North USA are _____ and ______ West IT NEVER CHANGES!!!
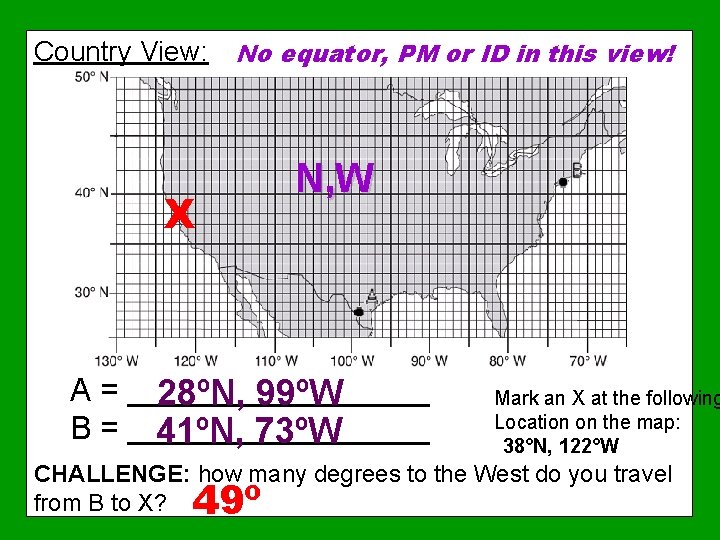
Country View: No equator, PM or ID in this view! X N, W A = _________ 28ºN, 99ºW B = _________ 41ºN, 73ºW Mark an X at the following Location on the map: 38°N, 122°W CHALLENGE: how many degrees to the West do you travel from B to X? 49º
World View Maps in Your ESRT’s that you will use for Latitude and Longitude (pages 4 & 5) • Trace the equator in red • Trace the Prime Meridian dark in blue • Trace the International Date Line in light blue • Label the 4 quadrants NW, NE, SW, & SE
PM N, W N, E S, W S, E ID
N, W N, E S, W S, E ID PM
Coordinates of National Parks
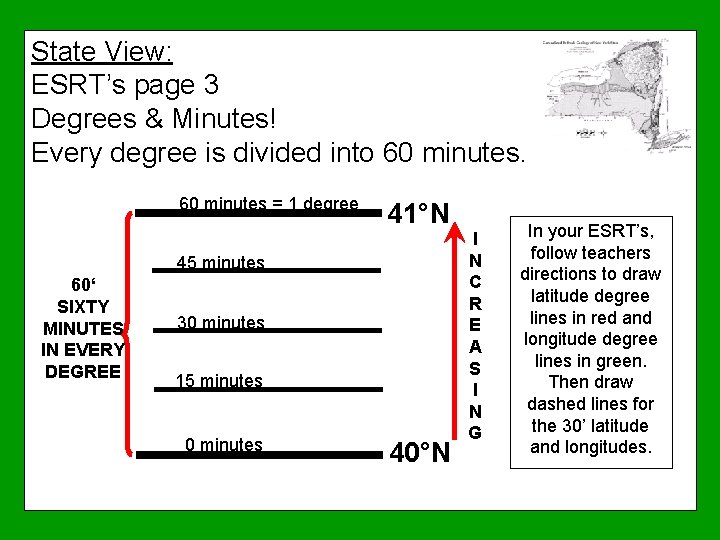
State View: ESRT’s page 3 Degrees & Minutes! Every degree is divided into 60 minutes = 1 degree 41°N 45 minutes 60‘ SIXTY MINUTES IN EVERY DEGREE 30 minutes 15 minutes 0 minutes 40°N I N C R E A S I N G In your ESRT’s, follow teachers directions to draw latitude degree lines in red and longitude degree lines in green. Then draw dashed lines for the 30’ latitude and longitudes.
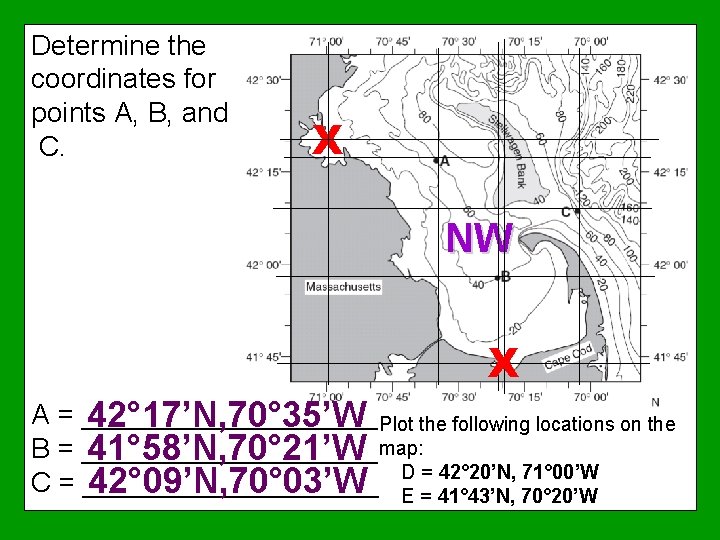
Determine the coordinates for points A, B, and C. X NW X A = __________ 42° 17’N, 70° 35’W Plot the following locations on the B = __________ 41° 58’N, 70° 21’W map: D = 42° 20’N, 71° 00’W C = __________ 42° 09’N, 70° 03’W E = 41° 43’N, 70° 20’W
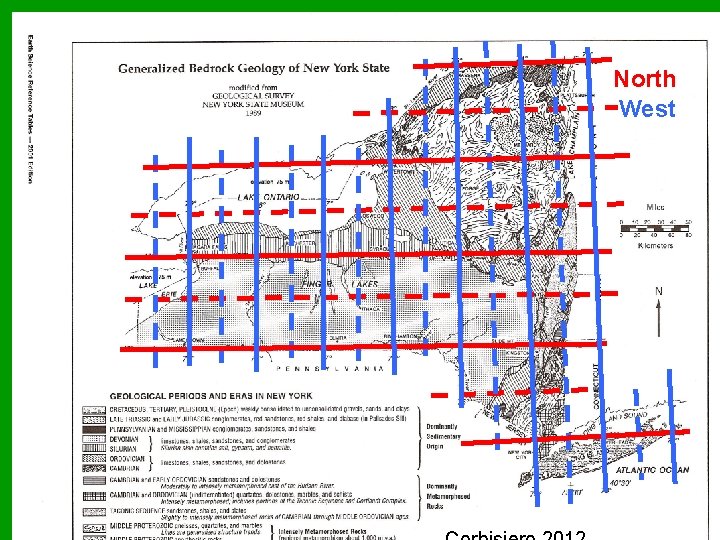
North West
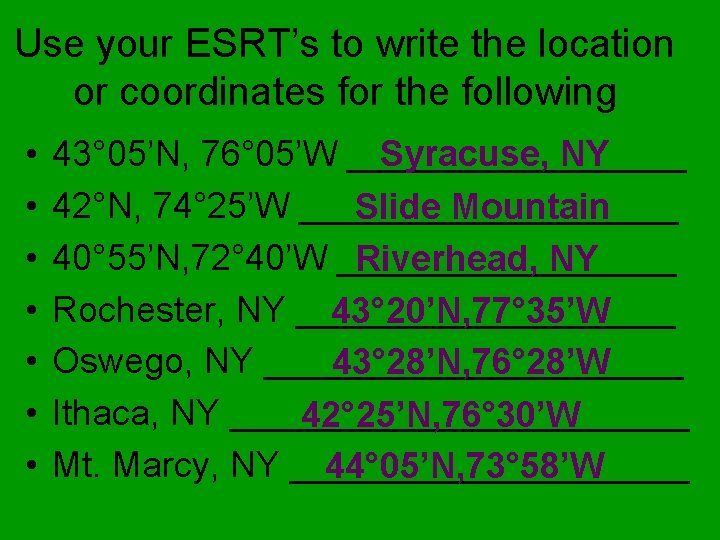
Use your ESRT’s to write the location or coordinates for the following • • 43° 05’N, 76° 05’W _________ Syracuse, NY 42°N, 74° 25’W __________ Slide Mountain 40° 55’N, 72° 40’W _________ Riverhead, NY Rochester, NY __________ 43° 20’N, 77° 35’W Oswego, NY ___________ 43° 28’N, 76° 28’W Ithaca, NY ____________ 42° 25’N, 76° 30’W Mt. Marcy, NY __________ 44° 05’N, 73° 58’W
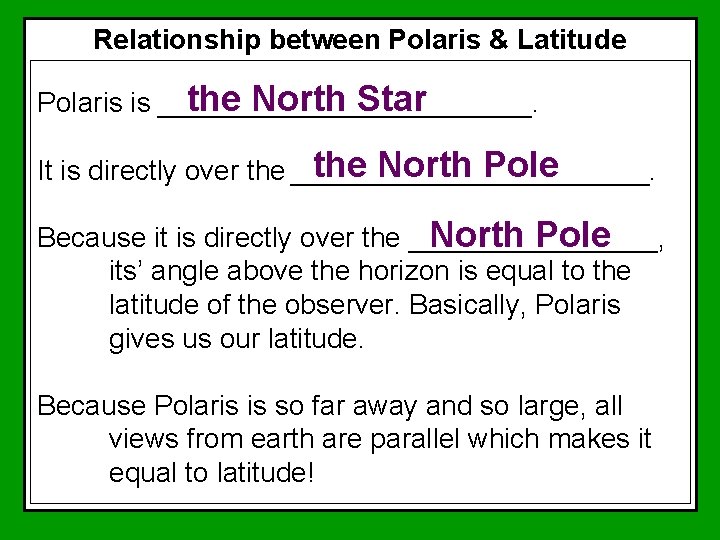
Relationship between Polaris & Latitude the North Star Polaris is ____________. the North Pole It is directly over the ____________. Because it is directly over the ________, North Pole its’ angle above the horizon is equal to the latitude of the observer. Basically, Polaris gives us our latitude. Because Polaris is so far away and so large, all views from earth are parallel which makes it equal to latitude!
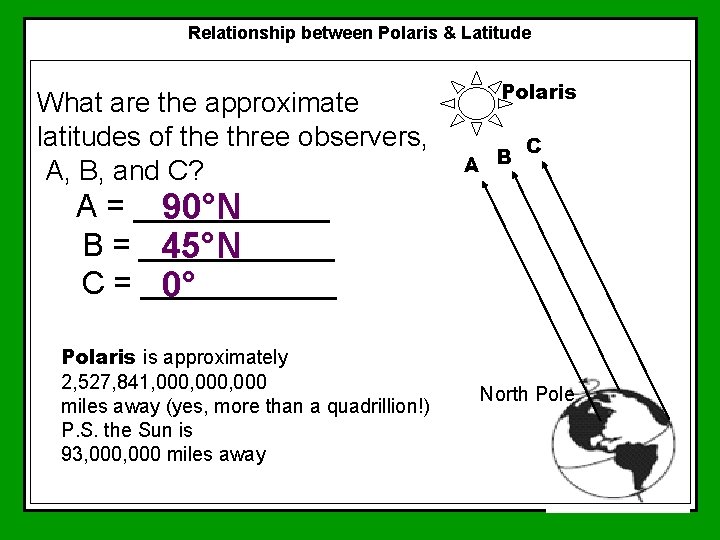
Relationship between Polaris & Latitude What are the approximate latitudes of the three observers, A, B, and C? Polaris A B C A = ______ 90°N B = ______ 45°N C = ______ 0° Polaris is approximately 2, 527, 841, 000, 000 miles away (yes, more than a quadrillion!) P. S. the Sun is 93, 000 miles away North Pole
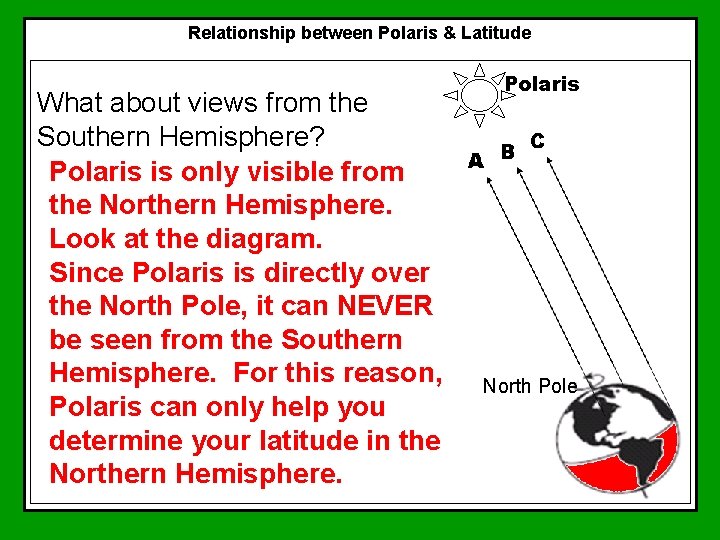
Relationship between Polaris & Latitude What about views from the Southern Hemisphere? Polaris is only visible from the Northern Hemisphere. Look at the diagram. Since Polaris is directly over the North Pole, it can NEVER be seen from the Southern Hemisphere. For this reason, Polaris can only help you determine your latitude in the Northern Hemisphere. Polaris North Pole
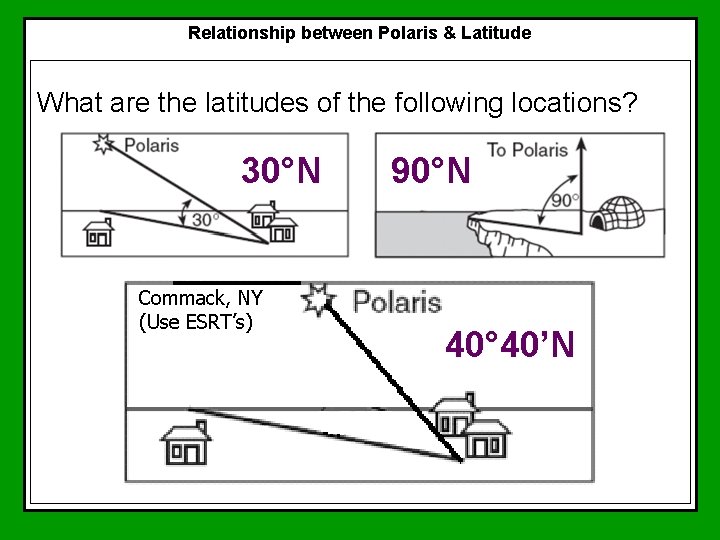
Relationship between Polaris & Latitude What are the latitudes of the following locations? 30°N Commack, NY (Use ESRT’s) 90°N 40° 40’N
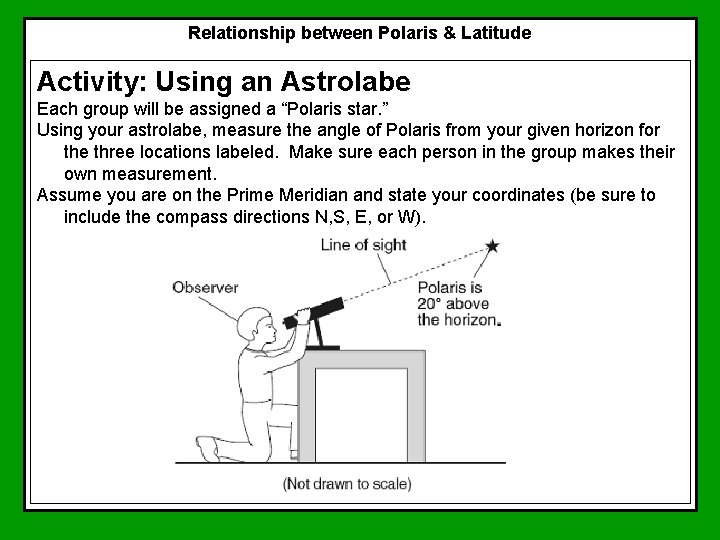
Relationship between Polaris & Latitude Activity: Using an Astrolabe Each group will be assigned a “Polaris star. ” Using your astrolabe, measure the angle of Polaris from your given horizon for the three locations labeled. Make sure each person in the group makes their own measurement. Assume you are on the Prime Meridian and state your coordinates (be sure to include the compass directions N, S, E, or W).
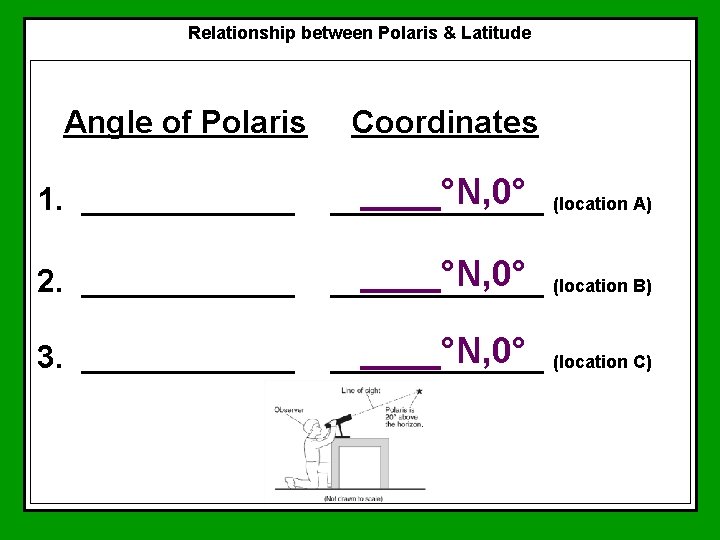
Relationship between Polaris & Latitude Angle of Polaris Coordinates 1. ______°N, 0° (location A) ______ 2. ______°N, 0° (location B) ______ 3. ______°N, 0° (location C) ______
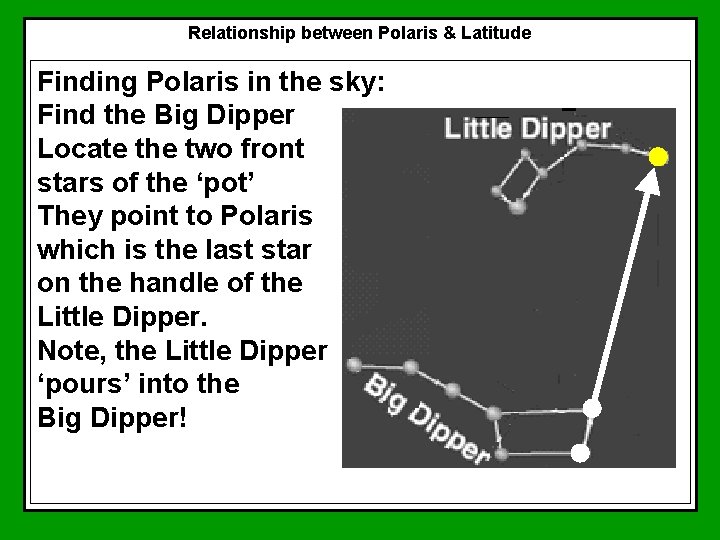
Relationship between Polaris & Latitude Finding Polaris in the sky: Find the Big Dipper Locate the two front stars of the ‘pot’ They point to Polaris which is the last star on the handle of the Little Dipper. Note, the Little Dipper ‘pours’ into the Big Dipper!
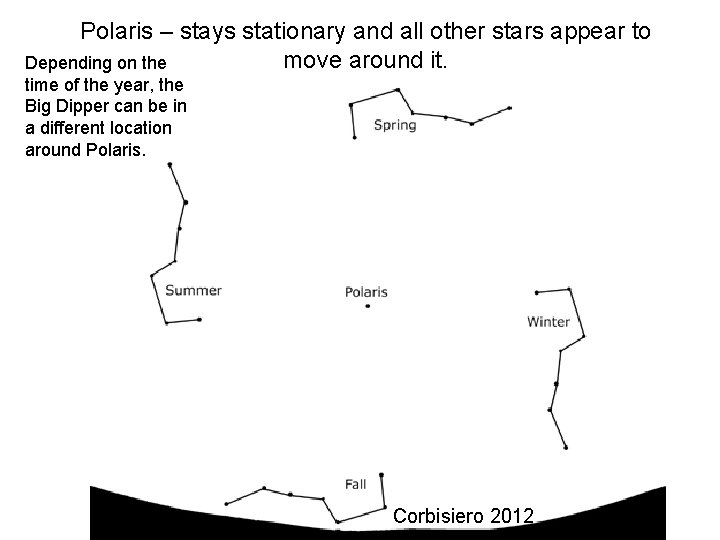
Polaris – stays stationary and all other stars appear to move around it. Depending on the time of the year, the Big Dipper can be in a different location around Polaris. Corbisiero 2012
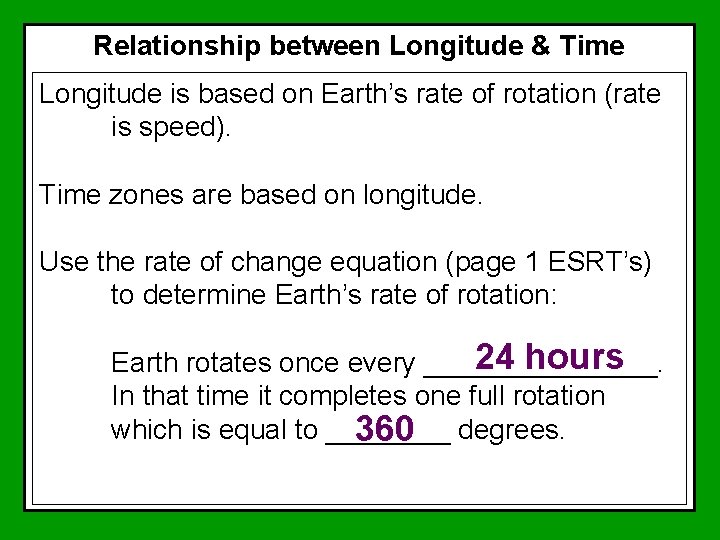
Relationship between Longitude & Time Longitude is based on Earth’s rate of rotation (rate is speed). Time zones are based on longitude. Use the rate of change equation (page 1 ESRT’s) to determine Earth’s rate of rotation: 24 hours Earth rotates once every ________. In that time it completes one full rotation which is equal to ____ 360 degrees.
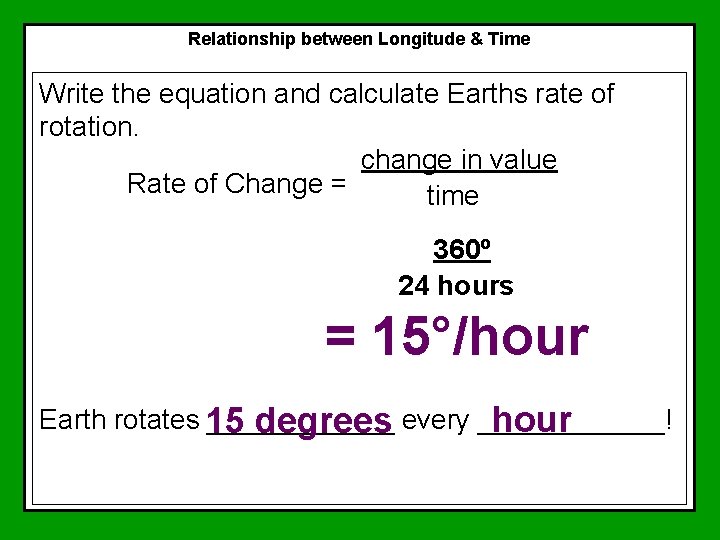
Relationship between Longitude & Time Write the equation and calculate Earths rate of rotation. change in value Rate of Change = time 360º 24 hours = 15°/hour Earth rotates 15 ______ hour degrees every ______!
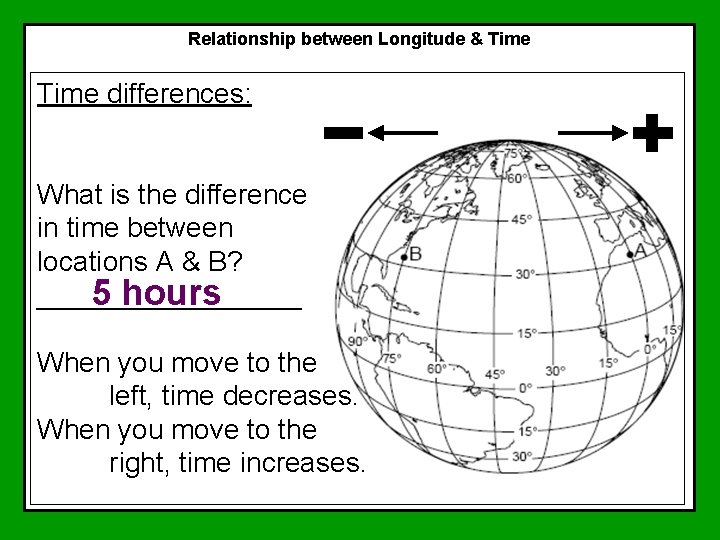
Relationship between Longitude & Time differences: What is the difference in time between locations A & B? _________ 5 hours When you move to the left, time decreases. When you move to the right, time increases.
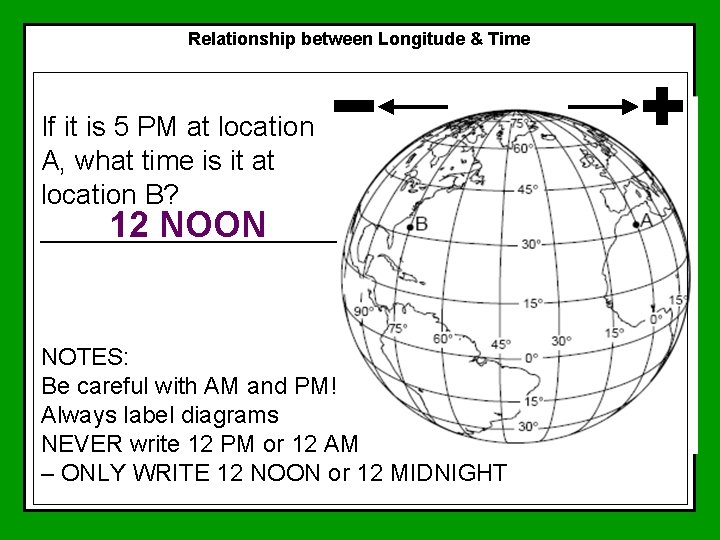
Relationship between Longitude & Time If it is 5 PM at location A, what time is it at location B? 12 NOON __________ NOTES: Be careful with AM and PM! Always label diagrams NEVER write 12 PM or 12 AM – ONLY WRITE 12 NOON or 12 MIDNIGHT
Relationship between Longitude & Time Zones: In the United States the time zones are not straight lines because they don’t want them to cut through highly populated areas. Each time zone in the United States is an hour difference.
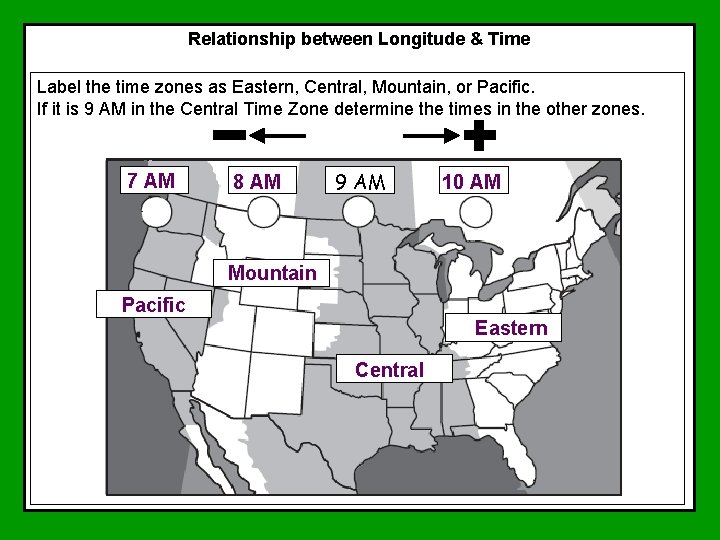
Relationship between Longitude & Time Label the time zones as Eastern, Central, Mountain, or Pacific. If it is 9 AM in the Central Time Zone determine the times in the other zones. 7 AM 8 AM 9 AM 10 AM Mountain Pacific Eastern Central
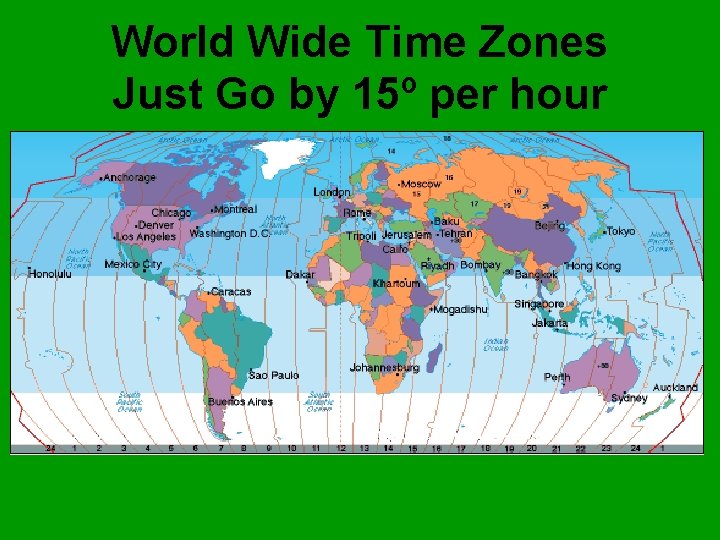
World Wide Time Zones Just Go by 15º per hour
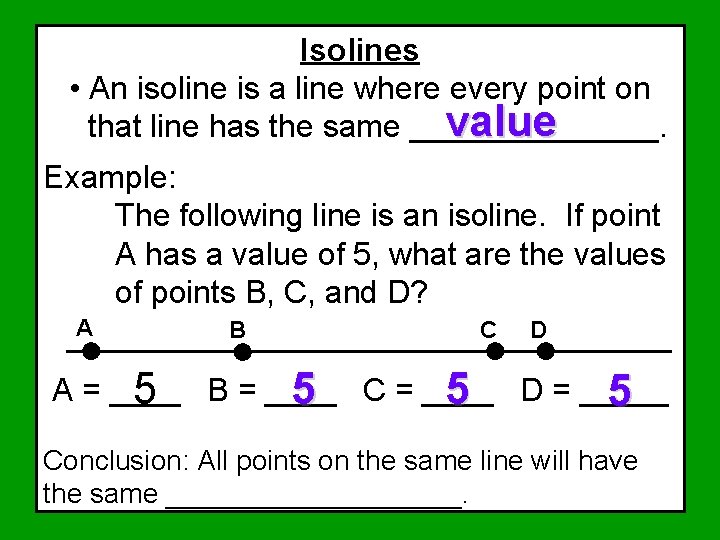
Isolines • An isoline is a line where every point on value that line has the same _______. Example: The following line is an isoline. If point A has a value of 5, what are the values of points B, C, and D? A B C D A = ____ 5 B = ____ 5 C = ____ 5 D = _____ 5 Conclusion: All points on the same line will have the same __________.
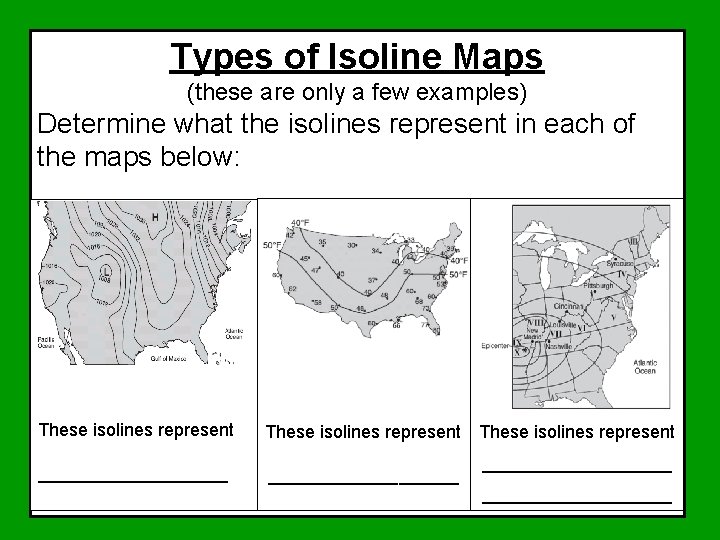
Types of Isoline Maps (these are only a few examples) Determine what the isolines represent in each of the maps below: These isolines represent ___________________

Types of Isoline Maps (these are only a few examples) These isolines represent ___________ Barometric pressure
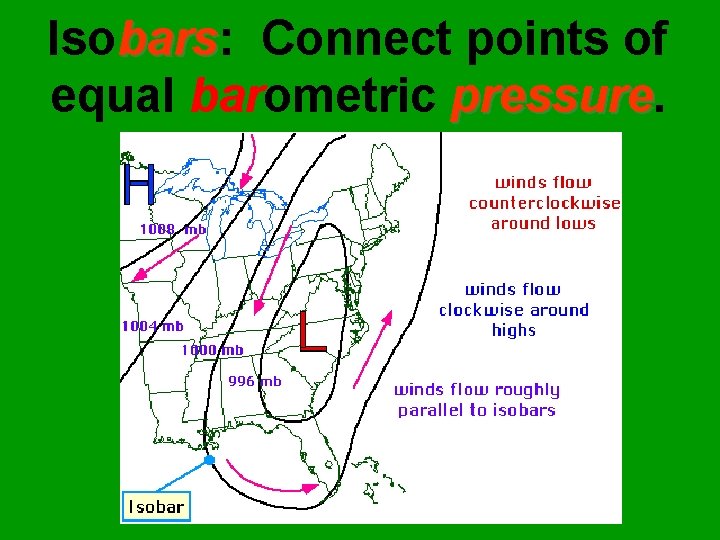
Isobars: bars Connect points of equal barometric pressure

Types of Isoline Maps (these are only a few examples) These isolines represent ___________ temperature
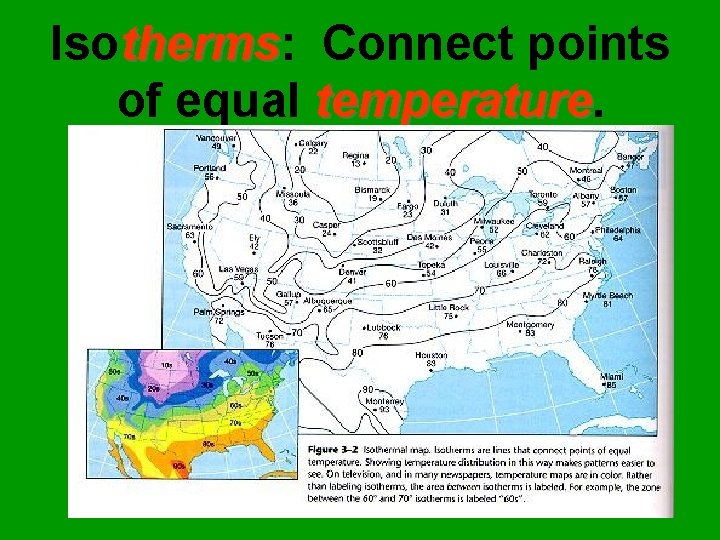
Isotherms: therms Connect points of equal temperature

Types of Isoline Maps (these are only a few examples) These isolines represent __________________ Earthquake intensities

Drawing Isolines Isoline Rules 1. Islolines connect points of equal _______. value 5 5 10 10 10 15 15
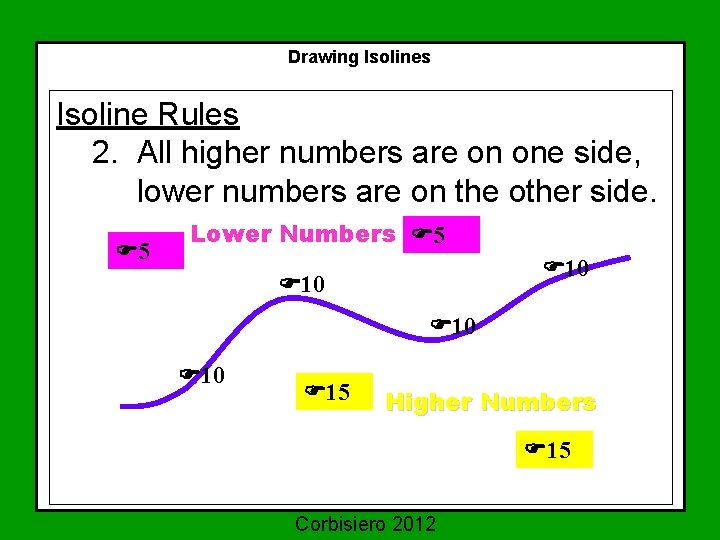
Drawing Isolines Isoline Rules 2. All higher numbers are on one side, lower numbers are on the other side. 5 Lower Numbers 5 10 10 10 15 Higher Numbers 15 Corbisiero 2012
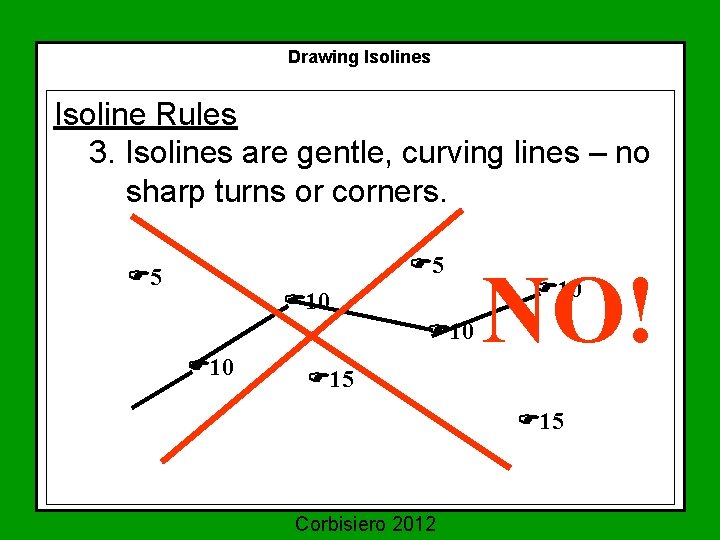
Drawing Isolines Isoline Rules 3. Isolines are gentle, curving lines – no sharp turns or corners. 5 5 10 10 10 NO! 10 15 15 Corbisiero 2012
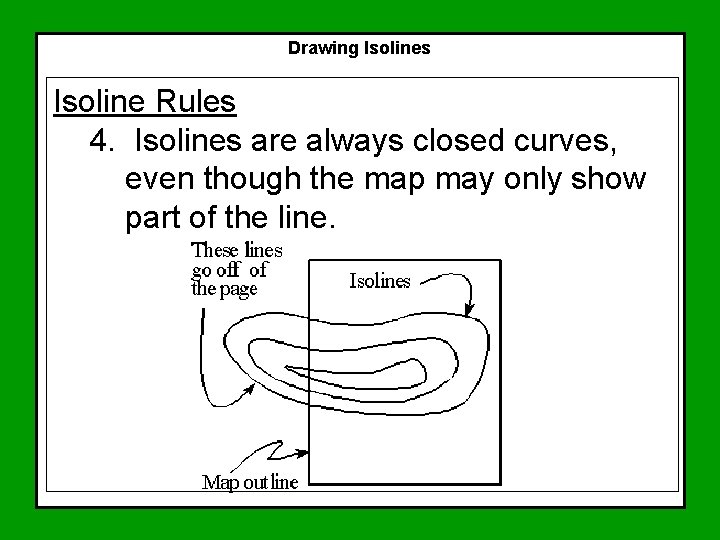
Drawing Isolines Isoline Rules 4. Isolines are always closed curves, even though the map may only show part of the line.
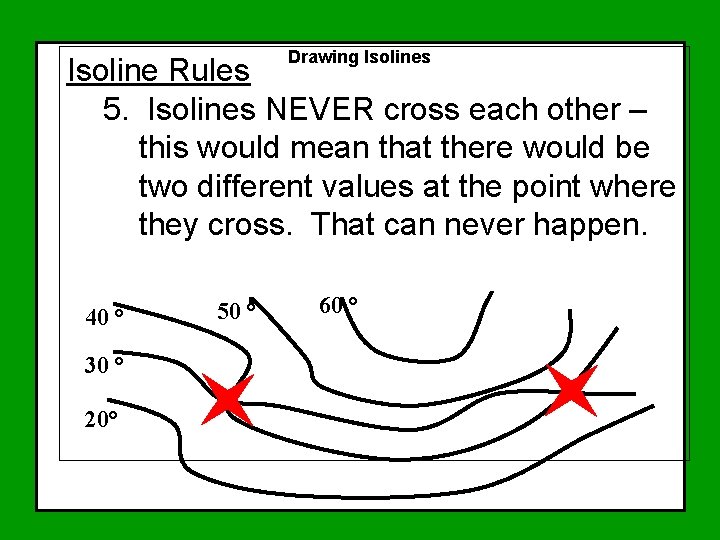
Drawing Isolines Isoline Rules 5. Isolines NEVER cross each other – this would mean that there would be two different values at the point where they cross. That can never happen. 40 ° 30 ° 20° 50 ° 60 °
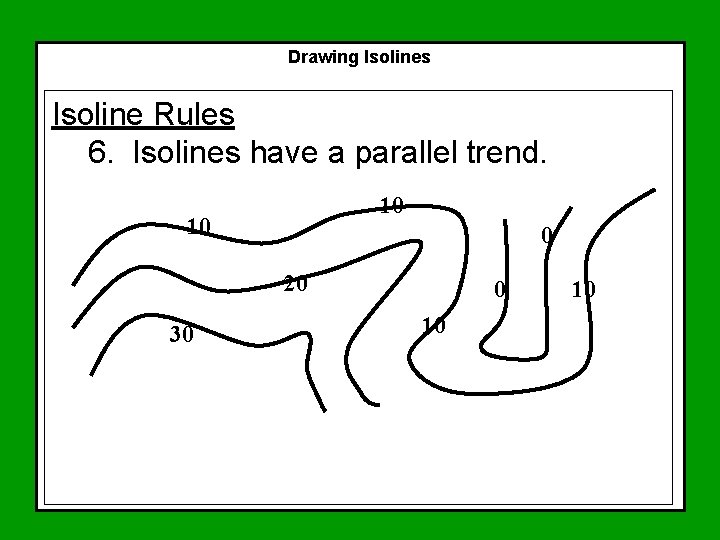
Drawing Isolines Isoline Rules 6. Isolines have a parallel trend. 10 10 0 20 30 0 10 10
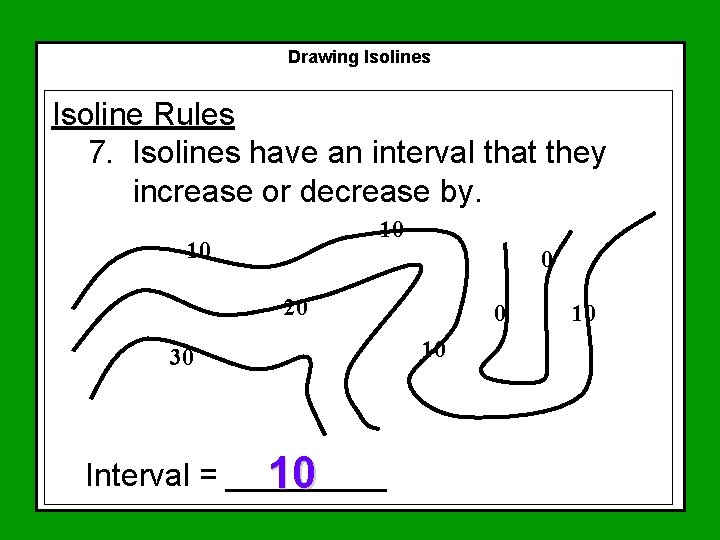
Drawing Isolines Isoline Rules 7. Isolines have an interval that they increase or decrease by. 10 10 0 20 30 Interval = _____ 10 0 10 10
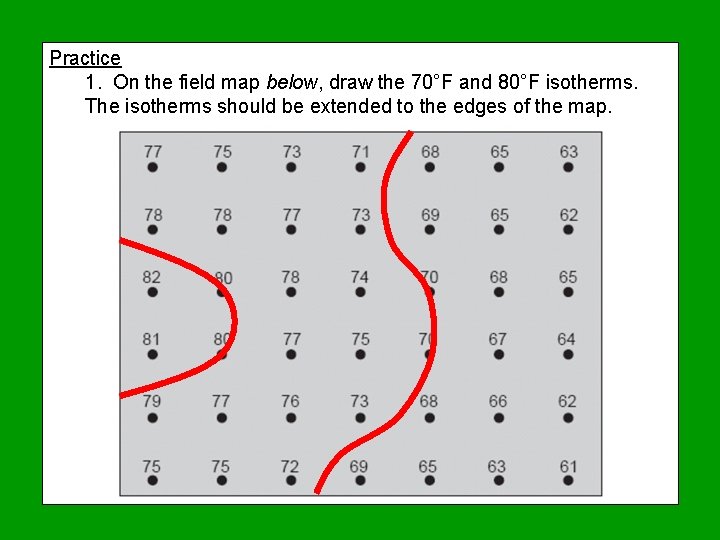
Practice 1. On the field map below, draw the 70°F and 80°F isotherms. The isotherms should be extended to the edges of the map.
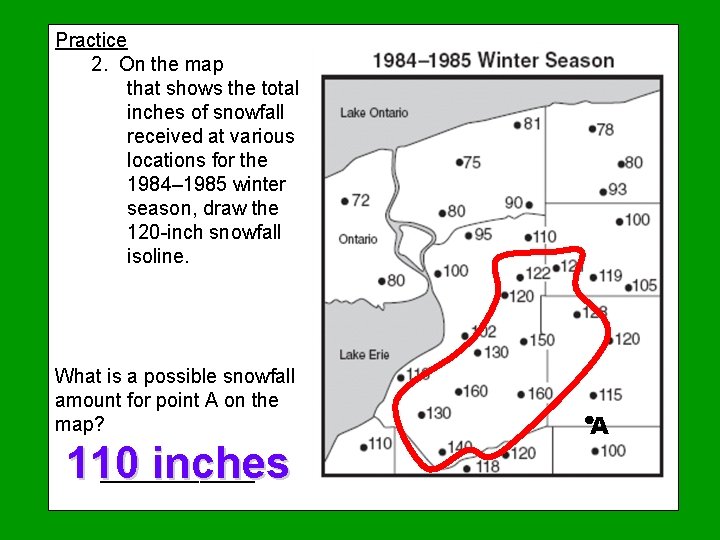
Practice 2. On the map that shows the total inches of snowfall received at various locations for the 1984– 1985 winter season, draw the 120 -inch snowfall isoline. What is a possible snowfall amount for point A on the map? 110 inches _______ A
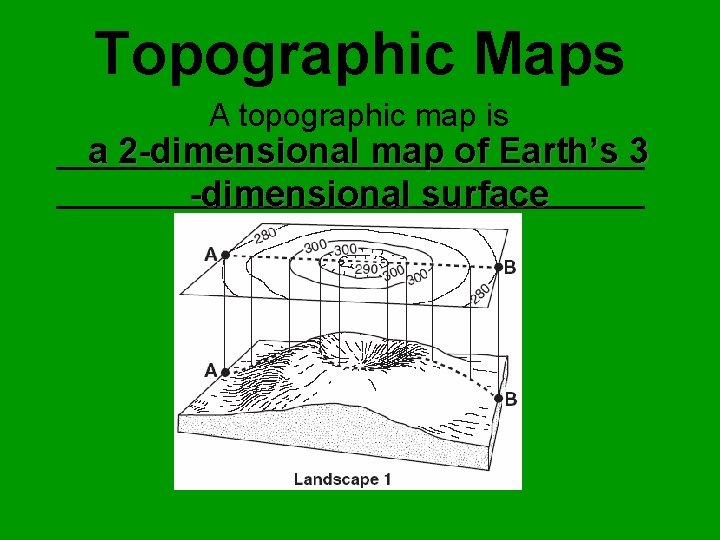
Topographic Maps A topographic map is a 2 -dimensional map of Earth’s 3 _________________________________ -dimensional surface
A topographic map is a field map that measures elevation above or below Sea level is the average level of the water in the oceans and always has an elevation of zero (0). Average because the level increases and decreases every 6 hours due to the tides.
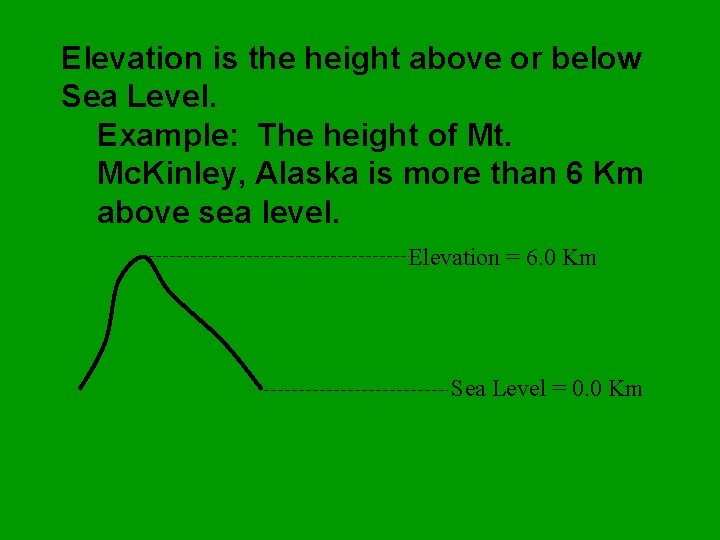
Elevation is the height above or below Sea Level. Example: The height of Mt. Mc. Kinley, Alaska is more than 6 Km above sea level. Elevation = 6. 0 Km Sea Level = 0. 0 Km
A topographic map is a map showing surface features of the Earth. There are three main regions of Earth’s topography: 1. Mountains 2. Plains 3. Plateaus
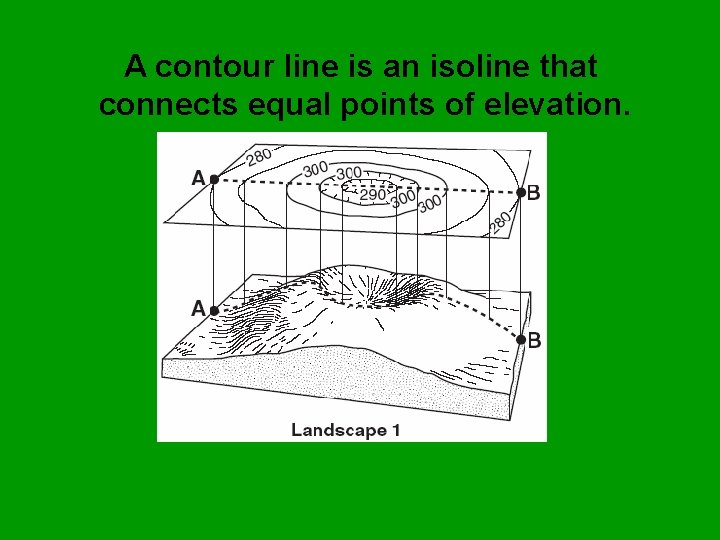
A contour line is an isoline that connects equal points of elevation.
LAB Reading a Topographic Map
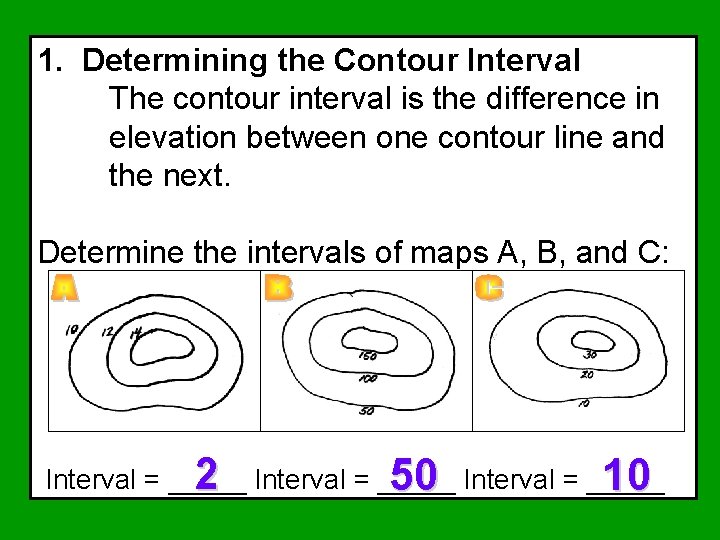
1. Determining the Contour Interval The contour interval is the difference in elevation between one contour line and the next. Determine the intervals of maps A, B, and C: 2 Interval = _____ 50 Interval = _____ 10
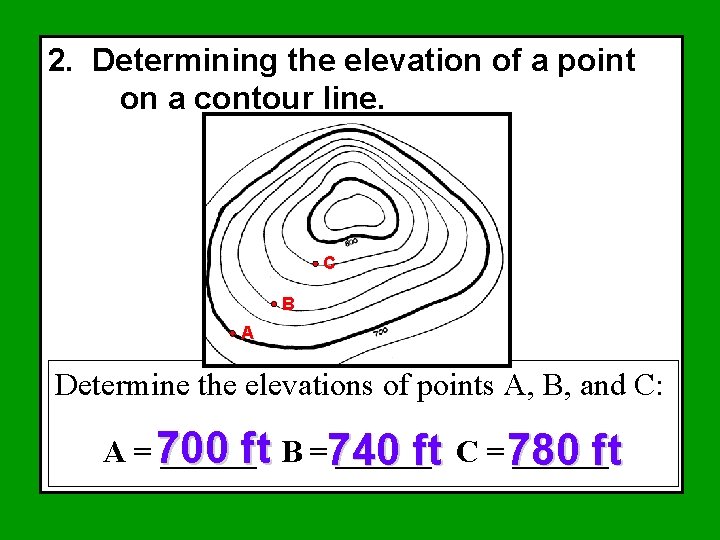
2. Determining the elevation of a point on a contour line. C B A Determine the elevations of points A, B, and C: A = 700 ______ft B =740 ______ ft C = 780 ft
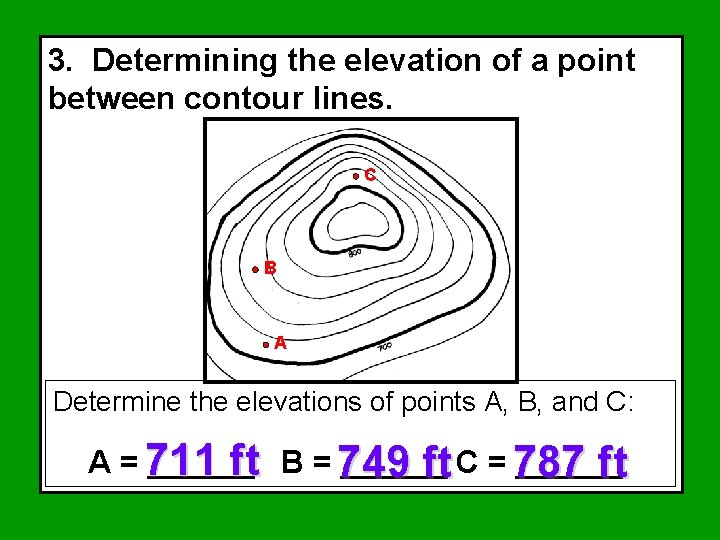
3. Determining the elevation of a point between contour lines. C B A Determine the elevations of points A, B, and C: A = 711 ______ ft B = 749 ft C = 787 ft
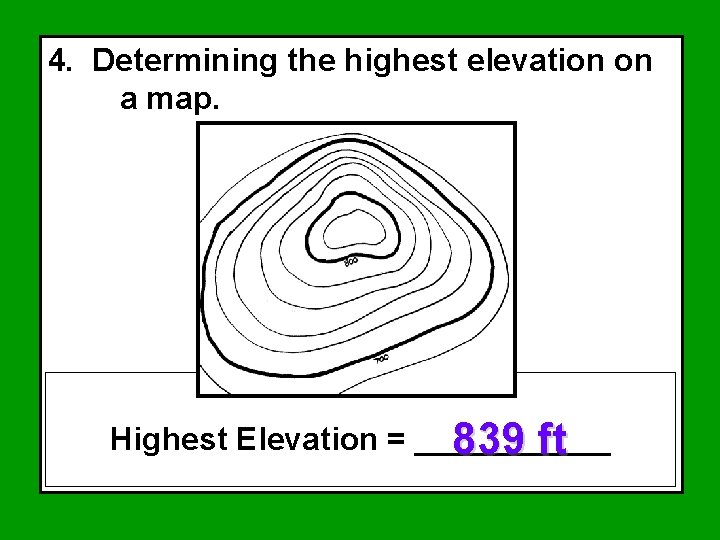
4. Determining the highest elevation on a map. Highest Elevation = ______ 839 ft
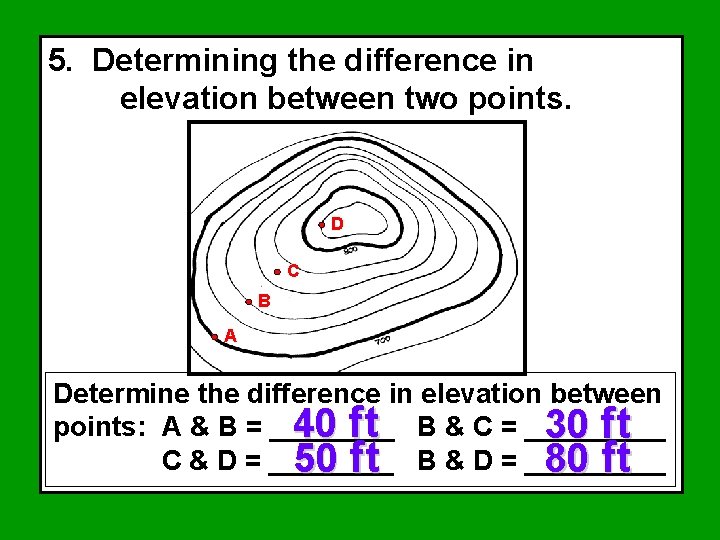
5. Determining the difference in elevation between two points. D C B A Determine the difference in elevation between points: A & B = ____ 40 ft B & C = _____ 30 ft C & D = ____ 50 ft B & D = _____ 80 ft
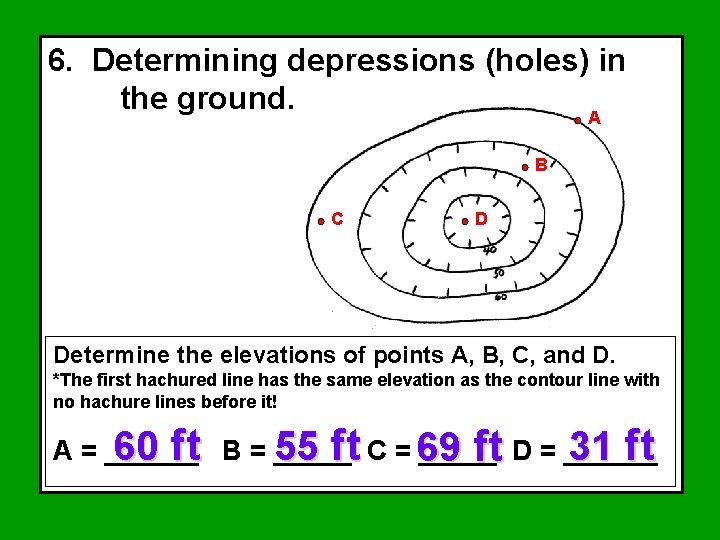
6. Determining depressions (holes) in the ground. A B C D Determine the elevations of points A, B, C, and D. *The first hachured line has the same elevation as the contour line with no hachure lines before it! 60 ft B = _____ 55 ft C = 69 31 ft A = ______ ft D = ______
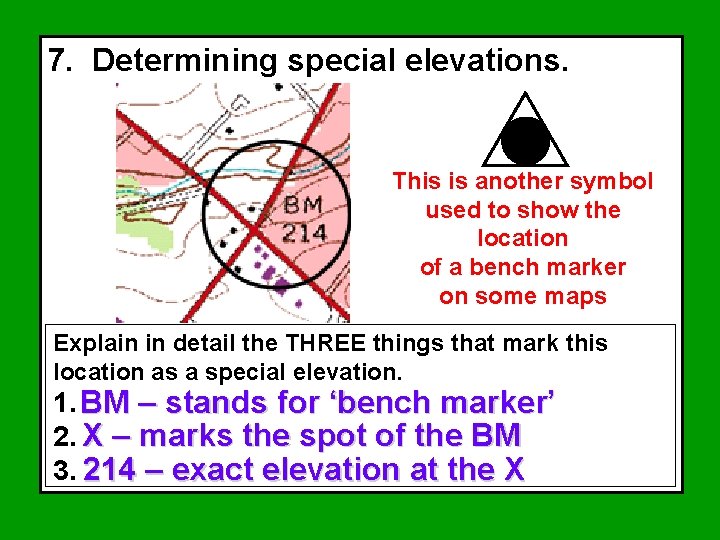
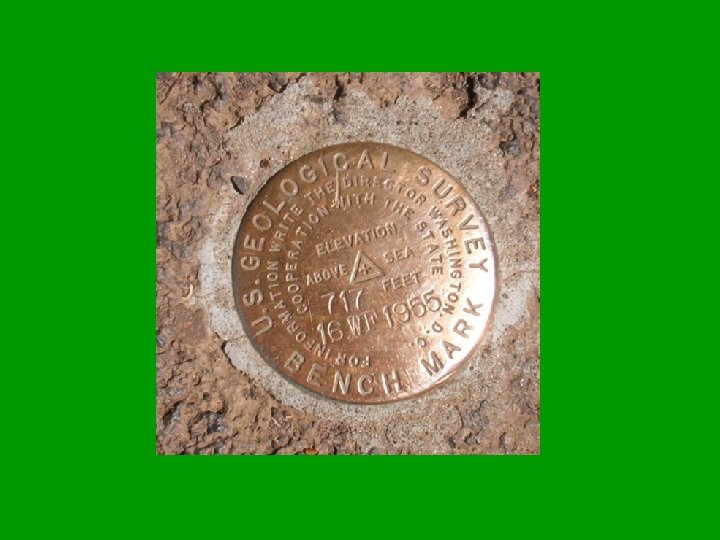
7. Determining special elevations. This is another symbol used to show the location of a bench marker on some maps Explain in detail the THREE things that mark this location as a special elevation. 1. BM – stands for ‘bench marker’ 2. X – marks the spot of the BM 3. 214 – exact elevation at the X
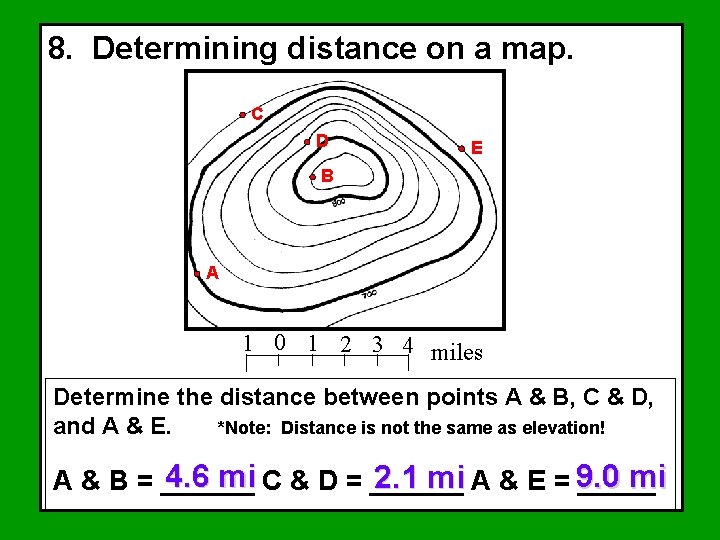
8. Determining distance on a map. C D E B A 1 0 1 2 3 4 miles Determine the distance between points A & B, C & D, and A & E. *Note: Distance is not the same as elevation! 4. 6 mi C & D = ______ mi 2. 1 mi A & E = 9. 0 A & B = ______
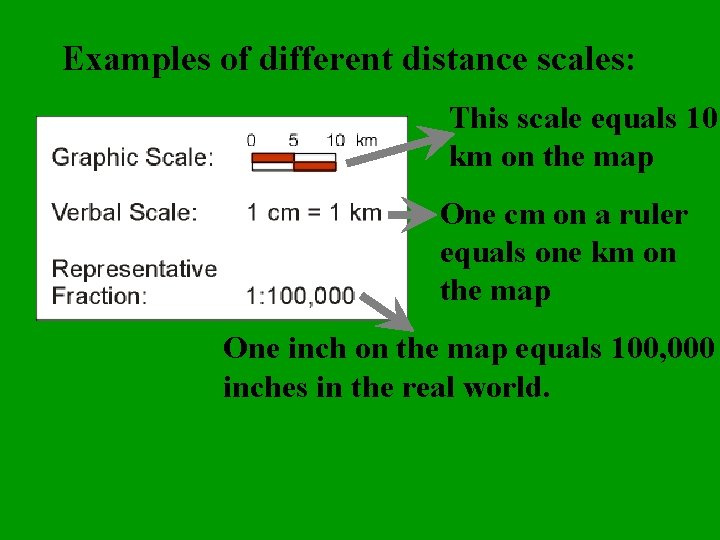
Examples of different distance scales: This scale equals 10 km on the map One cm on a ruler equals one km on the map One inch on the map equals 100, 000 inches in the real world.
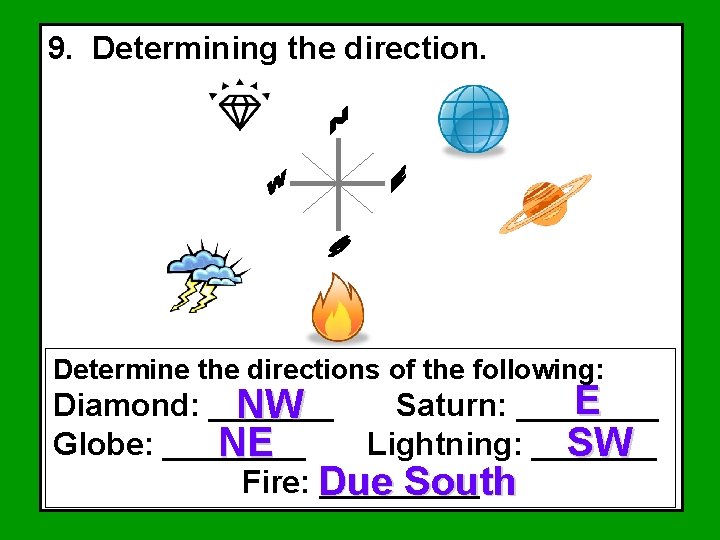
9. Determining the direction. Determine the directions of the following: E Diamond: _______ Saturn: ____ NW Globe: ____ Lightning: _______ NE SW Fire: Due _____ South
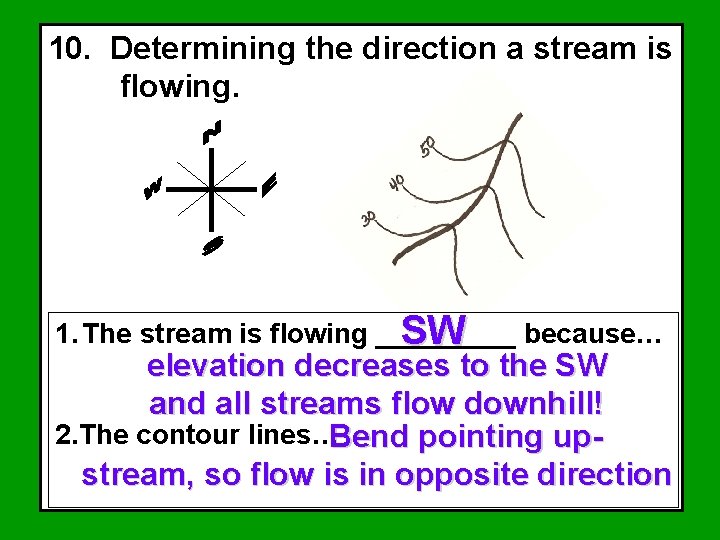
10. Determining the direction a stream is flowing. 1. The stream is flowing _____ SW because… elevation decreases to the SW and all streams flow downhill! 2. The contour lines…Bend pointing upstream, so flow is in opposite direction
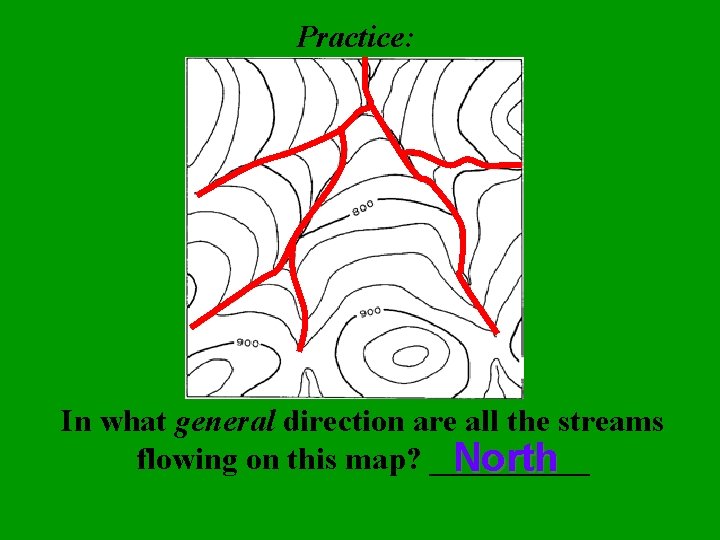
Practice: In what general direction are all the streams flowing on this map? _____ North
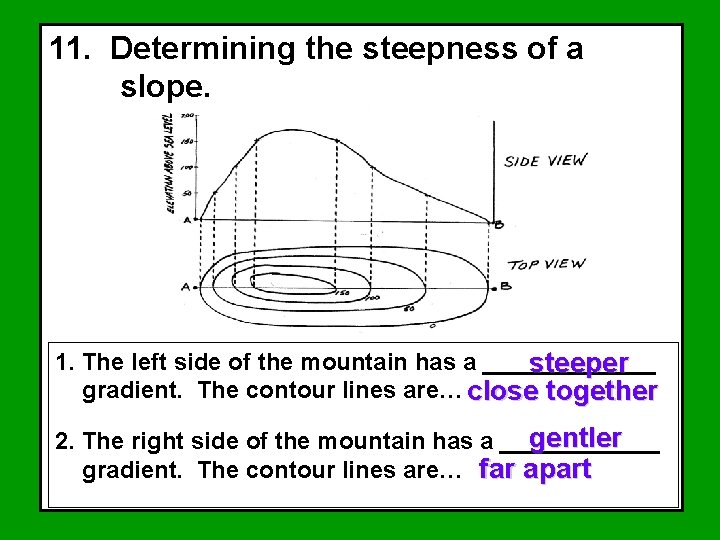
11. Determining the steepness of a slope. 1. The left side of the mountain has a _______ steeper gradient. The contour lines are… close together gentler 2. The right side of the mountain has a ______ gradient. The contour lines are… far apart
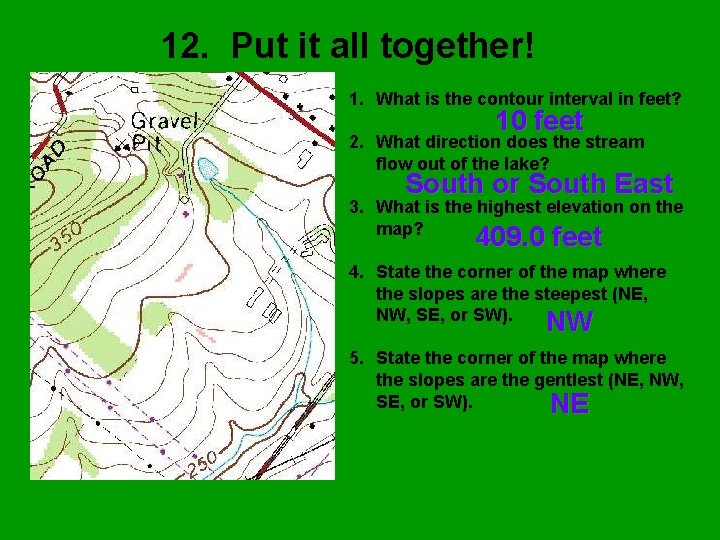
12. Put it all together! 1. What is the contour interval in feet? 10 feet 2. What direction does the stream flow out of the lake? South or South East 3. What is the highest elevation on the map? 409. 0 feet 4. State the corner of the map where the slopes are the steepest (NE, NW, SE, or SW). NW 5. State the corner of the map where the slopes are the gentlest (NE, NW, SE, or SW). NE
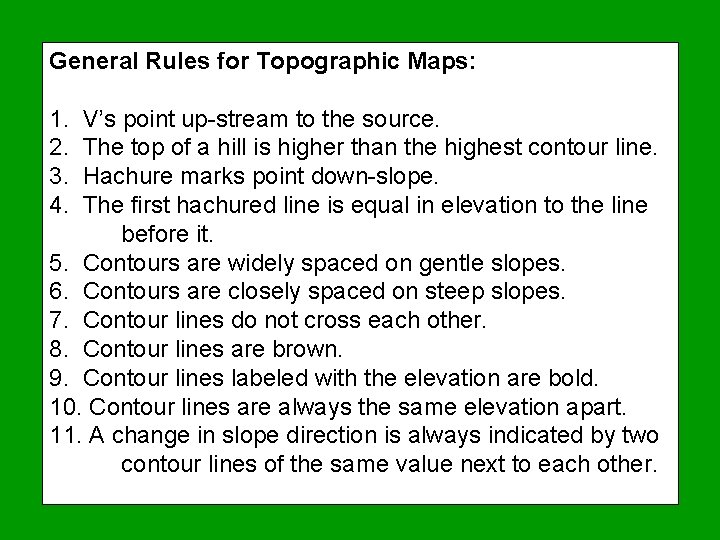
General Rules for Topographic Maps: 1. 2. 3. 4. V’s point up-stream to the source. The top of a hill is higher than the highest contour line. Hachure marks point down-slope. The first hachured line is equal in elevation to the line before it. 5. Contours are widely spaced on gentle slopes. 6. Contours are closely spaced on steep slopes. 7. Contour lines do not cross each other. 8. Contour lines are brown. 9. Contour lines labeled with the elevation are bold. 10. Contour lines are always the same elevation apart. 11. A change in slope direction is always indicated by two contour lines of the same value next to each other.
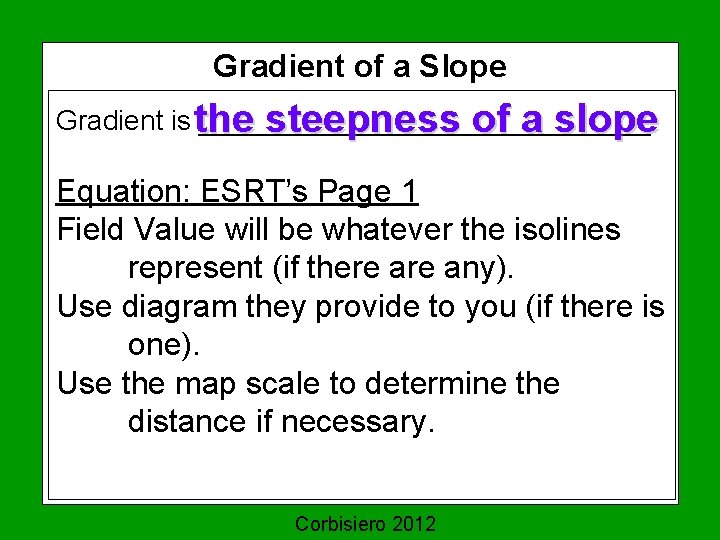
Gradient of a Slope Gradient is the _______________ steepness of a slope Equation: ESRT’s Page 1 Field Value will be whatever the isolines represent (if there any). Use diagram they provide to you (if there is one). Use the map scale to determine the distance if necessary. Corbisiero 2012
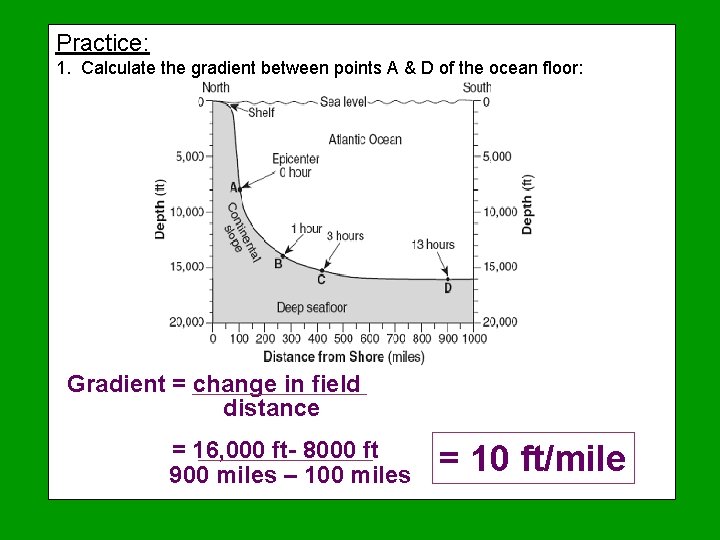
Practice: 1. Calculate the gradient between points A & D of the ocean floor: Gradient = change in field distance = 16, 000 ft- 8000 ft 900 miles – 100 miles = 10 ft/mile
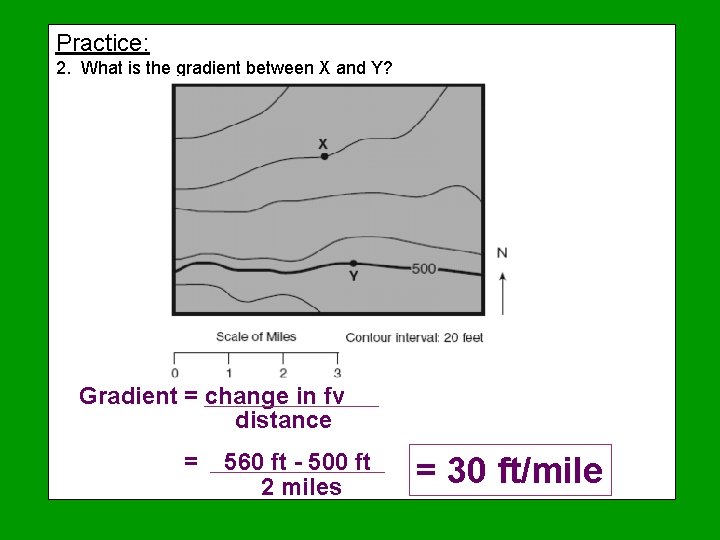
Practice: 2. What is the gradient between X and Y? Gradient = change in fv distance = 560 ft - 500 ft 2 miles = 30 ft/mile
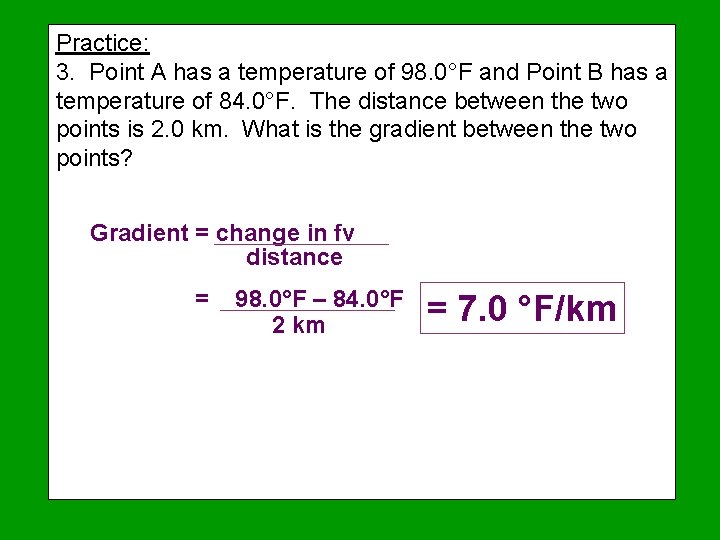
Practice: 3. Point A has a temperature of 98. 0°F and Point B has a temperature of 84. 0°F. The distance between the two points is 2. 0 km. What is the gradient between the two points? Gradient = change in fv distance = 98. 0°F – 84. 0°F 2 km = 7. 0 °F/km
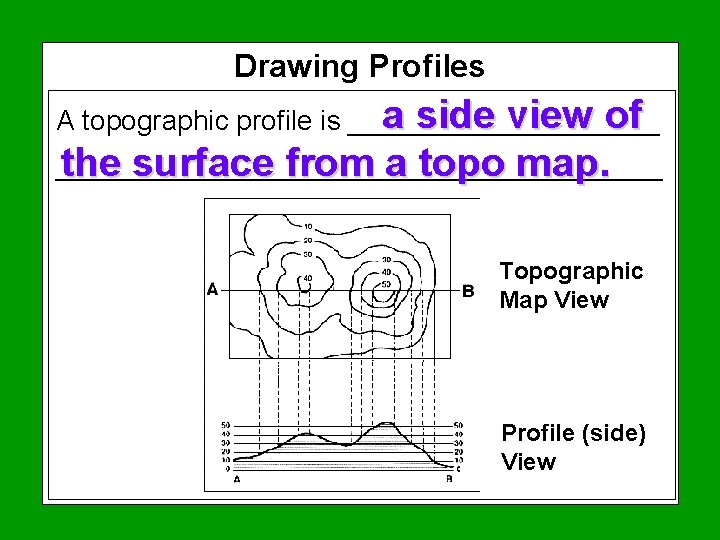
Drawing Profiles a side view of A topographic profile is ______________________________ the surface from a topo map. Topographic Map View Profile (side) View
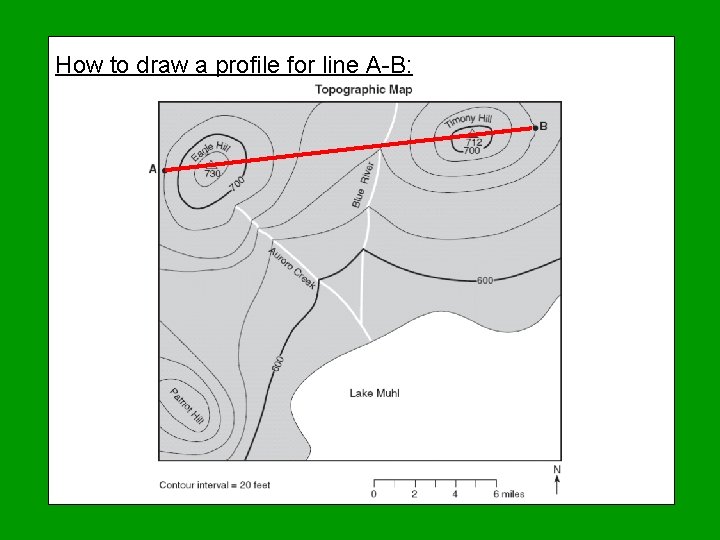
How to draw a profile for line A-B:
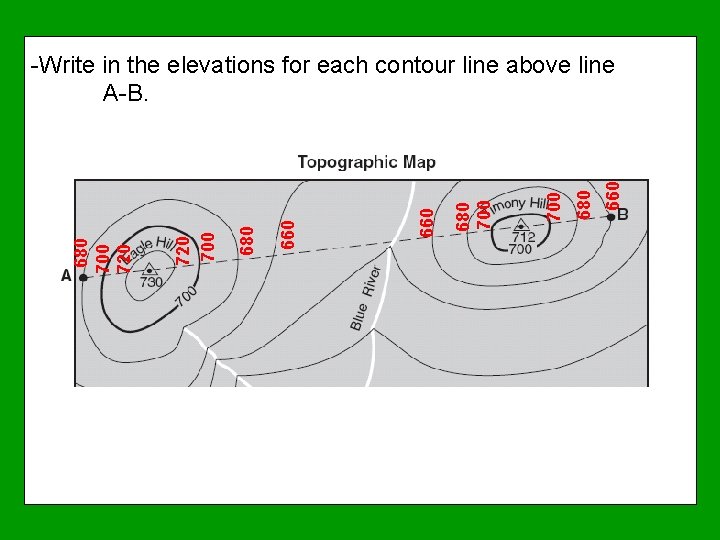
660 680 700 660 680 720 700 680 700 720 -Write in the elevations for each contour line above line A-B.
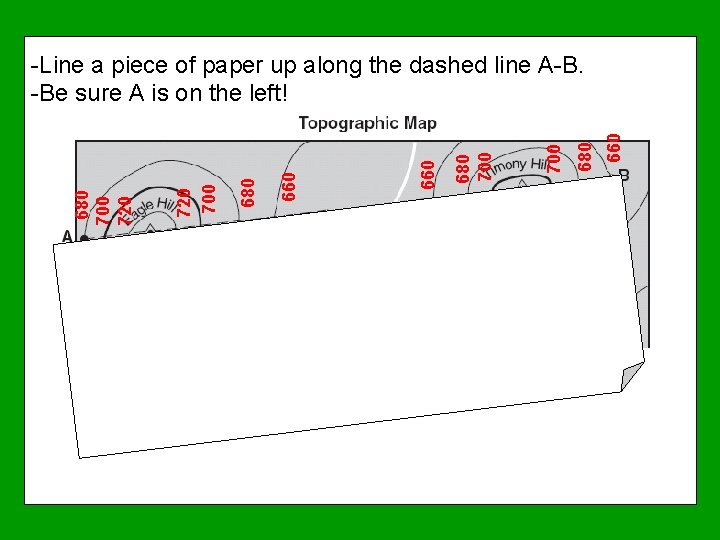
660 680 700 660 680 720 700 680 700 720 -Line a piece of paper up along the dashed line A-B. -Be sure A is on the left!
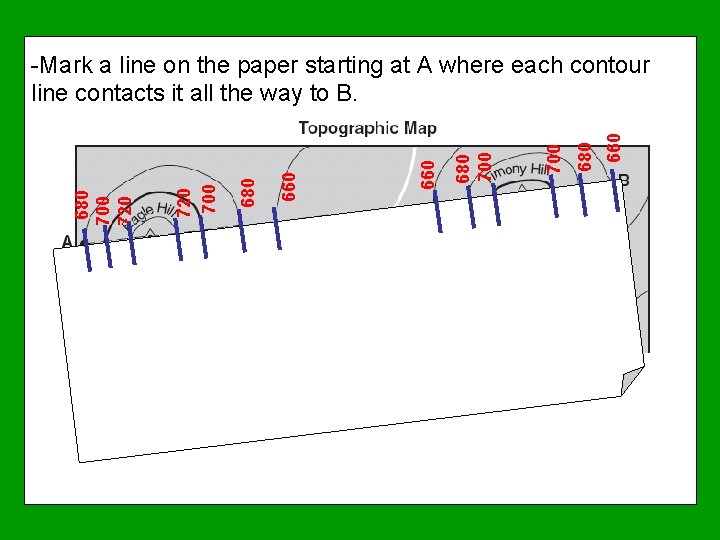
660 680 700 660 680 720 700 680 700 720 -Mark a line on the paper starting at A where each contour line contacts it all the way to B.
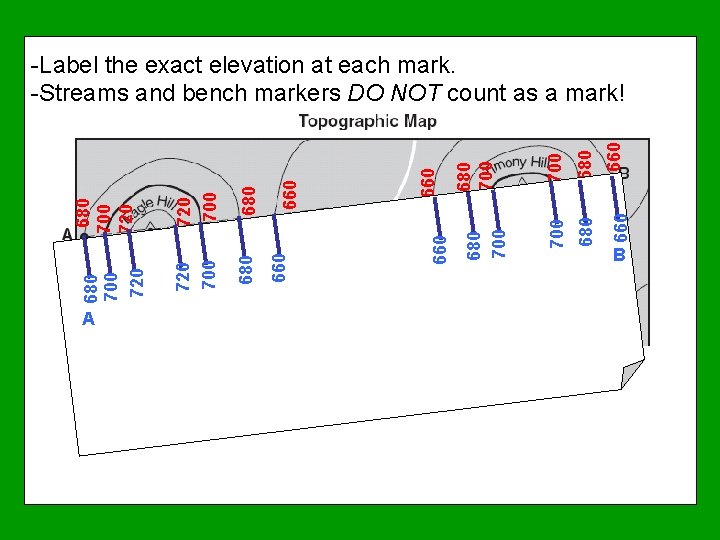
A 660 680 660 700 680 700 660 660 680 720 700 680 700 720 -Label the exact elevation at each mark. -Streams and bench markers DO NOT count as a mark! B
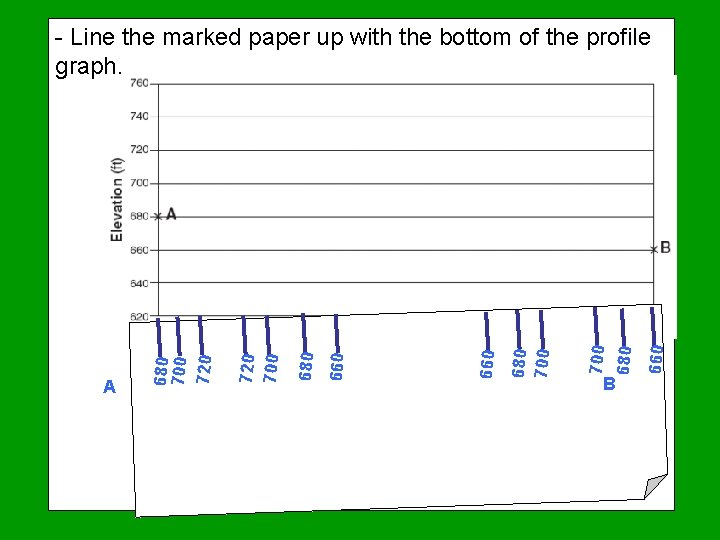
B 660 680 700 660 680 720 700 A 680 700 720 - Line the marked paper up with the bottom of the profile graph.
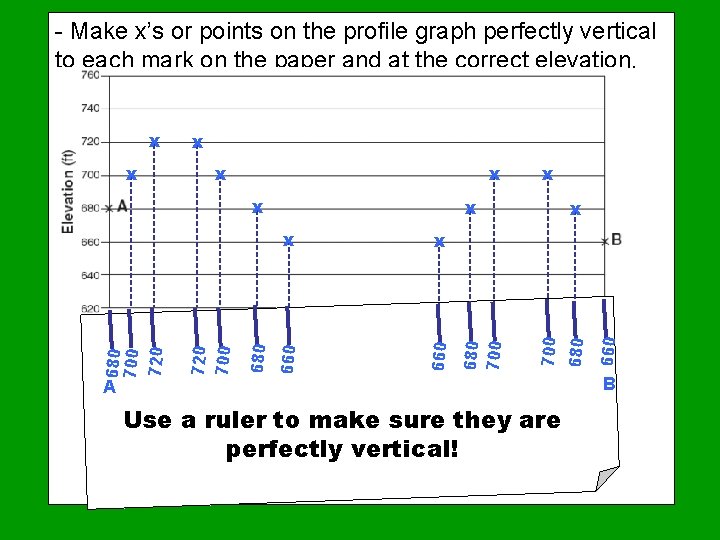
- Make x’s or points on the profile graph perfectly vertical to each mark on the paper and at the correct elevation. x x A Use a ruler to make sure they are perfectly vertical! 660 x 660 680 720 700 680 700 720 x x 680 x x 700 x x 680 700 x B
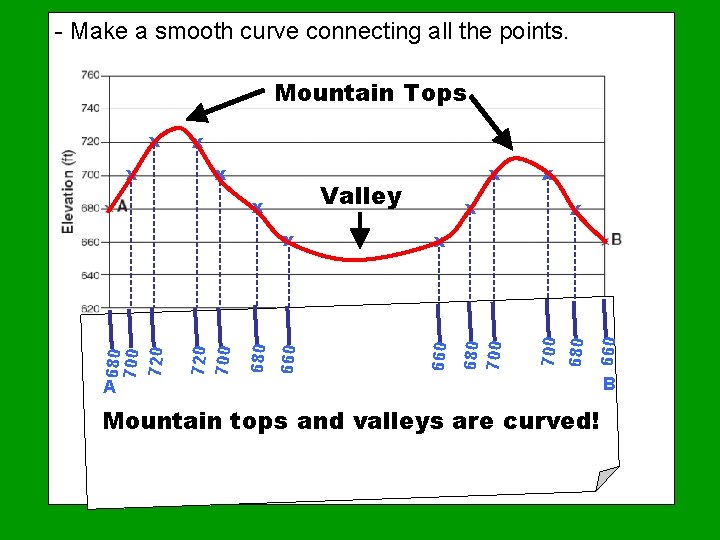
- Make a smooth curve connecting all the points. Mountain Tops x x 660 680 720 700 x x 660 Valley x 680 700 720 x 680 x 700 x x 680 700 x A Mountain tops and valleys are curved! B
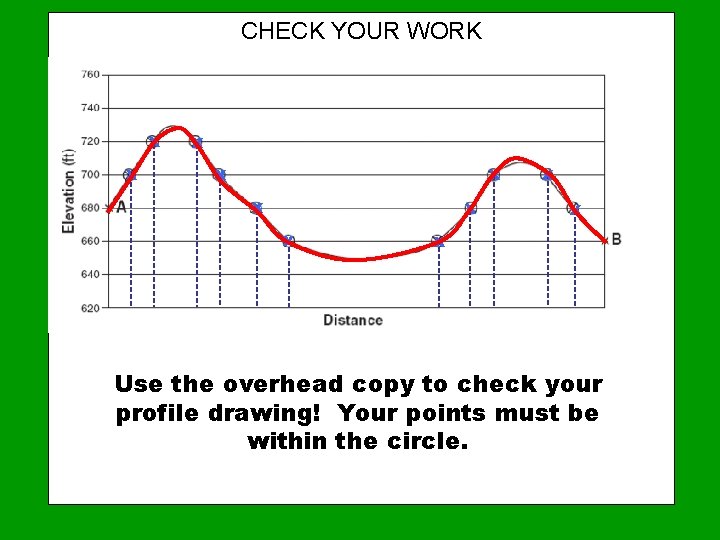
CHECK YOUR WORK x x x Use the overhead copy to check your profile drawing! Your points must be within the circle.

Complete Practice Problems 1 & 2 Check your work with the overhead copies! When they have been approved, work on practice 3.
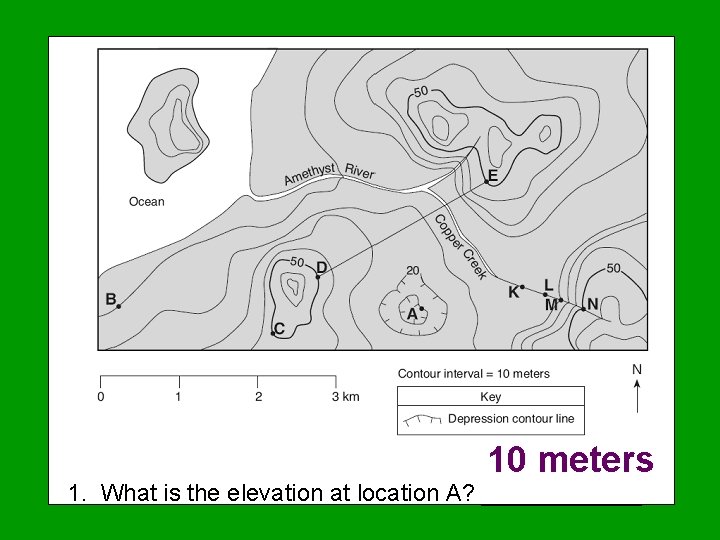
10 meters 1. What is the elevation at location A? ______

2. Calculate the gradient between points B and C. G = change in field = 50 m – 10 m = 20 m/km 2 km distance
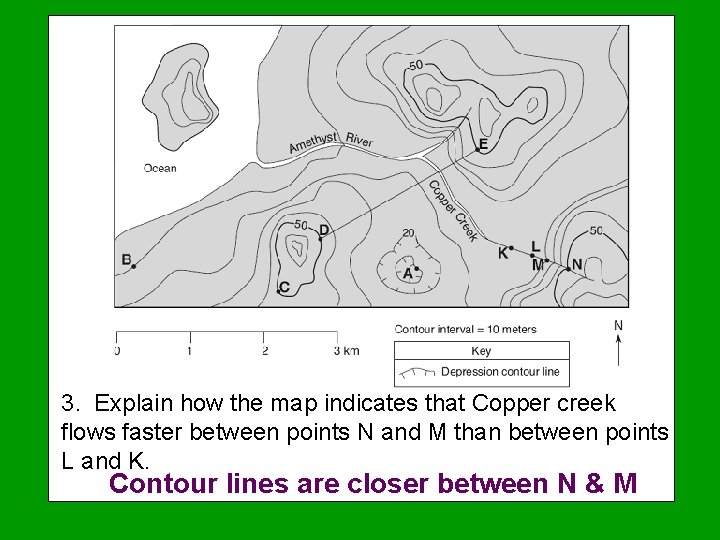
3. Explain how the map indicates that Copper creek flows faster between points N and M than between points L and K. Contour lines are closer between N & M
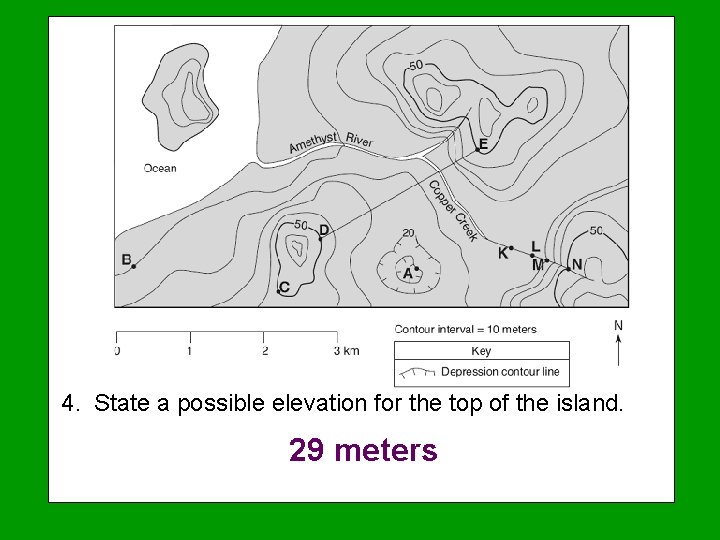
4. State a possible elevation for the top of the island. 29 meters
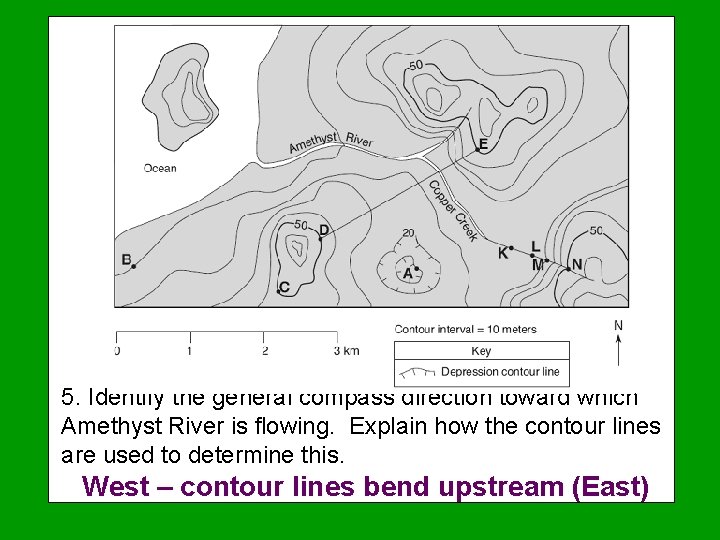
5. Identify the general compass direction toward which Amethyst River is flowing. Explain how the contour lines are used to determine this. West – contour lines bend upstream (East)
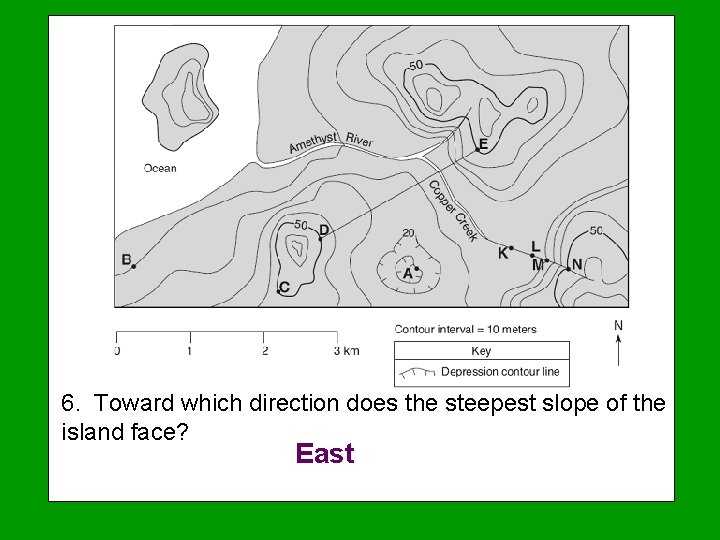
6. Toward which direction does the steepest slope of the island face? East
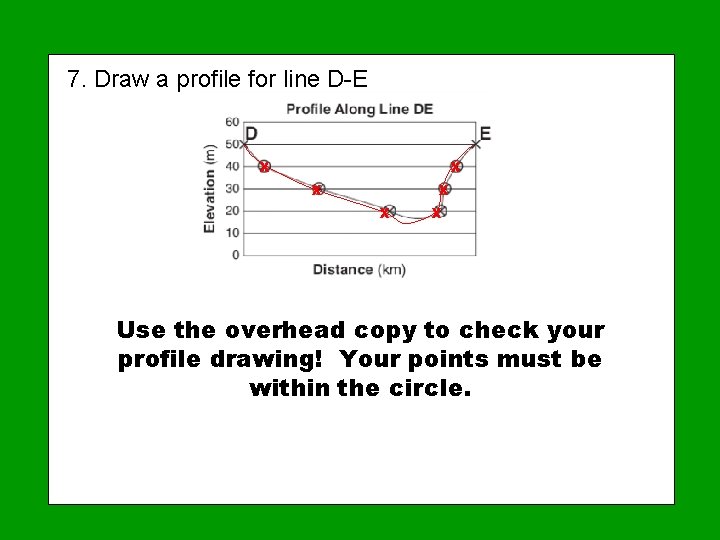
7. Draw a profile for line D-E x x x Use the overhead copy to check your profile drawing! Your points must be within the circle.
The End Music I’m The Map from Dora the Explorer
- Slides: 117