INFOGRAPHIC WHAT IS INFOGRAPHIC An infographic information graphic

 is a representation of information in a")


- Slides: 22
INFOGRAPHIC
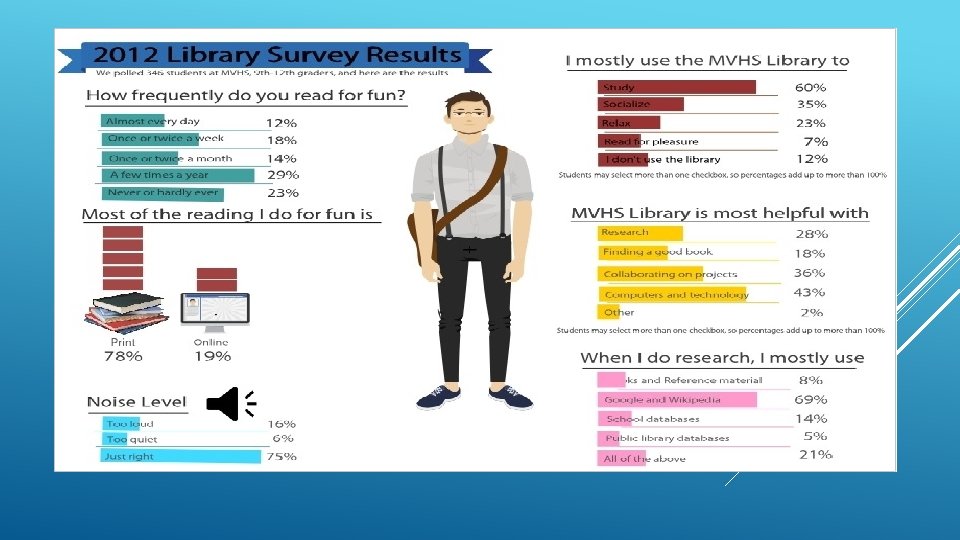
WHAT IS INFOGRAPHIC? An infographic (information graphic) is a representation of information in a graphic format designed to make the data easily understandable at a glance. People use infographics to quickly communicate a message, to simplify the presentation of large amounts of data, to see data patterns and relationships, and to monitor changes in variables over time.
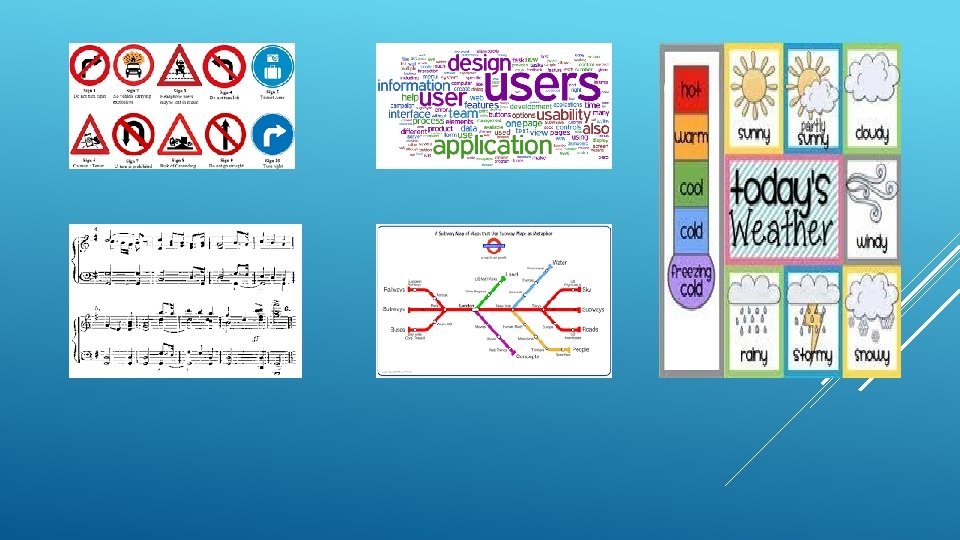
o Traffic signs, subway maps, tag clouds, musical scores and weather charts are just a few examples, among a huge number of possibilities.
12 INFOGRAPHIC TIPS
1. CREATE YOUR INFOGRAPHIC FOR YOUR TARGET AUDIENCE. Ø The way to come up with great infographic idea is to figure out what your audience wants. Ø The infographics with the most traction, most attention, and most virality, are ones that meet your target audience right where they want it most.
2. KEEP IT SIMPLE. Ø One of the advantages of infographics is that they can distill advanced ideas into a simple visual form. Ø An infographic can become needlessly complex, creating a mind-numbing cognitive overload rather than an “Oh, I get it” experience.
3. KEEP IT FOCUSED. Ø Simplicity, discussed above, is ultimately about focus. Don’t just make your infographic a potpourri of facts and figures. Make it a streamlined and focused on a single topic
4. SHOW THINGS VISUALLY. Ø The best infographics are ones that have a good balance of visual information with written information.
5. PROMOTE IT. Ø If you want your infographic to explode in popularity, you will have to promote it. You do so in the same way that you’d promote any other valuable piece of content.
Ø Reach out to influential sources in your niche and ask them to feature your infographic. Ø Make your infographic shareable with social plugins. Ø Ask users to share it
6. MAKE IT EASY TO VIEW. Ø Make sure that the smallest font on your infographic can be seen without too much difficulty.
7. MAKE IT A MANAGEABLE LENGTH AND SIZE. Ø A limit length of 8, 000 pixels. Anything longer, and you’ll start to presume upon your user’s attention span.
8. ADD WHITE SPACE. Ø An infographic is an exercise in graphic design best practice.
9. CREATE A KILLER HEADLINE. Ø This principle is the same as with a great blog article. The infographic doesn’t get any attention if it doesn’t have a great headline.
• They describe the infographic • They grab the user’s attention. • They are short enough to understand at a glance. 70 characters is a good length.
10. FOCUS ON THE FLOW. Ø The greatest strength of an infographic is that it can flow both cognitively and visually. Ø An infographic is like a good story. It has the ability to convey an idea by taking you from one phase to another, sequentially and seamlessly
11. CHECK YOUR FACTS AND FIGURES. Ø Many infographics focus on presenting data. It’s a smart idea. Our minds can process stats and percentages way better when we see them, rather than just look at a number with decimal points and percentage signs.
• Make sure that the statistics themselves are true. • Make sure that your sources are reliable. • Make sure that your graphical representation of the data lines up with the number (if you have both)
12. CITE YOUR SOURCES. Ø use sources that are as up-to-date as possible. Using old stats, especially in an industry where information is always changing, makes you seem out of touch. Ø You can also cite sources within the body of the infographic, as long as it doesn’t distract from the flow and visual of the infographic.