Graphic representations in statistics Graphic representation and graphic


")


 sector or inwardly-column")


 is used for illustration of homogeneous,")


 of connection can")
 Reverse")
 – with the increasing of one")


")


- Slides: 91
Graphic representations in statistics
Graphic representation and graphic analysis n n n Graphic representations are used for evident representation of statistical quantities they allow to analyze them deeper. The graphic representation can be built both after absolute and after relative quantities. Using the graphic method, it is important to know that the type of graphic representation must strictly answer the maintenance of every index.
Statistical Terms n n n n Mean: the average of the data sensitive to outlying data Median: the middle of the data not sensitive to outlying data Mode: most commonly occurring value Range: the difference between the largest observation and the smallest Interquartile range: the spread of the data commonly used for skewed data Standard deviation: a single number which measures how much the observations vary around the mean Symmetrical data: data that follows normal distribution (mean=median=mode) report mean & standard deviation & n Skewed data: not normally distributed (mean median mode) report median & IQ Range
Source data and graph types Relative quantities: intensive indices n extensive indices n index of correlation n index of evidence n
Measures of Frequency of Events Prevalence Incidence The number of new events (e. g. death or a particular disease) that occur during a specified period Incidence Rate A term related to incidence that reports the number of new events The number of persons in the population affected by a disease at a specific time divided by the number of persons in the population
Measures of Association n Relative risk and cohort studies - The relative risk (or risk ratio) is defined as the ratio of the incidence of disease in the exposed group divided by the corresponding incidence of disease in the unexposed group. n Odds ratio and case-control studies - The odds ratio is defined as the odds of exposure in the group with disease divided by the odds of exposure in the control group.
Case-control studies Relative risk and cohort studies Measures of Association Odds ratio
Measures of Association
Absolute risk The relative risk and odds ratio provide a measure of risk compare d with a standard. Attributable risk or Risk difference is a measure of absolute risk. It represents the excess risk of disease in those exposed taking into account the background rate of disease. Number needed Population Attributable to treat (NNT) The number Risk is used of patients to describe the who would excess rate of need to be disease in the treated to total study prevent one population of adverse exposed and outcome is often used to non-exposed present the individuals results of that is randomized attributable to trials. the exposure.
Relative Values As a result of statistical research during processing of the statistical data of disease, mortality rate, lethality, etc. absolute numbers are received, which specify the number of the phenomena. Though absolute numbers have a certain cognitive values, but their use is limited.
RELATIVE INDICES
Relative Values In order to acquire a level of the phenomenon, for comparison of a parameter in dynamics or with a parameter of other territory it is necessary to calculate relative values (parameters, factors) which represent result of a ratio of statistical numbers between itself. The basic arithmetic action at subtraction of relative values is division.
The following kinds of relative parameters are used in medical statistics Correlation indices Extensive indices Intensive indices Relative intensity indices Visualizati on indices
The extensive parameter, or a parameter of distribution, characterizes a parts of the phenomena (structure), that is it shows, what part from the general number of all diseases (died) is made with this or that disease which enters into total.
Using this parameter, it is possible to determine the structure of patients according to age, social status, etc. It is accepted to express this parameter in percentage, but it can be calculated and in parts per thousand case when the part of the given disease is small and at the calculation in percentage it is expressed as decimal fraction, instead of an integer.
Rejection and non-rejection region of F test Distribution of F F< F k-1, n-k, 1 -α non-rejection region P value F< F k-1, n-k, 1 -α Rejection region F k-1, n-k, 1 -α
n General formula of the calculation is the following: phenomenon× 100 (1000; 100 000) environment
Parameters applied for analysis of changes of a phenomenon n Pure gain – difference between next and previous numbers of dynamic lines.
Source data and graph types n Intensive quantities - 4 types of diagrams: - column linear mapgram mapdiagram
Source data and graph types Extensive quantities: (they characterize the structure) sector or inwardly-column diagram. n Indices of correlation: the same diagrams, that for intensive quantities (column and linear diagrams, mapgram, mapdiagram). n
Source data and graph types Indices of evident: the principles of graphic representation are the same, that for intensive quantities. n Column diagrams – for illustration of homogeneous, but not interconnected indices. They represent the static’s of the phenomena. n
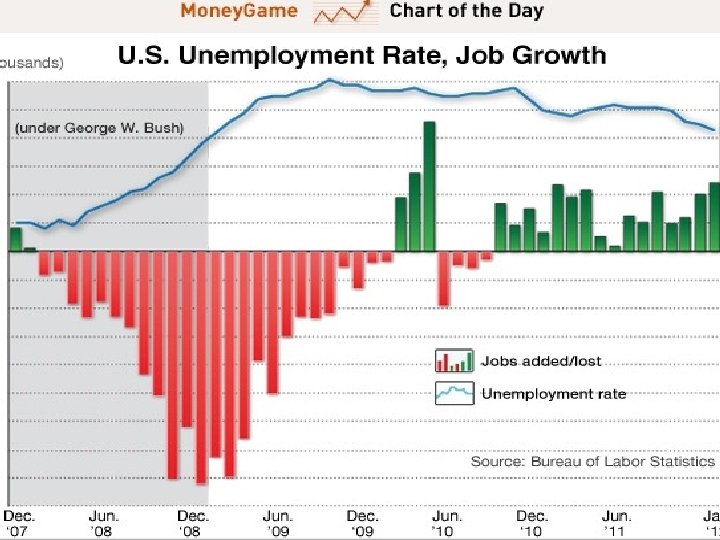
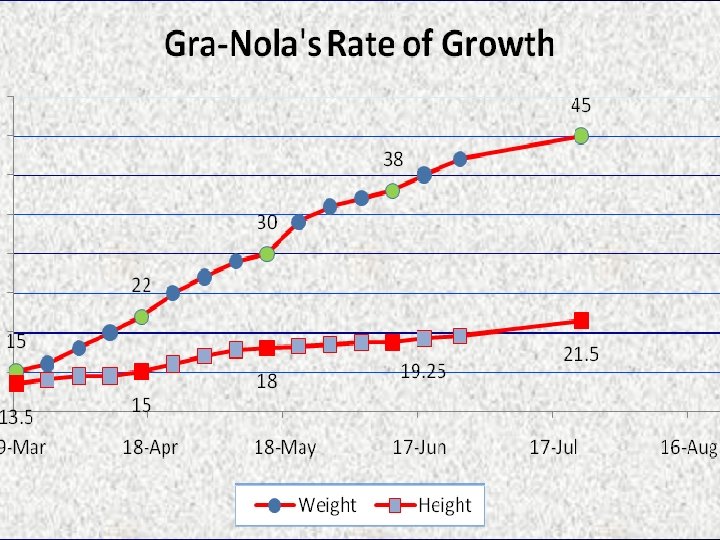
Source data and graph types n n Linear diagrams – for the representations of dynamics of that or other phenomenon (a typical example is a temperature curve, change of birth-rate, death rate level). Radial diagram – is built on the system of polar co-ordinates of the phenomenon representations during the close cycle of time (days, week, year). For example: structure of morbidity or cause of mortality, where in a circle every cause of mortality, depending on its percent occupies a certain sector.
Source data and graph types Mapgram is the representations of statistical quantities on a geographical map (or scheme of card). Absolute and other indices can be marked. n Mapdiagram is the representations of different types of diagrams on the geographical map. n
Common rules of construction of graphs every graphic representation must have a name, where its contest, time and place is mentioned;
Common rules of construction of graphs it must be built to a certain scale;
Common rules of construction of graphs for every graphic representation explanation of colored application must be given (as conditional denotations or shading).
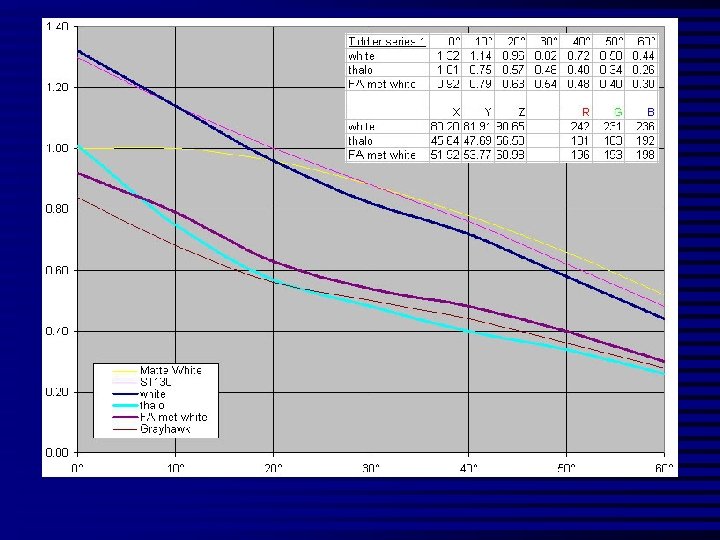
Types of graphs n n Linear diagram is used for illustration of the frequency phenomena which changes with time, that for the representations of the phenomena dynamics. The base of this diagram is the rectangular system of co-ordinates. For example: on abscising axis – Х - segments are put aside on a scale, on a y-axis – indices of morbidity (х : y = 4: 3).
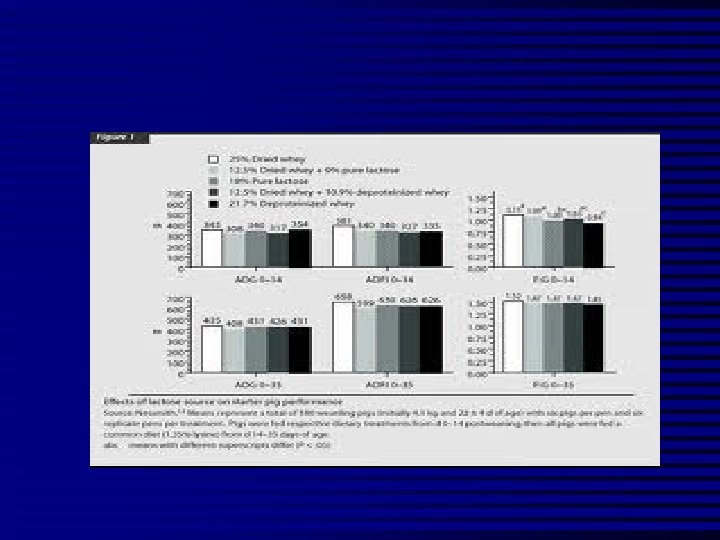
Types of graphs n n Column diagram (rectangular) is used for illustration of homogeneous, but not connected between themselves intensive indices. It represents dynamics or static of the phenomena. At construction of this kind of diagram columns are drawn, the height of which must suit the quantities of the represented indices taking the scale into account. It is necessary to take into account that the wideness of all the columns and also the distance between them must be identical and arbitrary. Columns on a diagram can be vertical or horizontal. For example: growth of number of beds in permanent establishment from 1990 to 2003 year.
Types of graphs n n Sector diagram is used for illustration of extensive indices, which characterize the structure of the phenomenon, thus they give imagination about specific gravity of the phenomena in common. The circle is taken as 100 % (if indices are shown in %) thus 1 % equal to 3, 60 circumferences. With the help of protractor the segments, which suit the size of an index are put aside on a circle.
Types of graphs Radial diagram is the type of the linear diagram built on polar co-ordinates. n At the construction of radial diagram in the role of abscising axis - Х is the circle divided on the identical number of parts, according to the spans of time of that or another cycle. n
Types of graphs n Linear diagrams are made according to system of rectangular coordinates where the horizontal scale is postponed at the left - to the right on a line of abscissas (X), and vertical - from below - upwards on a line which is called as ordinate (Y). The obligatory requirement of construction of any schedule is scale, that is the image on drawing should be reduced, compared with corresponding figures.
Types of graphs n Long-pillar diagrams are for comparison of several sizes. It is possible to rectangular which represent sizes, it is possible to place also on the plane diagram not on a vertical, and across and then there will be a tape diagram (Fig. 4). In some cases the image of sizes as tapes (stirs) is more convenient, than as columns because it is easier to sign with each tape by a horizontal inscription.
Quantitative types of connection n functional one is the connection, at which the strictly defined value of the second sign answers to any value of one of the signs (for example, the certain area of the circle answers to the radius of the circle)
Quantitative types of connection n correlation - connection at which a few values of one sign answer to the value of every average size of another sign associated with the first one (for example, it is known that the height and mass of man’s body are linked between each other; in the group of persons with identical height there are different valuations of mass of body, however, these valuations of body mass varies in certain sizes – round their average size).
Correlative connection n n Correlative connection foresees the dependence between the phenomena, which do not have clear functional character. Correlative connection is showed up only in the mass of supervisions that is in totality. The establishment of correlative connection foresees the exposure of the causal connection, which will confirm the dependence of one phenomenon on the other one.
Correlative connection n n Correlative connection by the direction (the character) of connection can be direct and reverse. The coefficient of correlation, that characterizes the direct communication, is marked by the sign plus (+), and the coefficient of correlation, that characterizes the reverse one, is marked by the sign minus (-). By the force the correlative connection can be strong, middle, weak, it can be full and it can be absent.
Estimation of correlation by coefficient of correlation Force of connection Complete Line (+) Reverse (-) +1 Strong From +1 to +0, 7 Average from +0, 7 to +0, 3 from – 0, 7 to – 0, 3 Weak No connection From -1 to -0, 7 from +0, 3 to 0 from – 0, 3 to 0 0 0
Types of correlative connection By direction direct (+) – with the increasing of one sign increases the middle value of another one; n reverse (-) – with the increasing of one sign decreases the middle value of another one; n
Types of correlative connection By character n rectilinear - relatively even changes of middle values of one sign are accompanied by the equal changes of the other (arterial pressure minimal and maximal) n curvilinear – at the even change of one sing there can be the increasing or decreasing middle values of the other sign.
Terms Used To Describe The Quality Of Measurements Reliability is variability between subjects divided by inter-subject variability plus measurement error. n Validity refers to the extent to which a test or surrogate is measuring what we think it is measuring. n
Measures Of Diagnostic Test Accuracy n n Sensitivity is defined as the ability of the test to identify correctly those who have the disease. Specificity is defined as the ability of the test to identify correctly those who do not have the disease. Predictive values are important for assessing how useful a test will be in the clinical setting at the individual patient level. The positive predictive value is the probability of disease in a patient with a positive test. Conversely, the negative predictive value is the probability that the patient does not have disease if he has a negative test result. Likelihood ratio indicates how much a given diagnostic test result will raise or lower the odds of having a disease relative to the prior probability of disease.
Measures Of Diagnostic Test Accuracy
Expressions Used When Making Inferences About Data n Confidence Intervals - The results of any study sample are an estimate of the true value in the entire population. The true value may actually be greater or less than what is observed. n n n Type I error (alpha) is the probability of incorrectly concluding there is a statistically significant difference in the population when none exists. Type II error (beta) is the probability of incorrectly concluding that there is no statistically significant difference in a population when one exists. Power is a measure of the ability of a study to detect a true difference.
Multivariable Regression Methods n n Multiple linear regression is used when the outcome data is a continuous variable such as weight. For example, one could estimate the effect of a diet on weight after adjusting for the effect of confounders such as smoking status. Logistic regression is used when the outcome data is binary such as cure or no cure. Logistic regression can be used to estimate the effect of an exposure on a binary outcome after adjusting for confounders.
Survival Analysis n n Kaplan-Meier analysis measures the ratio of surviving subjects (or those without an event) divided by the total number of subjects at risk for the event. Every time a subject has an event, the ratio is recalculated. These ratios are then used to generate a curve to graphically depict the probability of survival. Cox proportional hazards analysis is similar to the logistic regression method described above with the added advantage that it accounts for time to a binary event in the outcome variable. Thus, one can account for variation in follow-up time among subjects.
Kaplan-Meier Survival Curves
Why Use Statistics?
Descriptive Statistics Identifies patterns in the data n Identifies outliers n Guides choice of statistical test n
Percentage of Specimens Testing Positive for RSV (respiratory syncytial virus)
Descriptive Statistics
Distribution of Course Grades
Describing the Data with Numbers Measures of Dispersion • • • RANGE STANDARD DEVIATION SKEWNESS
Measures of Dispersion • RANGE highest to lowest values STANDARD DEVIATION • how closely do values cluster around the mean value SKEWNESS • refers to symmetry of curve • • •
Measures of Dispersion • RANGE highest to lowest values STANDARD DEVIATION • how closely do values cluster around the mean value SKEWNESS • refers to symmetry of curve • • •
Measures of Dispersion • • • RANGE • highest to lowest values STANDARD DEVIATION • how closely do values cluster around the mean value SKEWNESS • refers to symmetry of curve
The Normal Distribution n n Mean = median = mode Skew is zero 68% of values fall between 1 SD 95% of values fall between 2 SDs Mean, Median, Mode . 1 2
Statistics graph Data recorded in surveys are displayed by a statistical graph. There are some specific types of graphs to study in the data statistics graphs. There are eleven type of graphs used in Data statistics graphs
Type of graphs n n n Box plot, Stem and leaf plot, Frequency polygon, Scatter plot, Line graph, Bar graph, Histogram, Pictograph, Map chart, Pie chart, Line plot.
Introduction to types of statistical graphs: Let us see some content about types of statistical graphs. The statistical data's are used to represent by some graphs format. The statistical data's are either continuous or discontinuous. There are more types of statistical graphs. Each and every graph is used in various purposes. The graphs and charts are commonly used by the business trends.
Types of Statistical Graphs: There are several types of statistical data. Each graph is used to show the data levels of the business without the any calculations. The types of statistical graphs are following below: n Statistical graph 1: Line graph. n Statistical graph 2: Bar graph. n Statistical graph 3: Pie chart. n Statistical graph 4: Histogram. n Statistical graph 5: Scatter plot. These are the types of the statistical graphs used to draw the statistical data's.
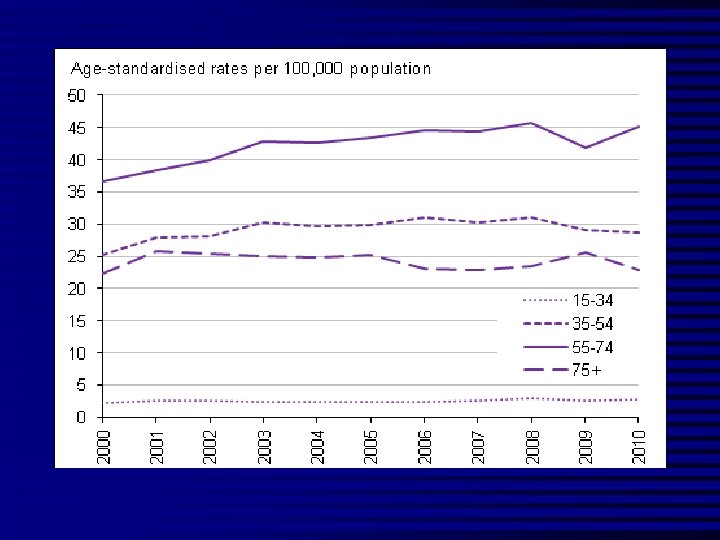
Statistical graph 1: Line graph: The line graph is used to conspire the continuous data. The data's are plotted as points. The points are joined by the lines. This graph is used to compare multiple data sets. But the line graph only using continuous data's.
This is the symbolization of the line graph.
Linear diagram
Linear diagram
Statistical graph 2: Bar graph: The bar graph displays discrete data in disconnect columns. A double bar graph can be used to evaluate two data sets. It is visually muscular. It is used to easily evaluate two or three data sets. It uses only discrete data.
This is the symbolization of the bar graph.
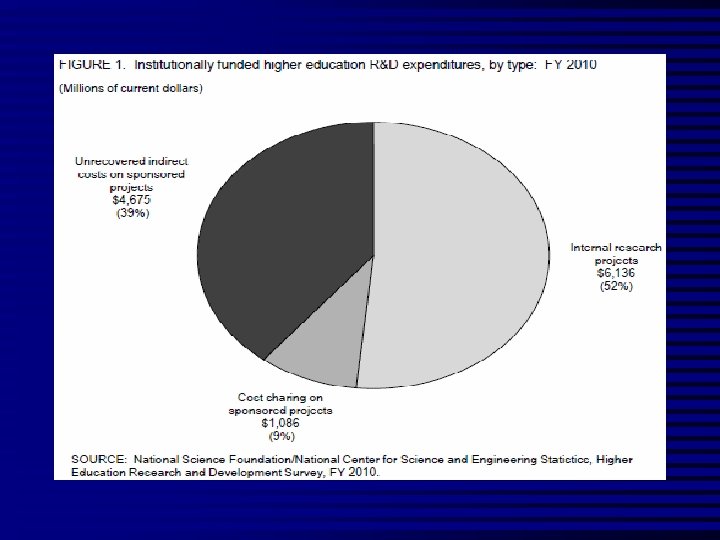
Statistical graph 3: pie chart: The pie chart displays data as a percentage of the whole. It displays the percentage of each category. But, it has no exact data's.
This is the symbolization of the pie chart.
Sector diagram
Statistical graph 4: Histogram: The histogram shows the continuous data in order to columns. It is same as the line graph but it is represented as in column format.
This is the histogram for the given statistical data.
Graphical Representation of Statistical Data A histogram is a two -dimensional graphical representation of a continuous frequency distribution. A histogram is a special type of bar diagram.
Histogram A histogram is a way of summarizing data pictorially. Histograms show the distribution of the data. They are constructed from a frequency table, which is a summary of the data. The general format for a histogram is a vertical scale that demonstrates frequencies and a horizontal scale that represents the individual intervals, sometimes called classes. Bars are used to represent each individual interval with the height of the bar corresponding to the frequency.
A histogram is drawn according to the steps given below. Prepare a grouped frequency distribution table of the given data. n Show class-limits on X-axis with a suitable scale. n Show frequencies on Y-axis with a suitable scale. n Draw rectangles having base equal to the class limits and heights proportional to the frequencies. These rectangles should be joined to each other. n
A frequency distribution table is shown below Class ( Cost of saree in Frequency ( No. of Rs. ) sarees sold in a week) 100 – 200 12 200 – 300 28 300 – 400 37 400 – 500 23 500 – 600 20 600 – 700 14 700 – 800 09
Histogram
The following points can be inferred from the above histogram. n It is not necessary that the scale on the X-axis and the Y-axis be the same. Different scales may be taken on the axes considering the nature of the data, size of the paper etc. A histogram should look neat and attractive. n The position of origin on the Y-axis is according to the scale, which is not so on the X - axis. This is indicated by drawing √mark on
n The X-axis near the origin. If necessary, the mark can be made on the Y-axis or on both axes. n In a histogram, it is necessary that the adjacent rectangles be attached to each other. Therefore, if the given classes are not continuous, it is necessary to make them continuous e. g. ; if the classes are 2 to 5, 6 to 9, 10 to 13, …. It should be as 1. 5 to 5. 5, 5. 5 to 9. 5, 9. 5 to 13. 5…
Statistical graph 5: Scatter plot: The scatter pot shows the relationship between two factors of the experiment. It displays the relationship between two data's.
This is the example of the scatter plot.
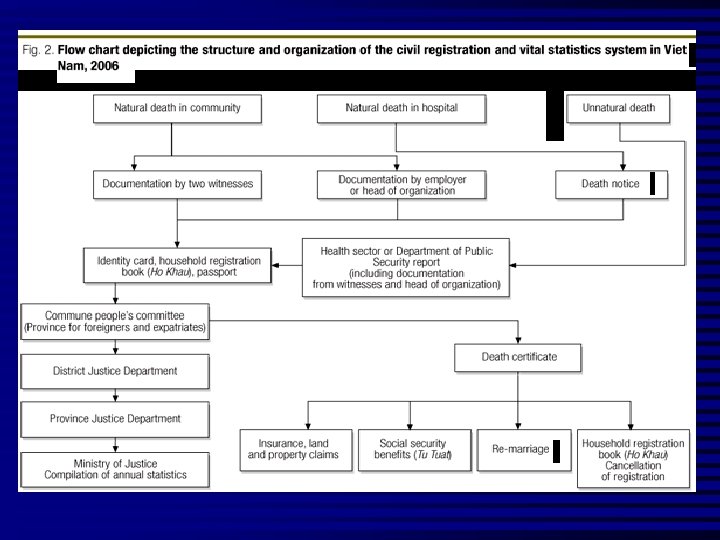
WHAT IS A CARTOGRAM? A cartogram is a colored map that gives a graphical representation of statistical data. It is used for an immediate view of a phenomenon or behavior.
CARTOGRAM
CARTOGRAM