
WHAT IS AN INFOGRAPHIC Data visualizations that present



- Slides: 12
WHAT IS AN INFOGRAPHIC • Data visualizations that present complex information quickly and clearly. • Visual representation of data, information, and/or knowledge • Visual elements - colors, graphics, icons, signs, maps, etc. • Content elements – text, facts, statistics, time frames, references • Knowledge – the facts and conclusion to convey the overall message or story
Introduction to Infographics • How does it work? • Utilizing available data, information, and/or knowledge the designer will create a visual representation. • Who’s doing it? • Almost everyone - companies, educational institutions, nonprofits, etc.
Introduction to Infographics • Why is it significant? • Conveys visual representation of relevant data • Engages audience • What are the downsides? • Data can be skewed and/or have a margin of error which would make the data irrelevant. Data is constantly changing on a daily basis, so the information presented could be outdated.
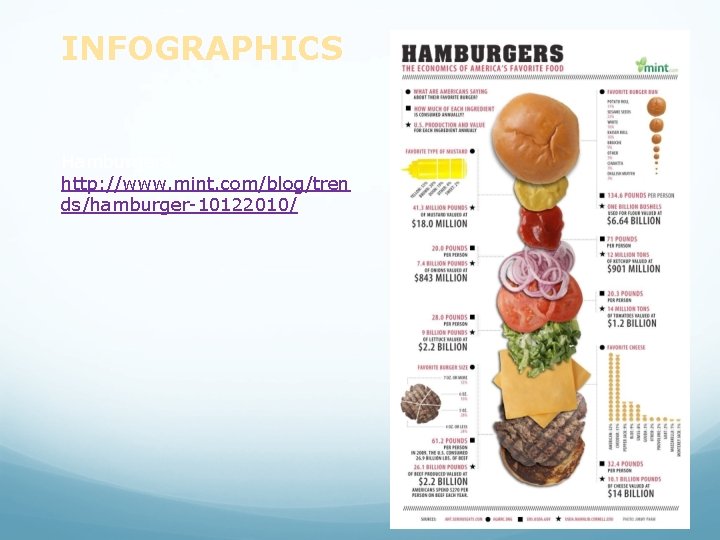
INFOGRAPHICS Hamburgers: http: //www. mint. com/blog/tren ds/hamburger-10122010/
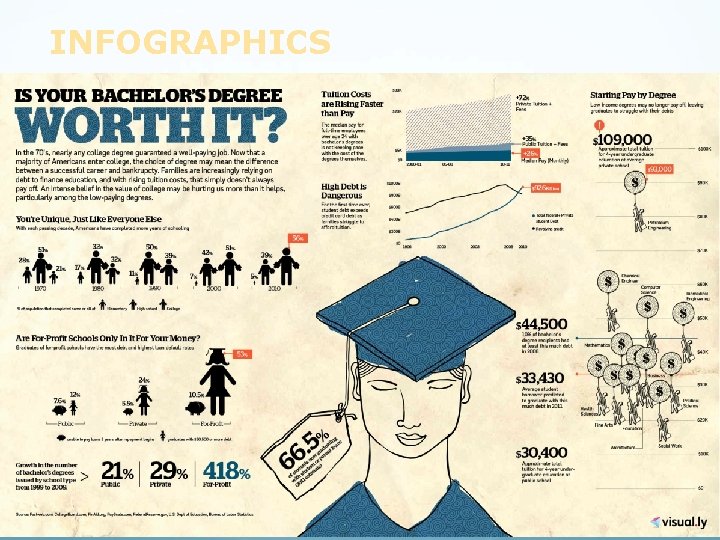
INFOGRAPHICS
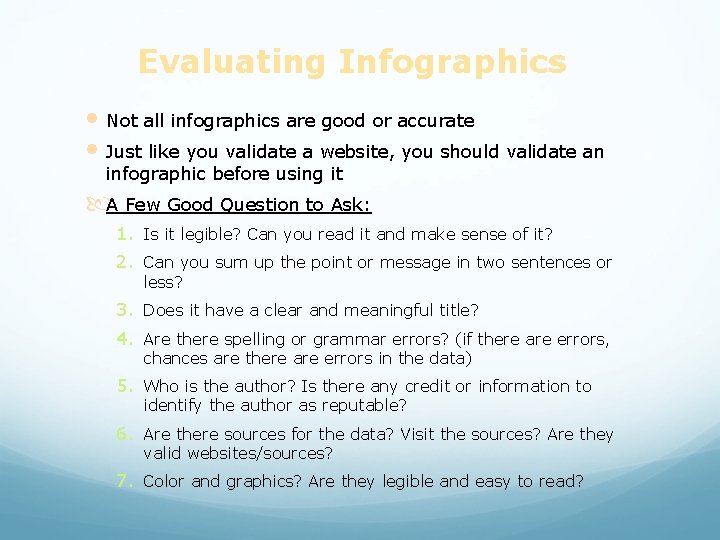
Evaluating Infographics • Not all infographics are good or accurate • Just like you validate a website, you should validate an infographic before using it A Few Good Question to Ask: 1. Is it legible? Can you read it and make sense of it? 2. Can you sum up the point or message in two sentences or less? 3. Does it have a clear and meaningful title? 4. Are there spelling or grammar errors? (if there are errors, chances are there are errors in the data) 5. Who is the author? Is there any credit or information to identify the author as reputable? 6. Are there sources for the data? Visit the sources? Are they valid websites/sources? 7. Color and graphics? Are they legible and easy to read?
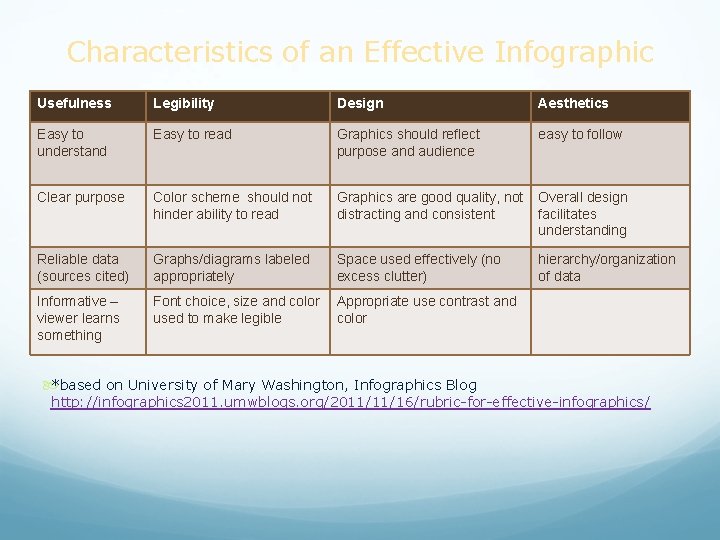
Characteristics of an Effective Infographic Usefulness Legibility Design Aesthetics Easy to understand Easy to read Graphics should reflect purpose and audience easy to follow Clear purpose Color scheme should not hinder ability to read Graphics are good quality, not distracting and consistent Overall design facilitates understanding Reliable data (sources cited) Graphs/diagrams labeled appropriately Space used effectively (no excess clutter) hierarchy/organization of data Informative – viewer learns something Font choice, size and color used to make legible Appropriate use contrast and color *based on University of Mary Washington, Infographics Blog http: //infographics 2011. umwblogs. org/2011/11/16/rubric-for-effective-infographics/
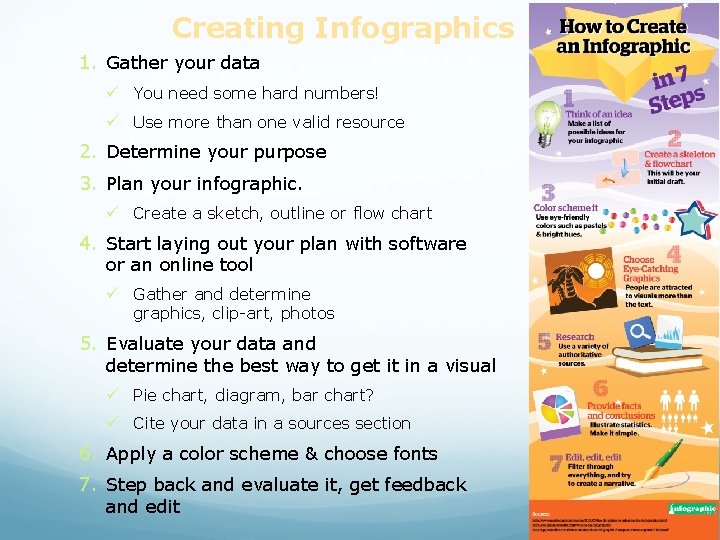
Creating Infographics 1. Gather your data ü You need some hard numbers! ü Use more than one valid resource 2. Determine your purpose 3. Plan your infographic. ü Create a sketch, outline or flow chart 4. Start laying out your plan with software or an online tool ü Gather and determine graphics, clip-art, photos 5. Evaluate your data and determine the best way to get it in a visual ü Pie chart, diagram, bar chart? ü Cite your data in a sources section 6. Apply a color scheme & choose fonts 7. Step back and evaluate it, get feedback and edit
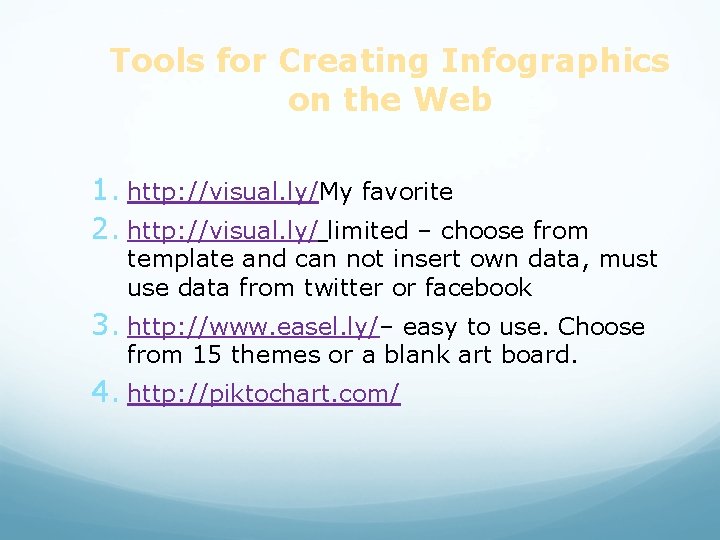
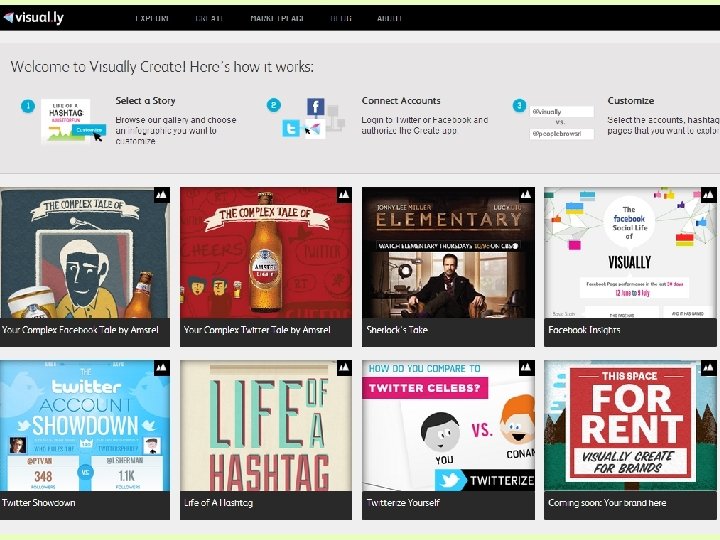
Tools for Creating Infographics on the Web 1. http: //visual. ly/My favorite 2. http: //visual. ly/ limited – choose from template and can not insert own data, must use data from twitter or facebook 3. http: //www. easel. ly/– easy to use. Choose from 15 themes or a blank art board. 4. http: //piktochart. com/
Copyright • Be aware of copyright, when you are creating infographics • Cite your sources for data • Don’t just pull any image off of the web