Indoor Air Quality Case Studies Kevin Renton IAQ


 Typical sources Leaking vented combustion appliances Unvented combustion appliances Parking")
 sources VOC sources Outdoor air Ozone (O 3)")
 Soil gas 4 p. Ci/liter")
 Dr.")


?")


- Slides: 55
Indoor Air Quality Case Studies Kevin Renton
IAQ • Intro – why this stressor is important • The problem i. e. Health effect • Legislation / Directives – incl. OEL, what guides us / restricts us • How measured • How controlled • Challenges • How practical/applicable to measure/assess • Wrap up
Bad Parenting ? ? or …….
Occupational Health Risk Assessment What to do? eyes, nose, and throat irritation, headaches, dizziness & fatigue
Table 1: Acceptable Indoor Air Quality – ASHRAE Good practice guidelines suggest an air velocity of at least 0. 1 m/s. The National Building Regulations, SANS 10400 -1990, also requires that, in order to prevent the perception of draughts, the air velocity of air in an occupied room should not exceed 0. 5 m/s. Season Parameter Measurement Winter or Summer CO 2 Less than 1000 ppm Winter Temperature 20 -24°C Summer Temperature 23 -26°C Winter or Summer Humidity 30 -60% RH
GUIDELINES USED Parameter Reference values Source Temperature 23 -26 °C Humidity 30 -60% RH Carbon Monoxide Carbon Dioxide 8 hour 9 ppm less than 1000 ppm Number of air changes/hour 6 air changes/hour: offices ASHRAE Standard 62 -1989, 1992 ASHRAE Standard 62 -2000 ASHRAE Standard 62 -1989, 1992 D. Jeff Burton 8 -12 air changes/hour: medical centre & medical offices Engineering toolbox – see references below Total air supply required person Comfort 10 L/s Less than 10% complaining of any one thermal conditionhot/cold/stale/humid ASHRAE 62 -2001 ASHRAE 55
Contaminant Carbon monoxide (CO) Typical sources Leaking vented combustion appliances Unvented combustion appliances Parking garages Outdoor air Formaldehyde Pressed wood (HCHO) products Furniture and furnishings Lead (Pb) Paint dust Outdoor air Level of interest Comments 3 ppm above Mental alertness level an indication of abnormal outdoor level indoor concentration; investigation of possible 9 ppm(health) sources advisable Health level based on effects on persons with coronary artery disease, average exposure for 8 hours over a working lifetime. 120. μg/m³ ( 0. 1 ppm) Based on irritation of sensitive people, 30 minute exposure(WHO). 1. 5 μg /m³ Based on adverse effects on neuropsychological functioning of children, average exposure for 3 months (WHO: 0. 5 -1 μg/m³ for 1 year) Based on providing protection against adverse respiratory effects, average exposure for one year Nitrogen Leaking vented 100μg/m³ dioxide (NO 2) combustion appliances Unvented combustion appliances Outdoor Air
Odors Occupants Fungal ( mold ) sources VOC sources Outdoor air Ozone (O 3) Electrostatic 100μg/m³ appliances ( 50 ppb) Office machines Ozone generators Outdoor air Dust 50μg/m³ Smoke Deteriorating materials Outdoor air Particles (PM 10) Predicted acceptability to 80 % or more of occupants or visitors CO 2 concentration can be used as a surrogate for occupant odor (odorous bioeffluents ). For sources other than people, source control is recommended. Based on potential for adverse acute and chronic effects and an additional margin of protection, 8 hour exposure. Based on protecting against respiratory morbidity in the general population and avoiding exacerbation of asthma, average exposure for one year, no carcinogens. Indoor concentrations are normally higher than outdoor concentrations, the guideline level may lead to unacceptable deposition of dust.
Contaminant Typical sources Level of interest Comments Radon (Rn) Soil gas 4 p. Ci/liter Based on lung cancer, average exposure for 1 year. 80μg/m³ Based on protecting against respiratory morbidity in the general population and avoiding exacerbation of asthma, average exposure 1 year. Sulfur dioxide (SO 2) Unvented space heaters ( kerosene) Outdoor air Total volatile New building organic materials and compounds ( furnishings TVOC’s) Consumable products Maintenance materials Outdoor air <300μg/m³ - Odor and irritation responses to organic compounds comfort range are highly variable. The three guidelines for this complaints class of compounds represent ranges where odor and unlikely irritation complaints are seldom observed (comfort 300 -3000μg/m³ range); where complaints become significant in - complaints buildings (comfort/discomfort range); and where possible significant complaints are likely (discomfort range). >3000μg/m³ - Average indoor concentrations in most buildings are discomfort well below 1000μg>m³. The value for design should range, be selected by the designer and the owner of the complaints building. During the operation of the building, likely measured TVOC concentrations above > 25000μg/m³ 1000μg>m³should trigger further analysis to - toxic range determine whether concentrations of individual compounds are above levels of concern. Above 25 mg/m³ additional neurotoxic effects other than headaches will occur.
Case Studies: Sixty Practical Applications of OH&S Control Principles (Elemental industrial hygiene series) Dr. Jeff Burton
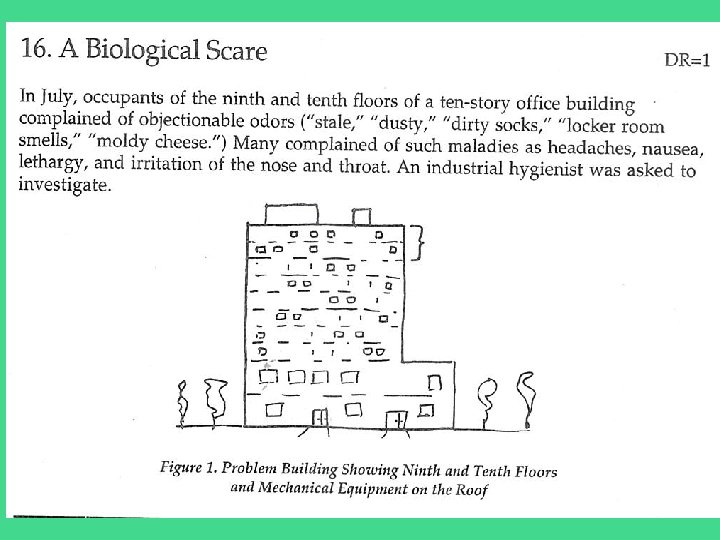
• Are these complaints suggestive of a biological contamination of some sort? • What complaint rate is suggestive of a real IAQ problem?
• The IH took note of the odour complaints – most were suspiciously similar to complaints associated with microbiological problems. After conducting a survey, the IH determined that 33% o 0 f people were complaining. This was high – typically less than a few percentage of people would have such complaints. Complaints had begun in May, as warm weather hit the region.
What potential sources would the IH investigate (and eliminate)?
The IH was able to discount some possible odour sources right away – there had been no flooding or water damage episodes, no construction or remodelling was going on, no equipment was malfunctioning, there were no open chemical processes in the building and smoking had been outlawed several years ago.
What would be likely source of these complaints, given that complaints were isolated to two floors and complaints began at the beginning of summer?
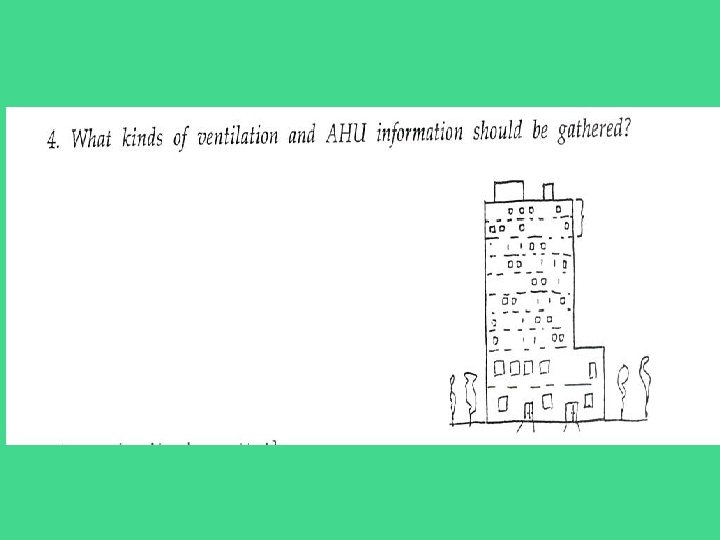
Because no obvious source was quickly identified, the IH next turned to the air handling unit (AHU) and found that a dedicated AHU on the roof served both the 9 th and 10 th floors.
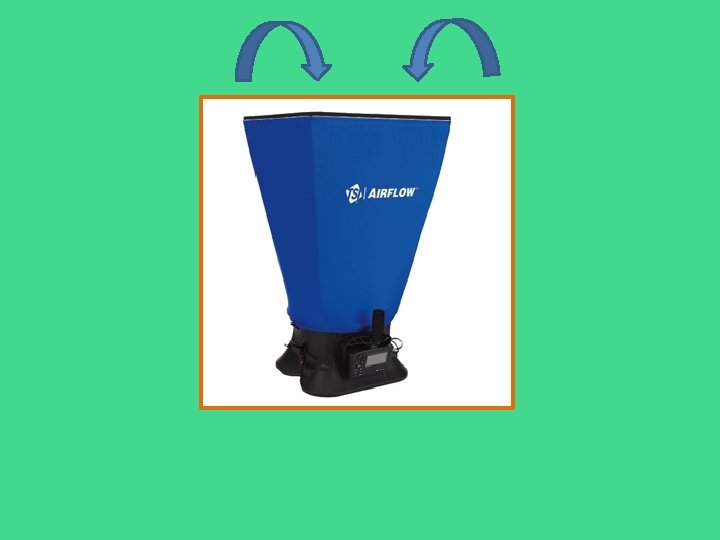
The IH routinely checked air flows at the supply and return registers in each office, with the following results: • Air turnover rates seemed adequate, about 7 air changes/hour • Outdoor air was being provided at about 10% of total supply, (typical of operations during the hot, humid summer months)
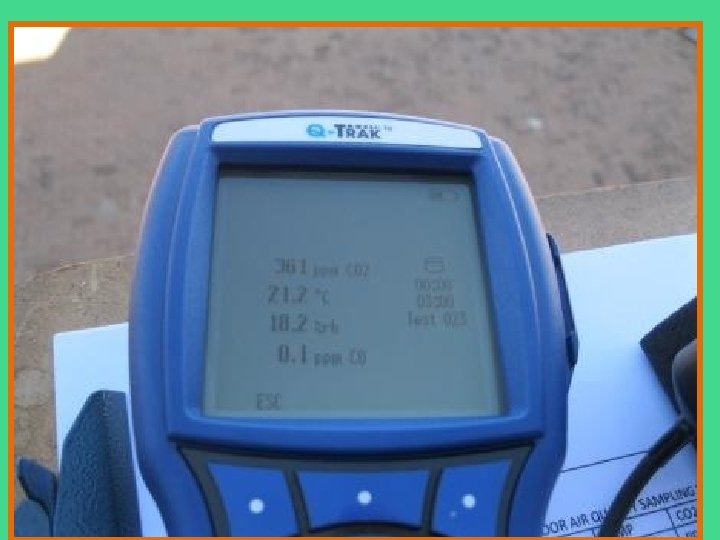
• Indoor air temperatures and humidities were at the upper end of normal: 23 - 24 deg C 55 -65% relative humidity • Indoor carbon dioxide samples were not abnormally high – av 900 ppm • Outdoor air concentrations of carbon dioxide av 370 ppm
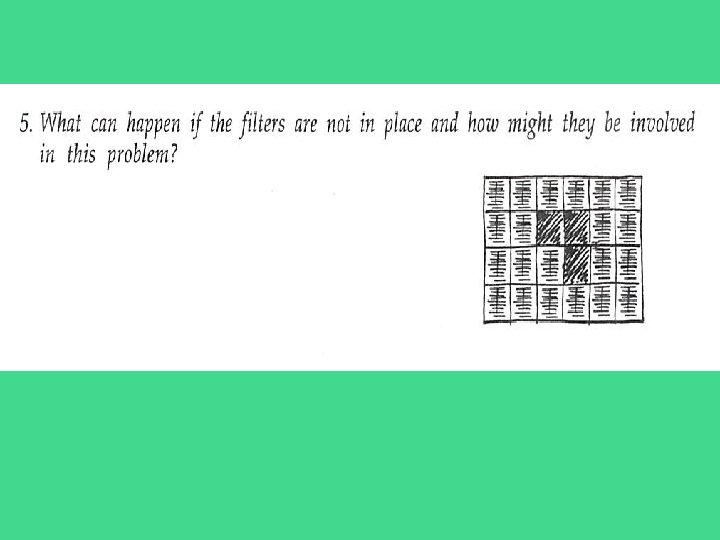
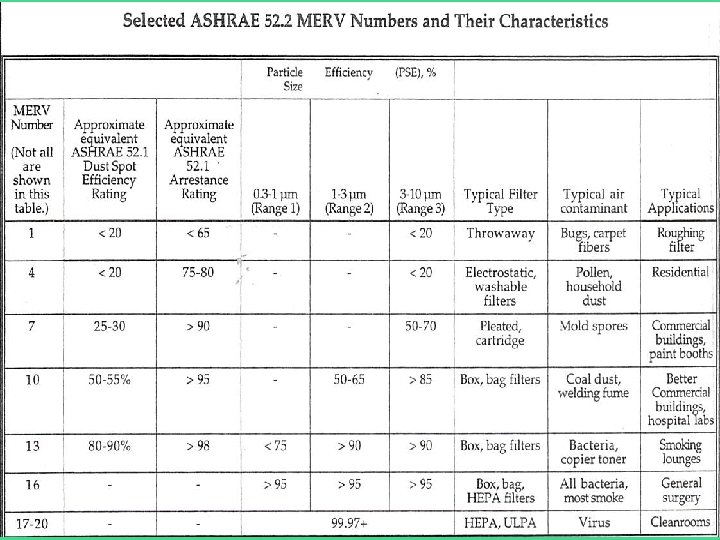
The IH also inspected the rooftop AHU equipment with the following results: • All ductwork and connected controls were attached and operating properly • The air filter system consisted of a roll type prefilter (MERV=5) and a bank of 2’x 2’ pleated paper filters (MERV=10)
• The roll filter had become defective during the winter and the filter removed until repairs could be made • The 2’x 2’ filter bank had 3 pleated filters missing and air was flowing unfiltered into the AHU through holes
IAQ Complaints in an Older Office Building
Occupants along the west wall of an office building complained of "odors, dust, smoke, cold air, and noise. " Several had asked to be transferred to other areas. An Occupational Hygienist investigated.
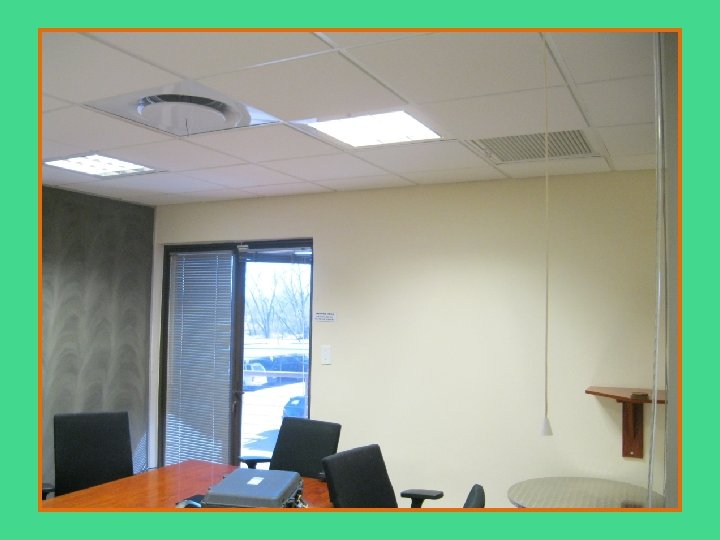
Figure 1. Plan View of Office Building Area of Complaints Showing Locations of Thermostats (T), and Air Handler No. 1 (AR 1) on the Roof; North is Up
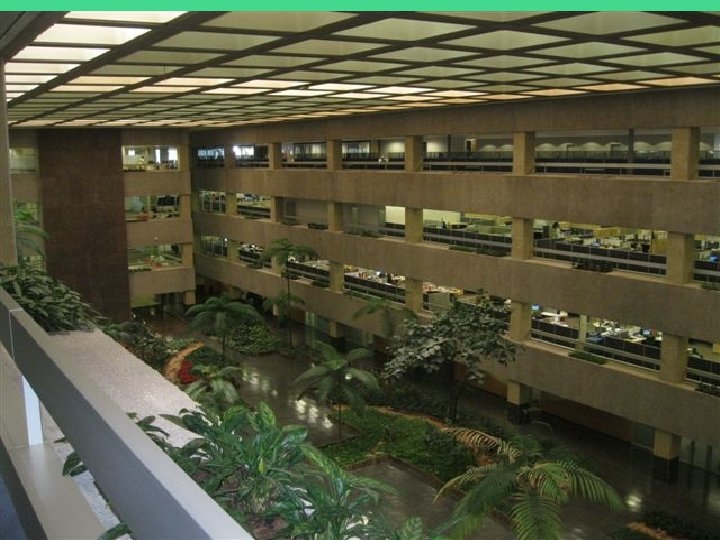
The space characterization data gathered by the IH included: The office space consists of offices along the outside walls of the single story building. A large package-unit AHU was located on the roof; the system was a reheat type unit with supply and return ducts. . The floor area was 5, 000 square feet. A total of 35 people work in the office area.
The IH's walkthrough and investigation data included: . The office building was divided into four zones; air was supplied to each office space from supply registers in the ceiling and returned at ceiling grilles. . Thermostats were located in four locations in the hallways. Each was locked and only the HV AC operator had the key. Temperatures were set by "consensus. "
. Average indoor measured dry bulb temperature = 23° C; range = 20 -24°C; RH = 30 -50%. The total amount of air, Q, being delivered to the space was QSA = 2, 500 cfm; 70 792 33 l/s person litre/min percent OA 30%; the amount of air being returned to the AHU, QRA = 3, 000 cfm.
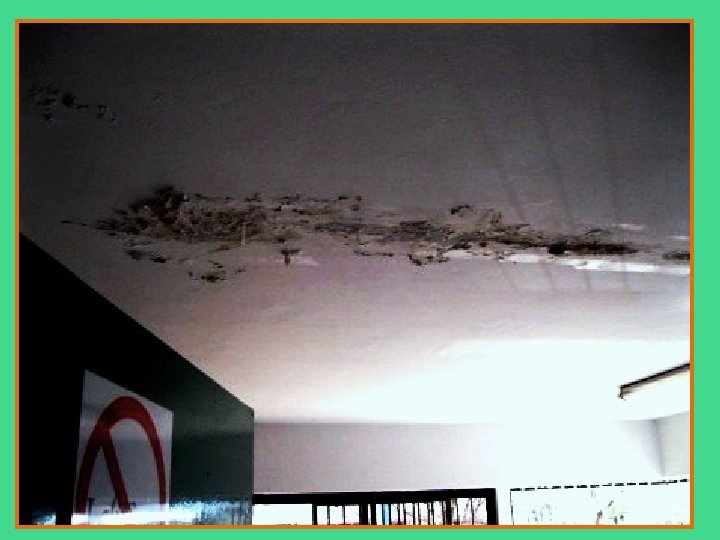
Using indicator tubes, CO = 0 ppm and CO 2 = 900 ppm. Other: Odours and dust were observed in offices along the west wall. Water had infiltrated the roof of the building during a severe storm two months ago. Outside: Stormy; west winds at 10 mph, outside temperature, 40°F, RH, near 100%. A new building was being constructed on the west side of the building. Building construction: Concrete block; aluminium windows; 25 years old.
. The building was quiet dusty; housekeeping was performed weekly during the evenings. . . The AHU had no provision for humidifying the air.
Please evaluate the above data and write your- responses to the following questions 1. Was there a genuine IAQ problem? 2. Were the following IAQ-related parameters okay/not okay? Air distribution? Total air flowrates? OA delivery? volume
Carbon Dioxide Concen trations? Thermal Comfort conditions? Air contaminant concentrations? HV AC problems?
What do think may be the sources and/or causes of the complaints?
List possible contributing factors.
List possible corrective actions or controls.
Outcome. These were the findings and recommendations for control: . Temperatures, RHs, CO 2, QOA, thermostat locations, supply and return registers-all appeared within normal and acceptable criteria. Dust, odors, temperature extremes, and noise suggested a genuine IAQ problem. QRA = 3, 000 cfm and QSA =2500 cfm. The building was under negative pressure because more air was being returned to the AHU than being supplied to the building. (Should be positive. ). Air was infiltrating the building along the walls, especially the west wall because the wind was from the west. Construction dust, odours, noise, and cold air were infiltrating the west wall. .
Recommendations for control: Rebalance the HV AC system to bring the building into a slight positive pressure (re: the outside). -- Maintain tight control of remodeling /renovation activities in the future.
INDOOR AIR QUALITY SAMPLING WORKSHEET Room number and description CO RH TEMP CO 2 ppm % °C ppm Office worker 1 0. 9 28. 2 22. 5 918 Office worker 2 0. 6 27. 7 22. 7 958 Office worker 3 0. 7 28. 2 22. 6 969 Office worker 4 0. 6 28. 0 22. 4 963 Outside (back of building by fire escape door) 0. 1 18. 2 20. 9 369 Outside (front of building by entrance) 0. 1 12. 5 26. 0 348 Comments Open plan office, which accommodates about 36 people. The air-conditioning system used does not introduce fresh air from the outside rather it recirculates the air from inside the building. The office has carpet flooring, that has to date this year been washed only once and it is vacuumed every second day with a vacuum cleaner fitted only with an ordinary dust filter. The partitioning on the workstation has cotton fabric on it. The office has openable windows but they are seldom opened and they were not opened on the day of the assessment. The office has about 4 pot plants. Smoking was observed on 2 of the 4 balconies.
INDOOR AIR QUALITY SAMPLING WORKSHEET Room number and description CO RH ppm % TEMP CO 2 °C ppm Microbiology/ recieving 0. 1 24. 3 21. 6 776 Store room 0. 0 23. 3 21. 5 675 Flow cytometery 0. 0 21. 3 21. 2 556 Lab Manager 0. 0 20. 4 21. 0 519 Tea room 0. 0 21. 2 20. 8 532 Comments
The air velocity measurements did not comply with the minimum standard of at least 0. 1 m/s in approximately half of the areas that were evaluated. The maximum air velocity of 0. 5 m/s was not exceeded in any of the rooms.
Recommendations • “Once the modifications have been implemented, employees should be trained how to maintain the proposed temperature adjustment” • Involve the Engineer in the H&S Committee – Team approach Including MANAGEMENT. • Changing Office plans not considering fresh air requirements
Thank You