Illegal Migration Lecture 5 Gordon H Hanson UCSD

- Slides: 55
Illegal Migration: Lecture 5 Gordon H. Hanson UCSD and NBER
Introduction n What we’ve done so far q q q n Scale, selection and sorting in international migration Labor markets impacts of emigration and immigration Public finance consequences of international labor flows Today’s lecture q Illegal migration 2
Introduction n One morning in San Diego… n As neighborhood residents depart for work, illegal immigrants arrive to mow lawns, clean homes, care for children, and build houses q n n Down the road, they prepare restaurant meals, clean hotels, harvest crops, assemble apparel, and process food What is exceptional about this scene is not that it happens in CA (or FL, TX or NY) but that it is repeated in Las Vegas NV, Little Rock AR, Atlanta GA, Detroit MI, and cities throughout Europe Illegal immigrants are an integral part of the US economy n With a population of 10 million, 6 -8 million of whom work, illegal immigrants are no longer a marginal segment of the US labor force n Gone are days when illegal laborers were confined to farms – they’re now a part of US construction, service and manufacturing industries 3
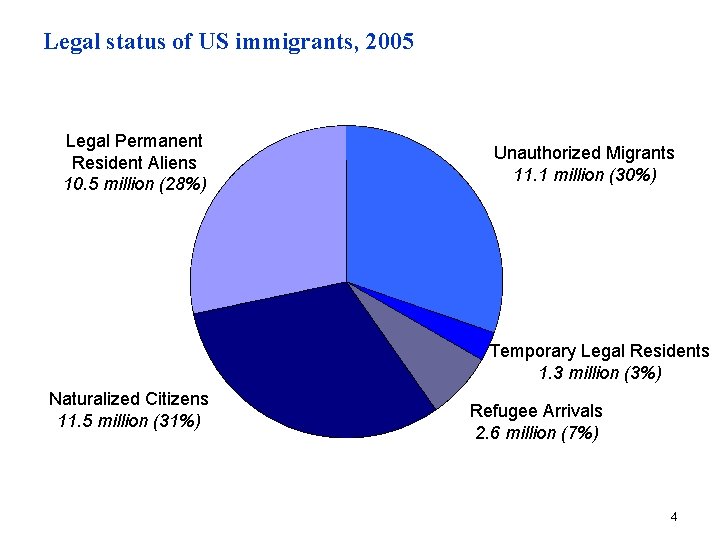
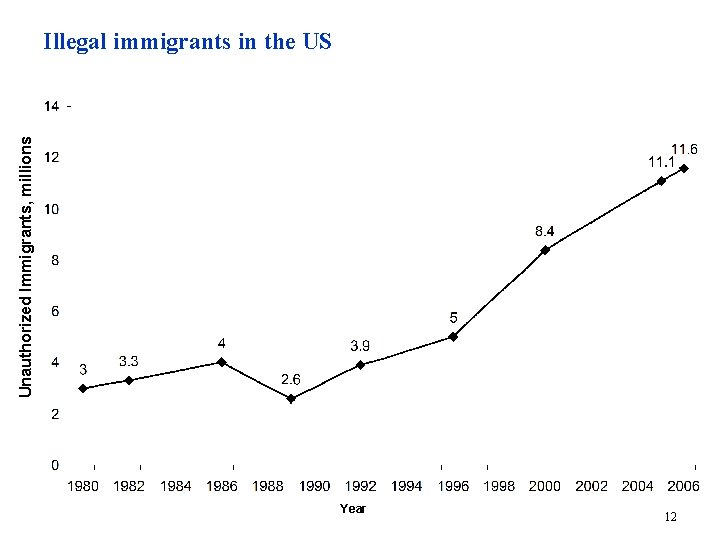
Legal status of US immigrants, 2005 Legal Permanent Resident Aliens 10. 5 million (28%) Unauthorized Migrants 11. 1 million (30%) Temporary Legal Residents 1. 3 million (3%) Naturalized Citizens 11. 5 million (31%) Refugee Arrivals 2. 6 million (7%) 4
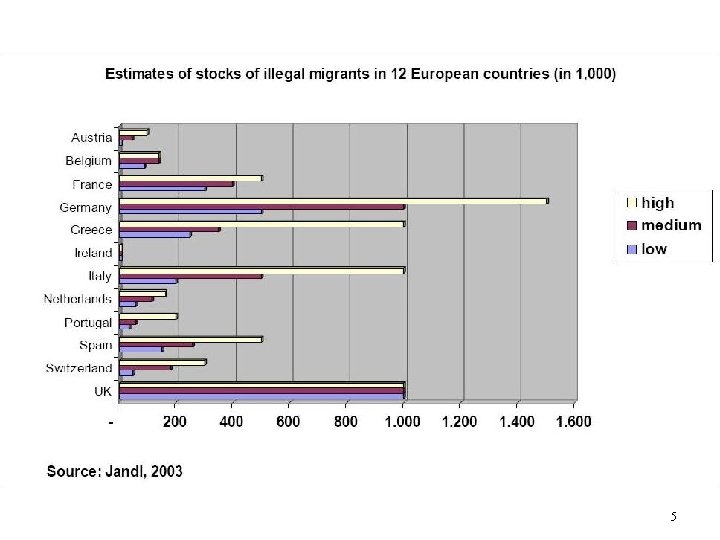
5
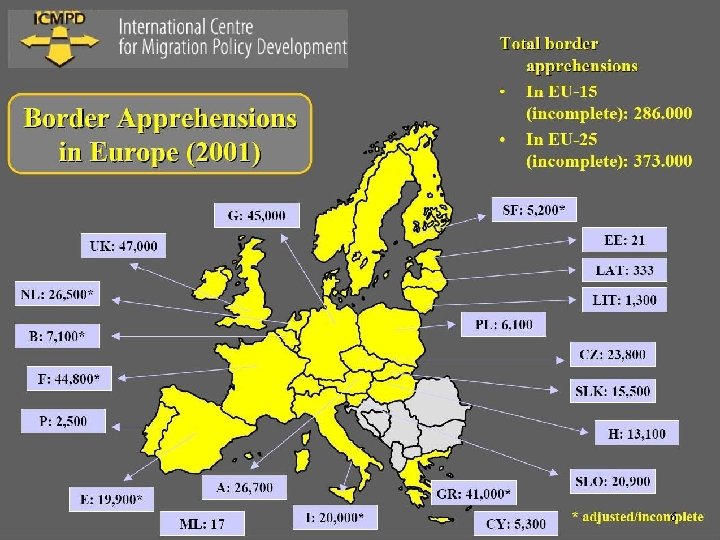
6
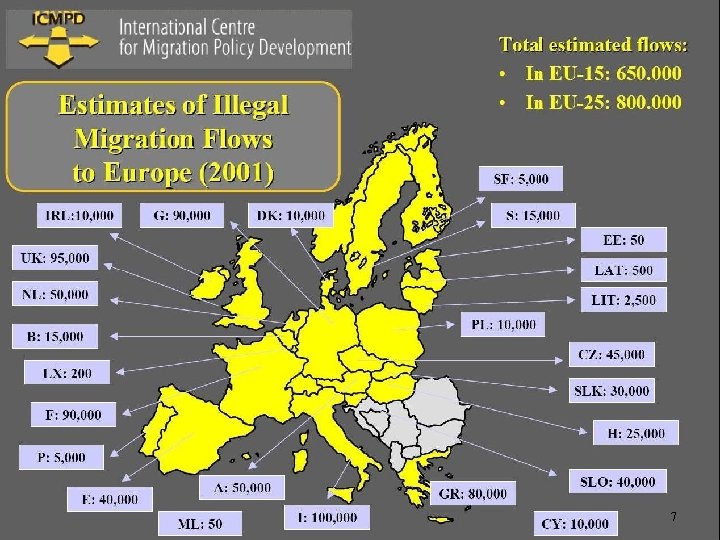
7
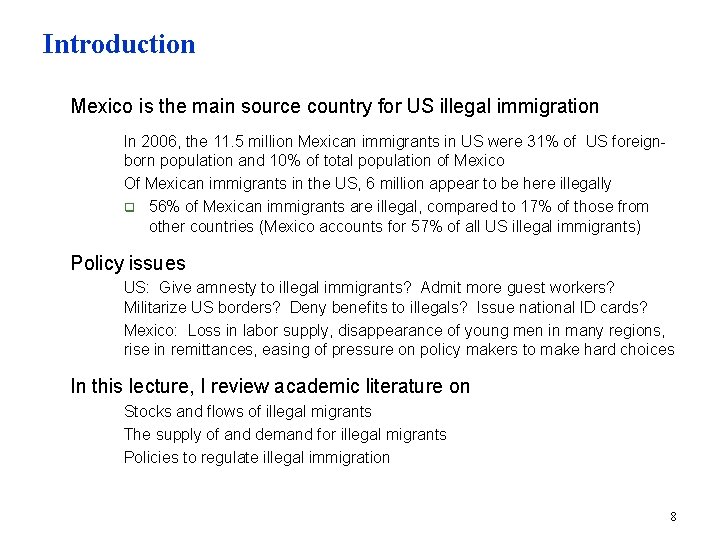
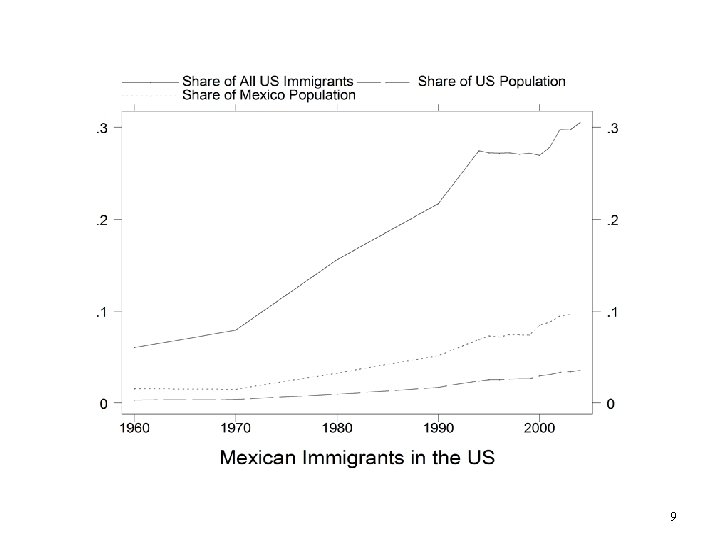
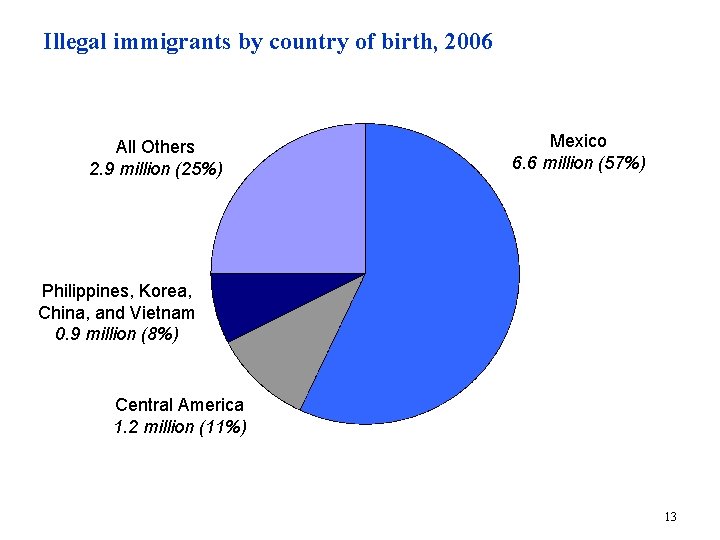
Introduction n Mexico is the main source country for US illegal immigration n Policy issues n n n In 2006, the 11. 5 million Mexican immigrants in US were 31% of US foreignborn population and 10% of total population of Mexico Of Mexican immigrants in the US, 6 million appear to be here illegally q 56% of Mexican immigrants are illegal, compared to 17% of those from other countries (Mexico accounts for 57% of all US illegal immigrants) US: Give amnesty to illegal immigrants? Admit more guest workers? Militarize US borders? Deny benefits to illegals? Issue national ID cards? Mexico: Loss in labor supply, disappearance of young men in many regions, rise in remittances, easing of pressure on policy makers to make hard choices In this lecture, I review academic literature on n Stocks and flows of illegal migrants The supply of and demand for illegal migrants Policies to regulate illegal immigration 8
9
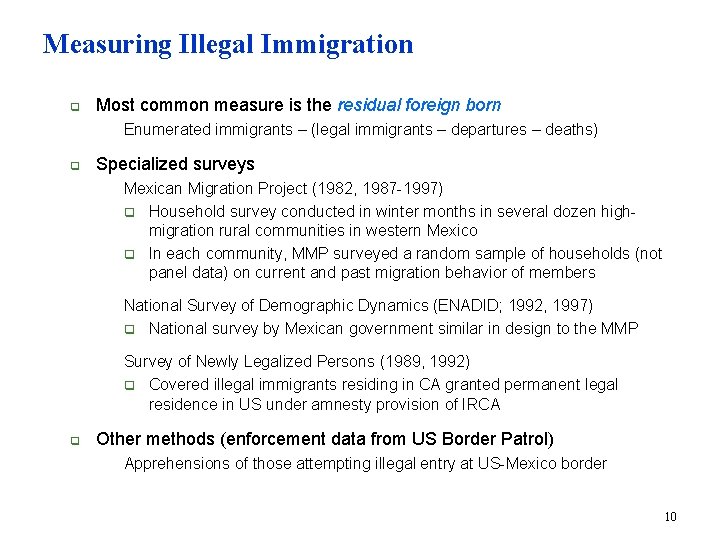
Measuring Illegal Immigration q Most common measure is the residual foreign born n q q Enumerated immigrants – (legal immigrants – departures – deaths) Specialized surveys n Mexican Migration Project (1982, 1987 -1997) q Household survey conducted in winter months in several dozen highmigration rural communities in western Mexico q In each community, MMP surveyed a random sample of households (not panel data) on current and past migration behavior of members n National Survey of Demographic Dynamics (ENADID; 1992, 1997) q National survey by Mexican government similar in design to the MMP n Survey of Newly Legalized Persons (1989, 1992) q Covered illegal immigrants residing in CA granted permanent legal residence in US under amnesty provision of IRCA Other methods (enforcement data from US Border Patrol) n Apprehensions of those attempting illegal entry at US-Mexico border 10
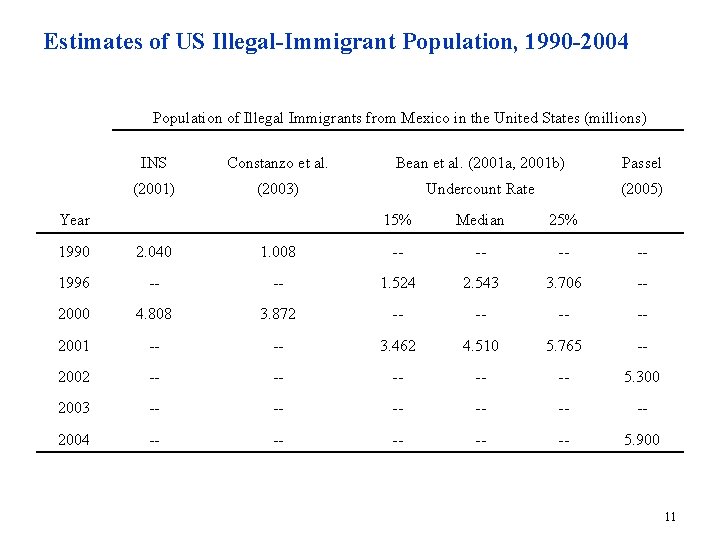
Estimates of US Illegal-Immigrant Population, 1990 -2004 Population of Illegal Immigrants from Mexico in the United States (millions) INS Constanzo et al. Bean et al. (2001 a, 2001 b) Passel (2001) (2003) Undercount Rate (2005) Year 15% Median 25% 1990 2. 040 1. 008 -- -- 1996 -- -- 1. 524 2. 543 3. 706 -- 2000 4. 808 3. 872 -- -- 2001 -- -- 3. 462 4. 510 5. 765 -- 2002 -- -- -- 5. 300 2003 -- -- -- 2004 -- -- -- 5. 900 11
Unauthorized Immigrants, millions Illegal immigrants in the US Year 12
Illegal immigrants by country of birth, 2006 All Others 2. 9 million (25%) Mexico 6. 6 million (57%) Philippines, Korea, China, and Vietnam 0. 9 million (8%) Central America 1. 2 million (11%) 13
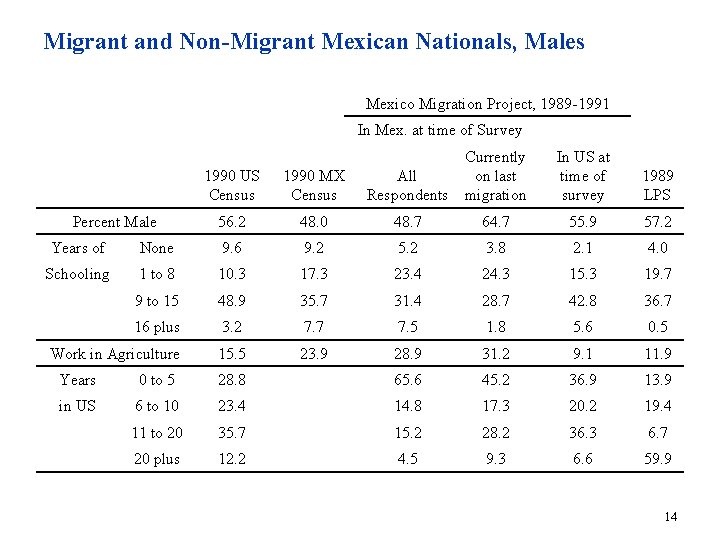
Migrant and Non-Migrant Mexican Nationals, Males Mexico Migration Project, 1989 -1991 In Mex. at time of Survey Percent Male 1990 US 1990 MX Census All Respondents Currently on last migration In US at time of survey 1989 LPS 56. 2 48. 0 48. 7 64. 7 55. 9 57. 2 Years of None 9. 6 9. 2 5. 2 3. 8 2. 1 4. 0 Schooling 1 to 8 10. 3 17. 3 23. 4 24. 3 15. 3 19. 7 9 to 15 48. 9 35. 7 31. 4 28. 7 42. 8 36. 7 16 plus 3. 2 7. 7 7. 5 1. 8 5. 6 0. 5 Work in Agriculture 15. 5 23. 9 28. 9 31. 2 9. 1 11. 9 Years 0 to 5 28. 8 65. 6 45. 2 36. 9 13. 9 in US 6 to 10 23. 4 14. 8 17. 3 20. 2 19. 4 11 to 20 35. 7 15. 2 28. 2 36. 3 6. 7 20 plus 12. 2 4. 5 9. 3 6. 6 59. 9 14
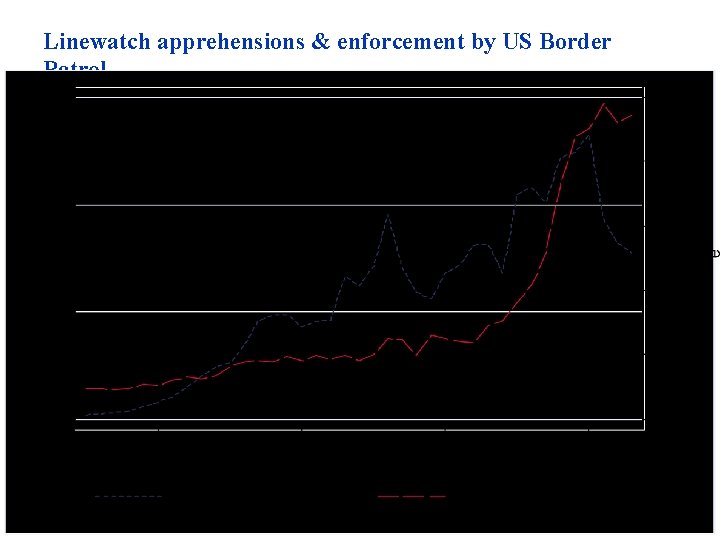
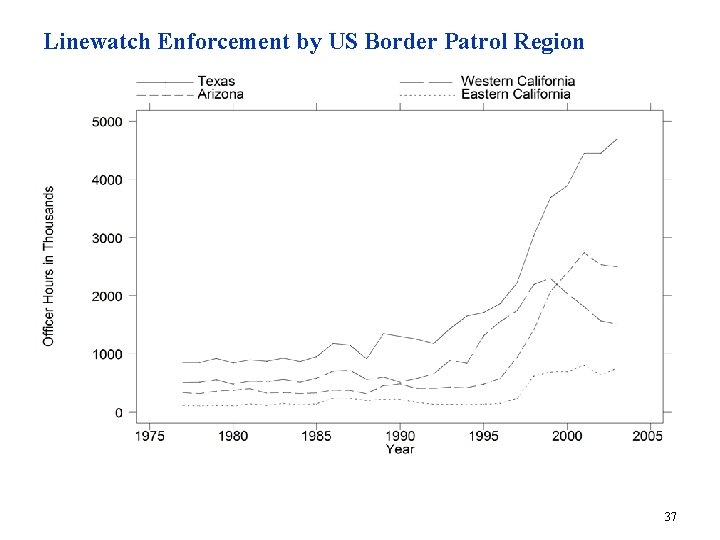
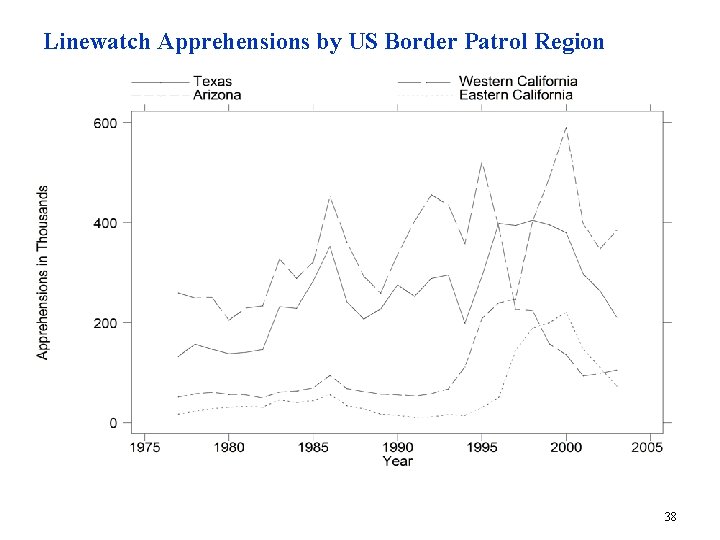
Linewatch apprehensions & enforcement by US Border Patrol 15
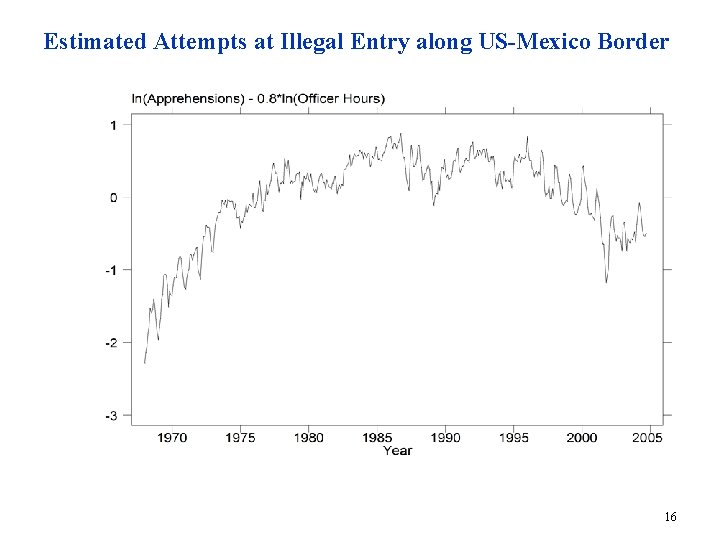
Estimated Attempts at Illegal Entry along US-Mexico Border 16
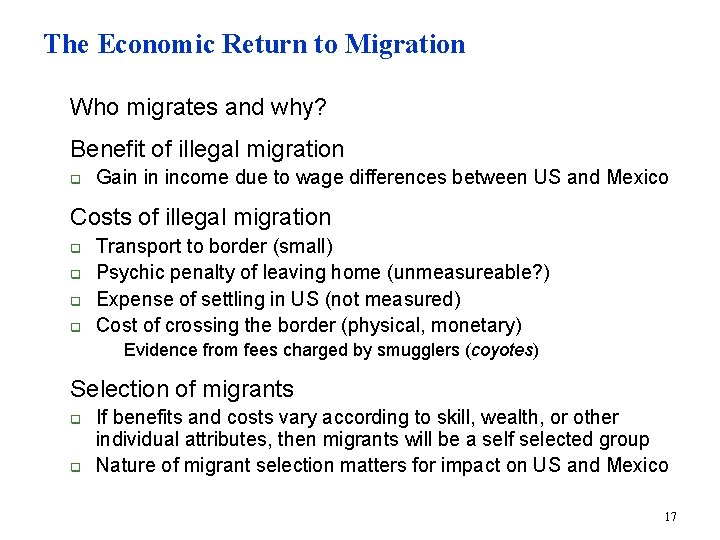
The Economic Return to Migration n Who migrates and why? n Benefit of illegal migration q n Gain in income due to wage differences between US and Mexico Costs of illegal migration q q Transport to border (small) Psychic penalty of leaving home (unmeasureable? ) Expense of settling in US (not measured) Cost of crossing the border (physical, monetary) n n Evidence from fees charged by smugglers (coyotes) Selection of migrants q q If benefits and costs vary according to skill, wealth, or other individual attributes, then migrants will be a self selected group Nature of migrant selection matters for impact on US and Mexico 17
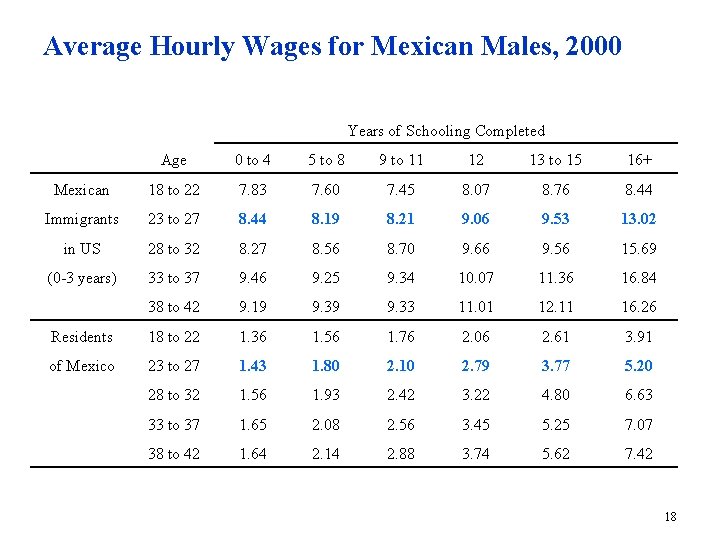
Average Hourly Wages for Mexican Males, 2000 Years of Schooling Completed Age 0 to 4 5 to 8 9 to 11 12 13 to 15 16+ Mexican 18 to 22 7. 83 7. 60 7. 45 8. 07 8. 76 8. 44 Immigrants 23 to 27 8. 44 8. 19 8. 21 9. 06 9. 53 13. 02 in US 28 to 32 8. 27 8. 56 8. 70 9. 66 9. 56 15. 69 (0 -3 years) 33 to 37 9. 46 9. 25 9. 34 10. 07 11. 36 16. 84 38 to 42 9. 19 9. 33 11. 01 12. 11 16. 26 Residents 18 to 22 1. 36 1. 56 1. 76 2. 06 2. 61 3. 91 of Mexico 23 to 27 1. 43 1. 80 2. 10 2. 79 3. 77 5. 20 28 to 32 1. 56 1. 93 2. 42 3. 22 4. 80 6. 63 33 to 37 1. 65 2. 08 2. 56 3. 45 5. 25 7. 07 38 to 42 1. 64 2. 14 2. 88 3. 74 5. 62 7. 42 18
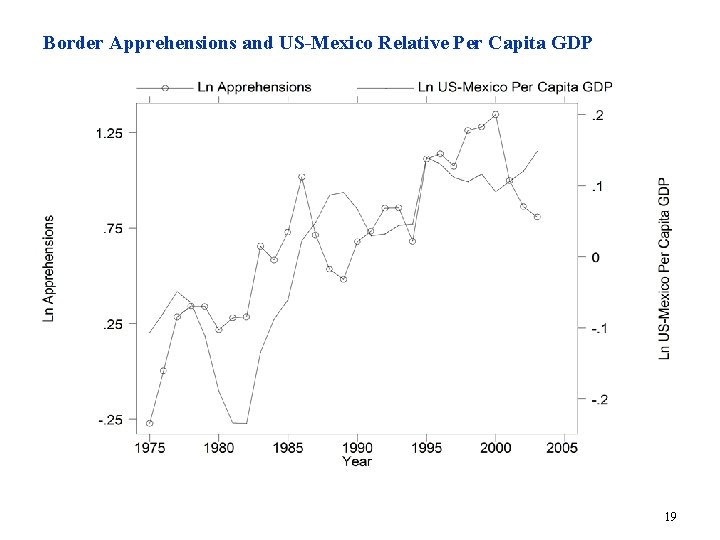
Border Apprehensions and US-Mexico Relative Per Capita GDP 19
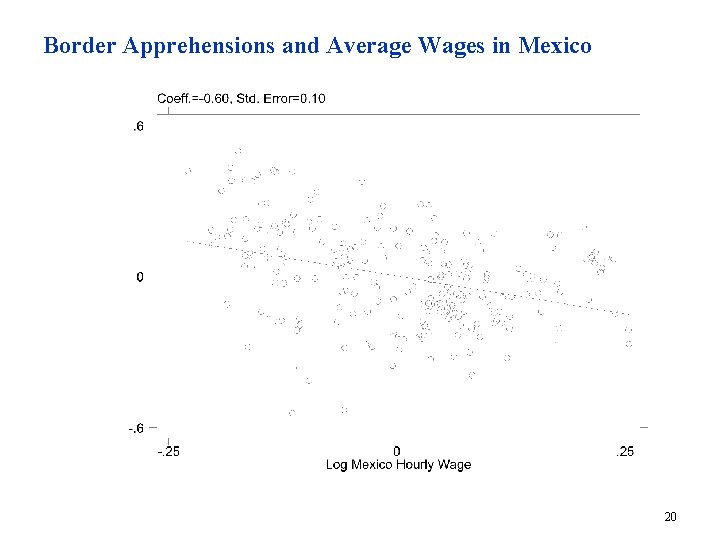
Border Apprehensions and Average Wages in Mexico 20
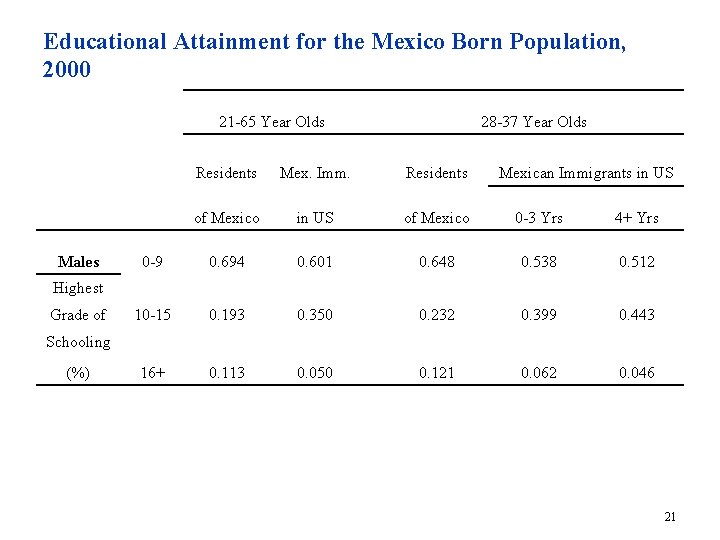
Educational Attainment for the Mexico Born Population, 2000 21 -65 Year Olds Residents Mex. Imm. of Mexico in US 0 -9 0. 694 10 -15 16+ Males 28 -37 Year Olds Residents Mexican Immigrants in US of Mexico 0 -3 Yrs 4+ Yrs 0. 601 0. 648 0. 538 0. 512 0. 193 0. 350 0. 232 0. 399 0. 443 0. 113 0. 050 0. 121 0. 062 0. 046 Highest Grade of Schooling (%) 21
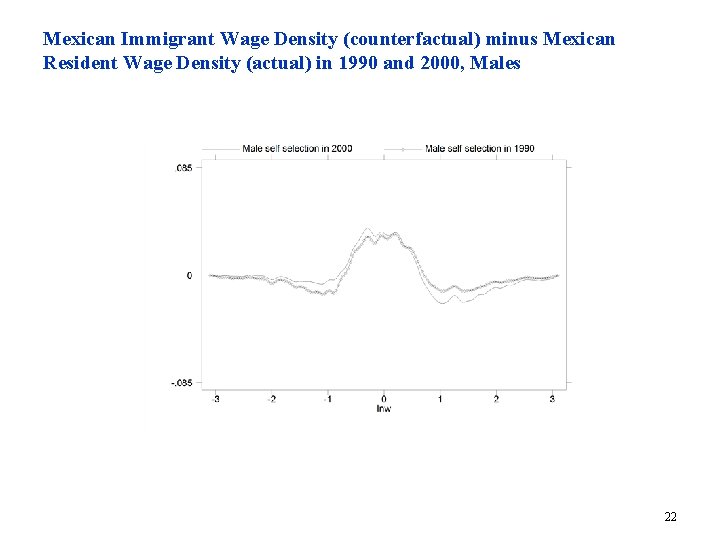
Mexican Immigrant Wage Density (counterfactual) minus Mexican Resident Wage Density (actual) in 1990 and 2000, Males 22
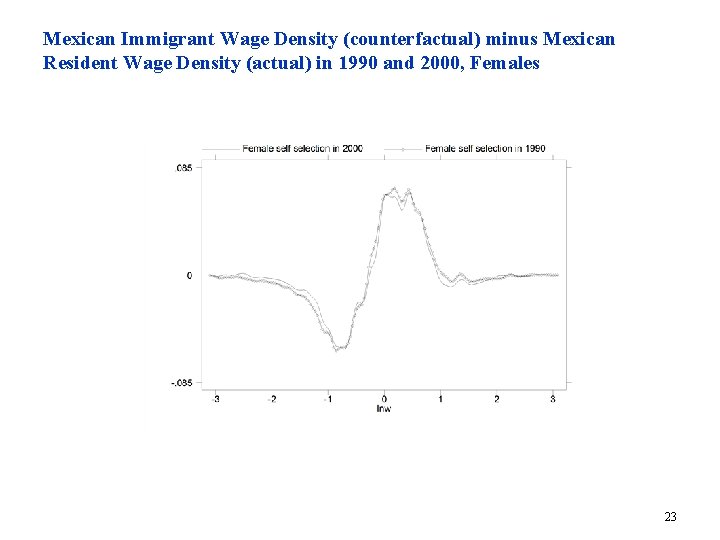
Mexican Immigrant Wage Density (counterfactual) minus Mexican Resident Wage Density (actual) in 1990 and 2000, Females 23
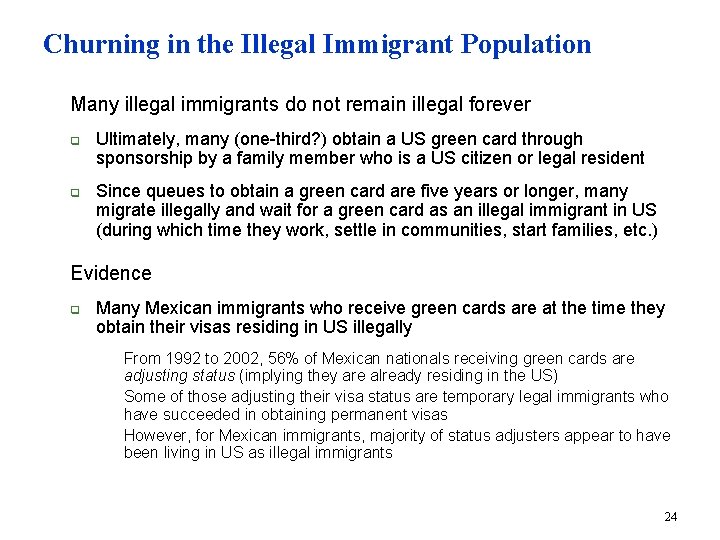
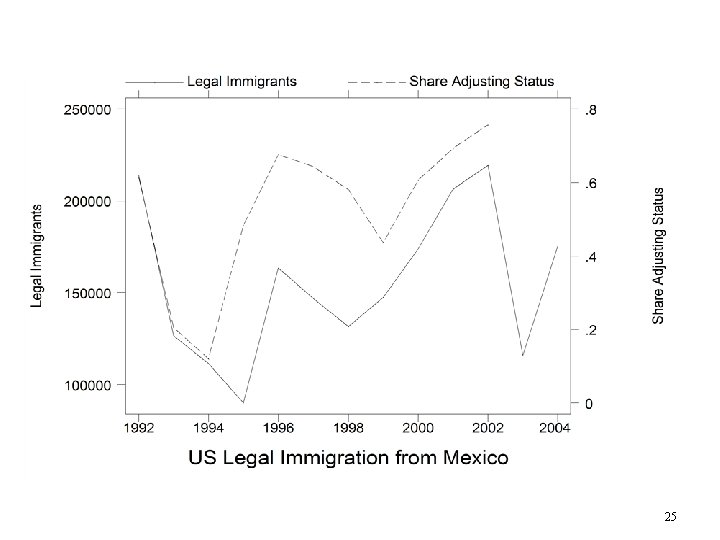
Churning in the Illegal Immigrant Population n Many illegal immigrants do not remain illegal forever q q n Ultimately, many (one-third? ) obtain a US green card through sponsorship by a family member who is a US citizen or legal resident Since queues to obtain a green card are five years or longer, many migrate illegally and wait for a green card as an illegal immigrant in US (during which time they work, settle in communities, start families, etc. ) Evidence q Many Mexican immigrants who receive green cards are at the time they obtain their visas residing in US illegally n n n From 1992 to 2002, 56% of Mexican nationals receiving green cards are adjusting status (implying they are already residing in the US) Some of those adjusting their visa status are temporary legal immigrants who have succeeded in obtaining permanent visas However, for Mexican immigrants, majority of status adjusters appear to have been living in US as illegal immigrants 24
25
26
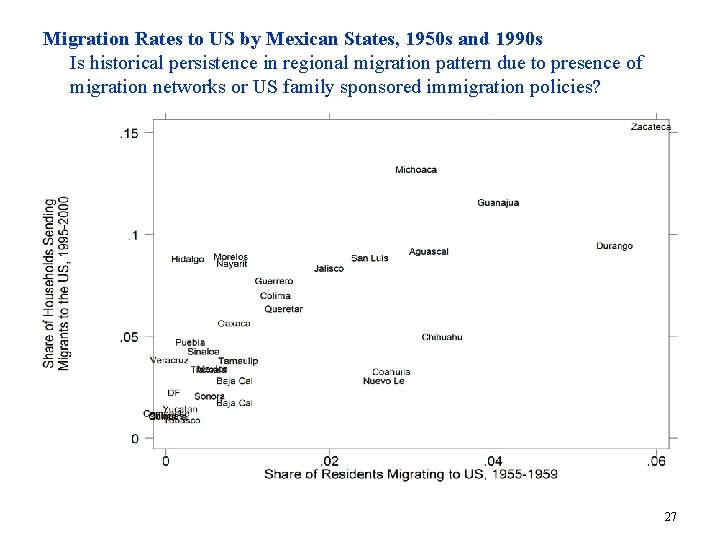
Migration Rates to US by Mexican States, 1950 s and 1990 s Is historical persistence in regional migration pattern due to presence of migration networks or US family sponsored immigration policies? 27
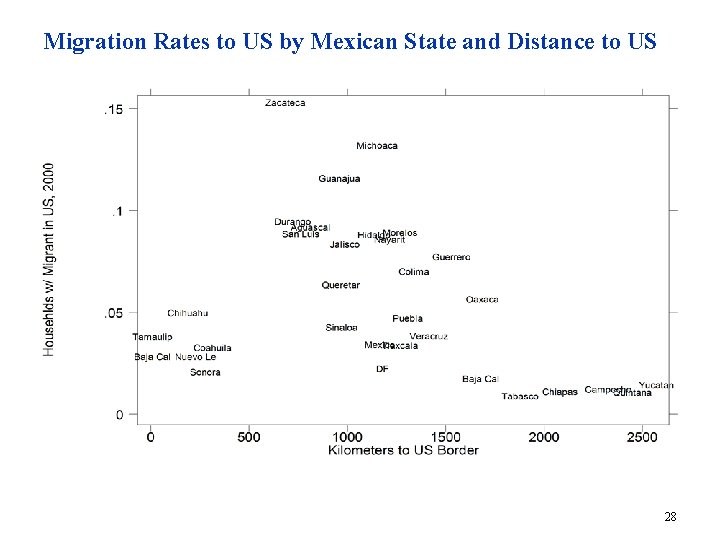
Migration Rates to US by Mexican State and Distance to US 28
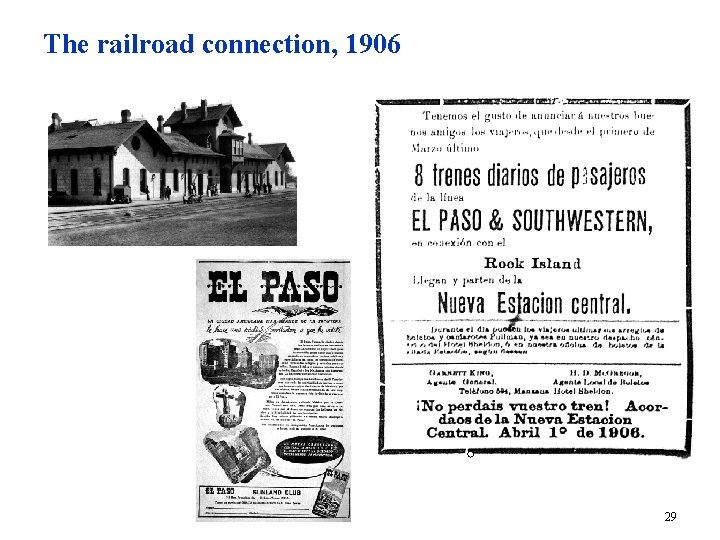
The railroad connection, 1906 29
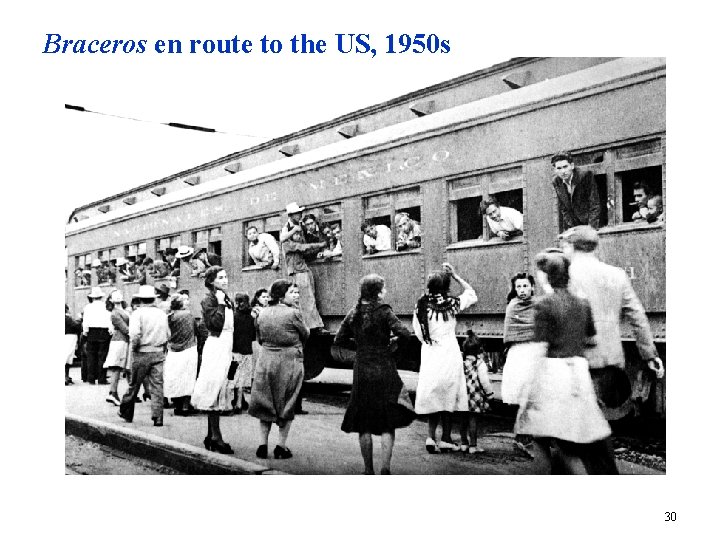
Braceros en route to the US, 1950 s 30
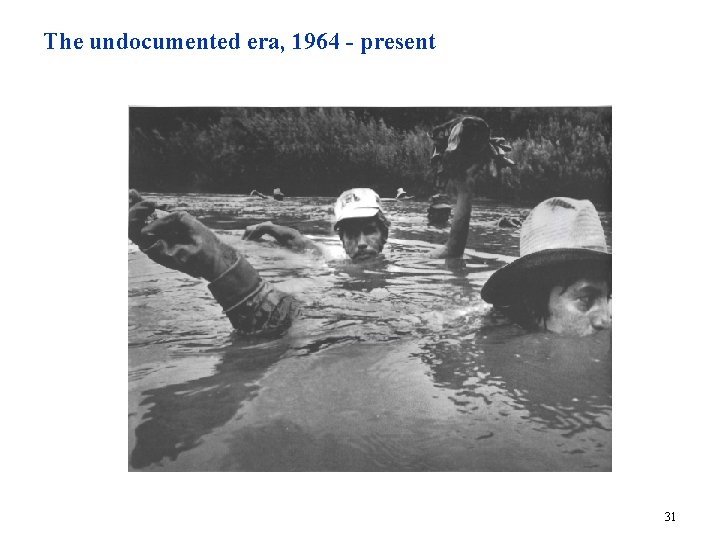
The undocumented era, 1964 - present 31
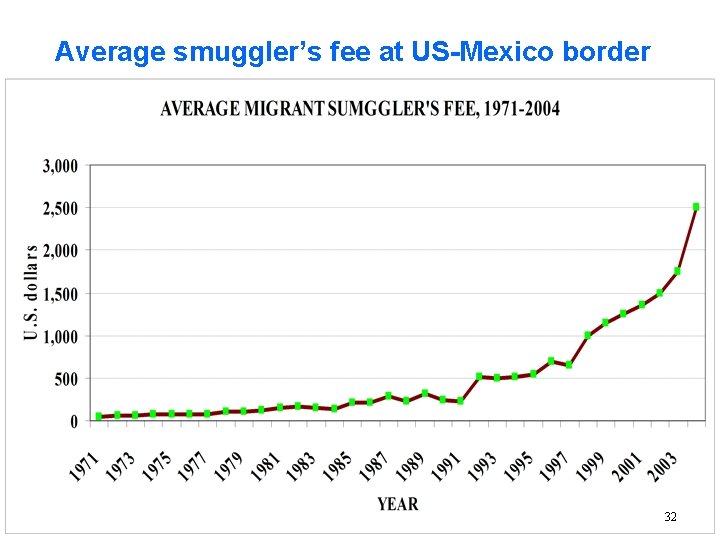
Average smuggler’s fee at US-Mexico border 32
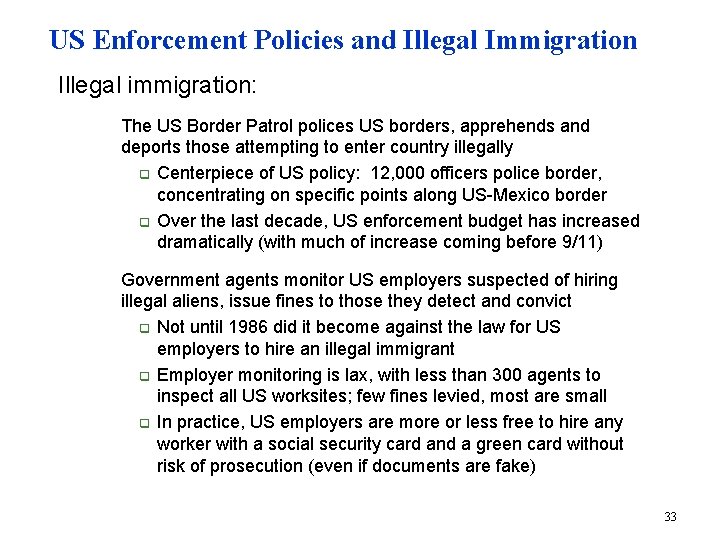
US Enforcement Policies and Illegal Immigration n Illegal immigration: n The US Border Patrol polices US borders, apprehends and deports those attempting to enter country illegally q Centerpiece of US policy: 12, 000 officers police border, concentrating on specific points along US-Mexico border q Over the last decade, US enforcement budget has increased dramatically (with much of increase coming before 9/11) n Government agents monitor US employers suspected of hiring illegal aliens, issue fines to those they detect and convict q Not until 1986 did it become against the law for US employers to hire an illegal immigrant q Employer monitoring is lax, with less than 300 agents to inspect all US worksites; few fines levied, most are small q In practice, US employers are more or less free to hire any worker with a social security card and a green card without risk of prosecution (even if documents are fake) 33
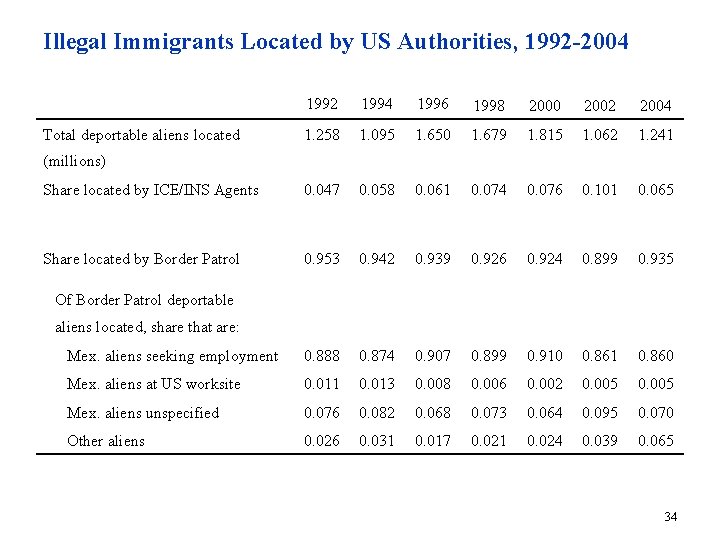
Illegal Immigrants Located by US Authorities, 1992 -2004 1992 1994 1996 1998 2000 2002 2004 Total deportable aliens located 1. 258 1. 095 1. 650 1. 679 1. 815 1. 062 1. 241 Share located by ICE/INS Agents 0. 047 0. 058 0. 061 0. 074 0. 076 0. 101 0. 065 Share located by Border Patrol 0. 953 0. 942 0. 939 0. 926 0. 924 0. 899 0. 935 Mex. aliens seeking employment 0. 888 0. 874 0. 907 0. 899 0. 910 0. 861 0. 860 Mex. aliens at US worksite 0. 011 0. 013 0. 008 0. 006 0. 002 0. 005 Mex. aliens unspecified 0. 076 0. 082 0. 068 0. 073 0. 064 0. 095 0. 070 Other aliens 0. 026 0. 031 0. 017 0. 021 0. 024 0. 039 0. 065 (millions) Of Border Patrol deportable aliens located, share that are: 34
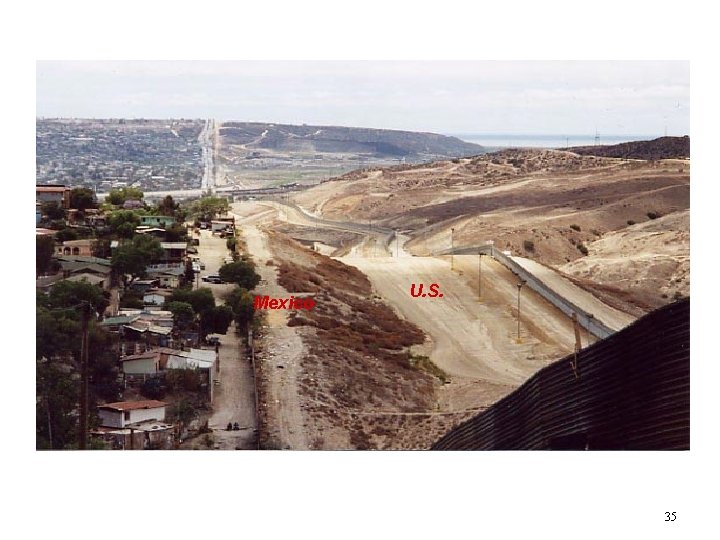
Mexico U. S. 35
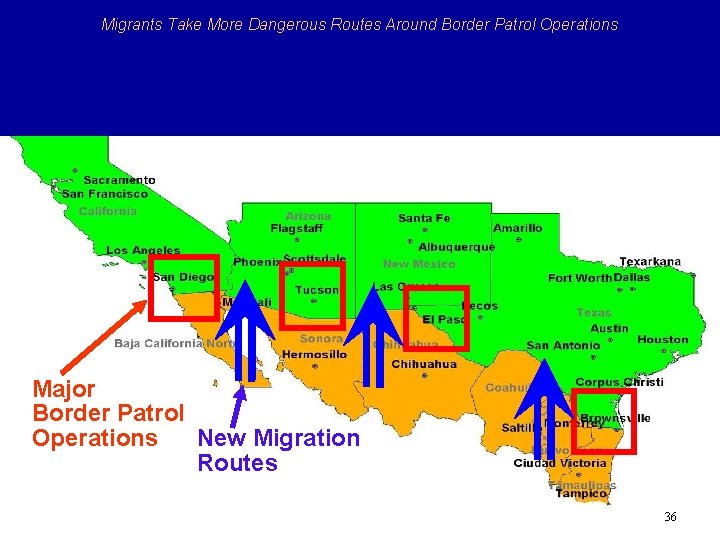
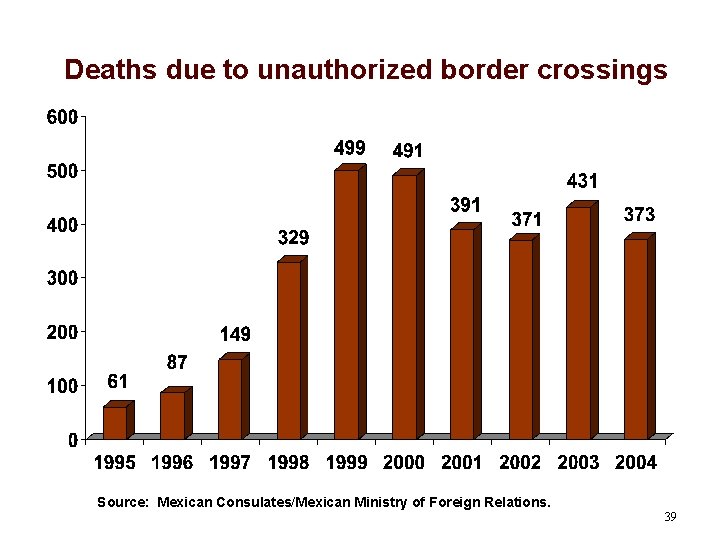
Migrants Take More Dangerous Routes Around Border Patrol Operations Major Border Patrol Operations New Migration Routes SOURCE: Cornelius 2005 36
Linewatch Enforcement by US Border Patrol Region 37
Linewatch Apprehensions by US Border Patrol Region 38
Deaths due to unauthorized border crossings Source: Mexican Consulates/Mexican Ministry of Foreign Relations. 39
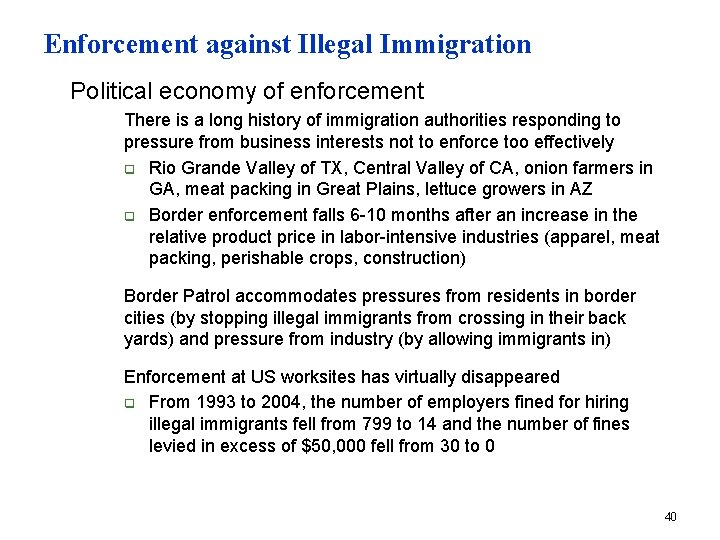
Enforcement against Illegal Immigration n Political economy of enforcement n There is a long history of immigration authorities responding to pressure from business interests not to enforce too effectively q Rio Grande Valley of TX, Central Valley of CA, onion farmers in GA, meat packing in Great Plains, lettuce growers in AZ q Border enforcement falls 6 -10 months after an increase in the relative product price in labor-intensive industries (apparel, meat packing, perishable crops, construction) n Border Patrol accommodates pressures from residents in border cities (by stopping illegal immigrants from crossing in their back yards) and pressure from industry (by allowing immigrants in) n Enforcement at US worksites has virtually disappeared q From 1993 to 2004, the number of employers fined for hiring illegal immigrants fell from 799 to 14 and the number of fines levied in excess of $50, 000 fell from 30 to 0 40
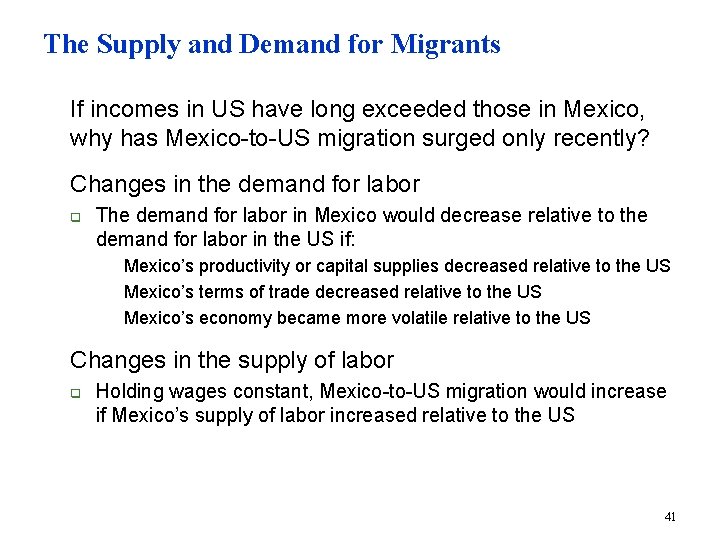
The Supply and Demand for Migrants n If incomes in US have long exceeded those in Mexico, why has Mexico-to-US migration surged only recently? n Changes in the demand for labor q The demand for labor in Mexico would decrease relative to the demand for labor in the US if: n n Mexico’s productivity or capital supplies decreased relative to the US Mexico’s terms of trade decreased relative to the US Mexico’s economy became more volatile relative to the US Changes in the supply of labor q Holding wages constant, Mexico-to-US migration would increase if Mexico’s supply of labor increased relative to the US 41
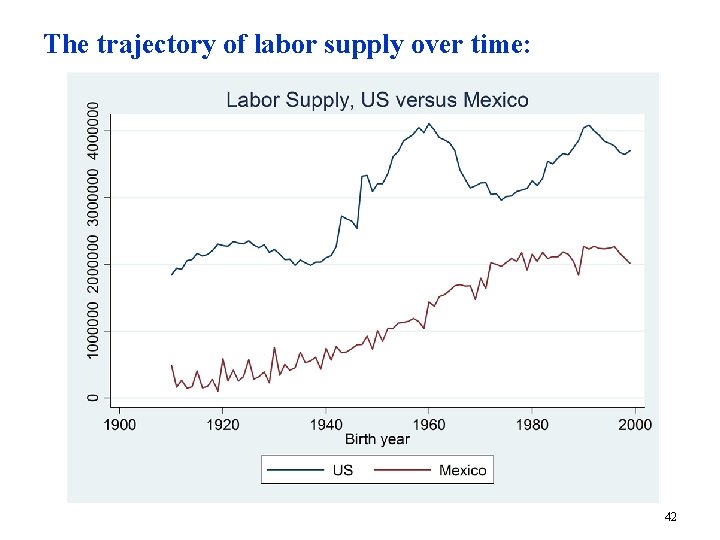
The trajectory of labor supply over time: 42
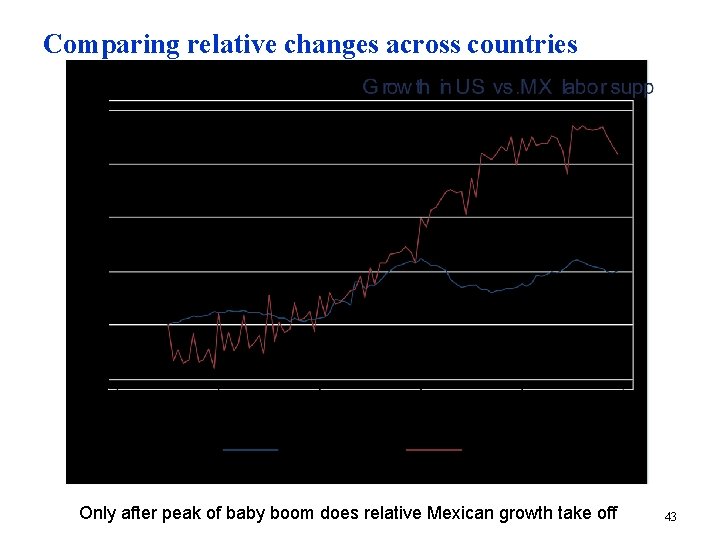
Comparing relative changes across countries Only after peak of baby boom does relative Mexican growth take off 43
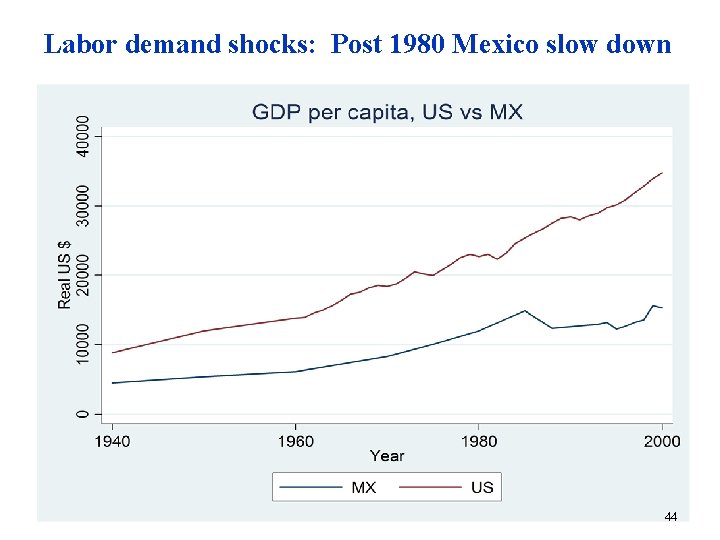
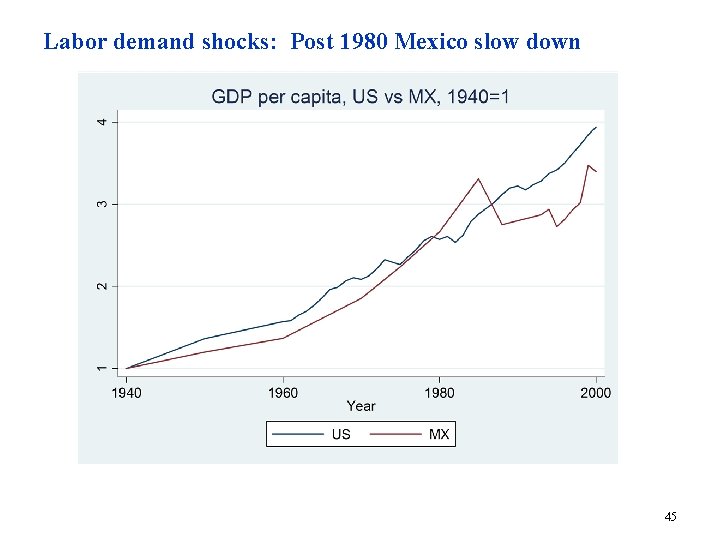
Labor demand shocks: Post 1980 Mexico slow down 44
Labor demand shocks: Post 1980 Mexico slow down 45
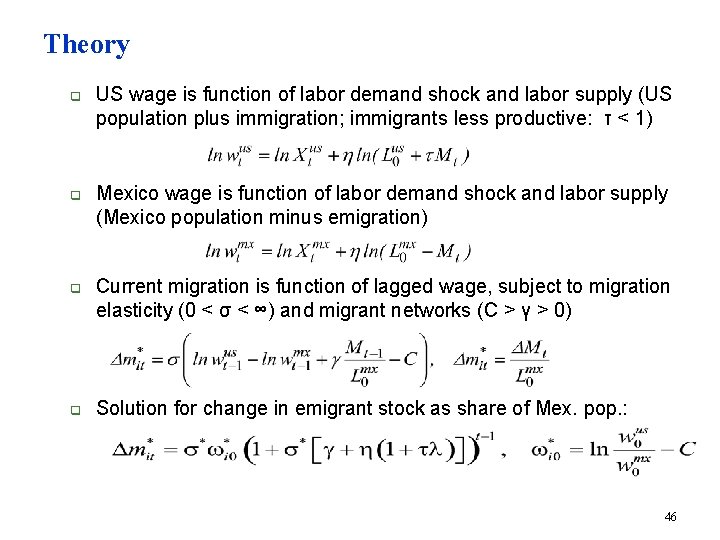
Theory q q US wage is function of labor demand shock and labor supply (US population plus immigration; immigrants less productive: τ < 1) Mexico wage is function of labor demand shock and labor supply (Mexico population minus emigration) Current migration is function of lagged wage, subject to migration elasticity (0 < σ < ∞) and migrant networks (C > γ > 0) Solution for change in emigrant stock as share of Mex. pop. : 46
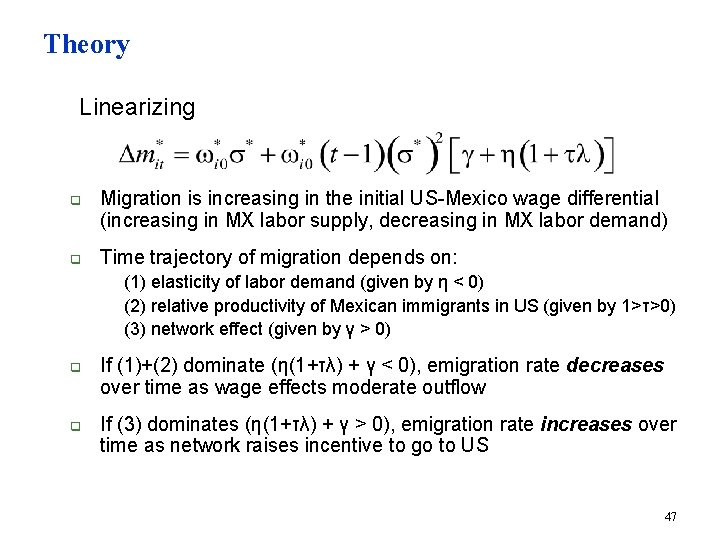
Theory n Linearizing q q Migration is increasing in the initial US-Mexico wage differential (increasing in MX labor supply, decreasing in MX labor demand) Time trajectory of migration depends on: n n n q q (1) elasticity of labor demand (given by η < 0) (2) relative productivity of Mexican immigrants in US (given by 1>τ>0) (3) network effect (given by γ > 0) If (1)+(2) dominate (η(1+τλ) + γ < 0), emigration rate decreases over time as wage effects moderate outflow If (3) dominates (η(1+τλ) + γ > 0), emigration rate increases over time as network raises incentive to go to US 47
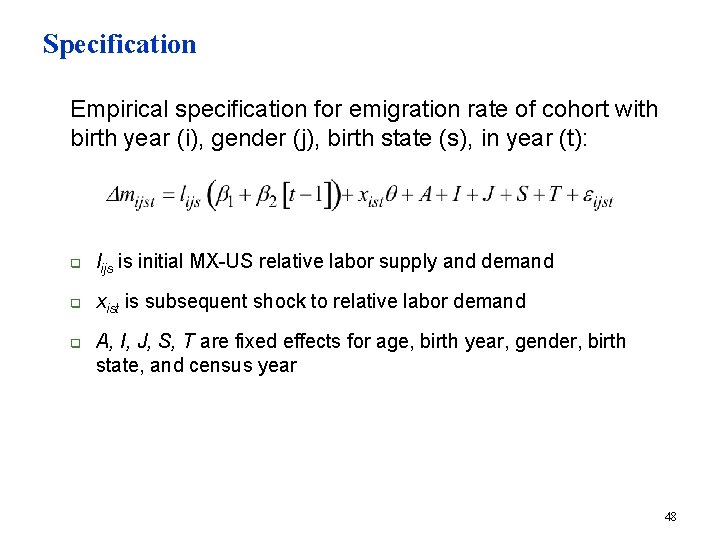
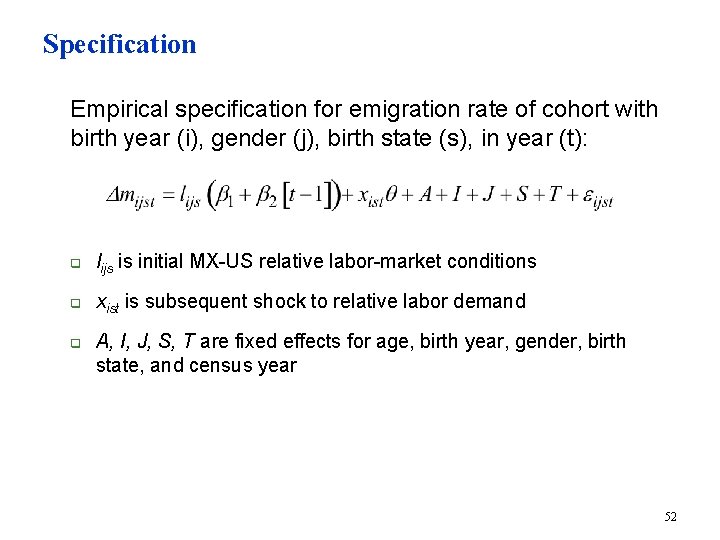
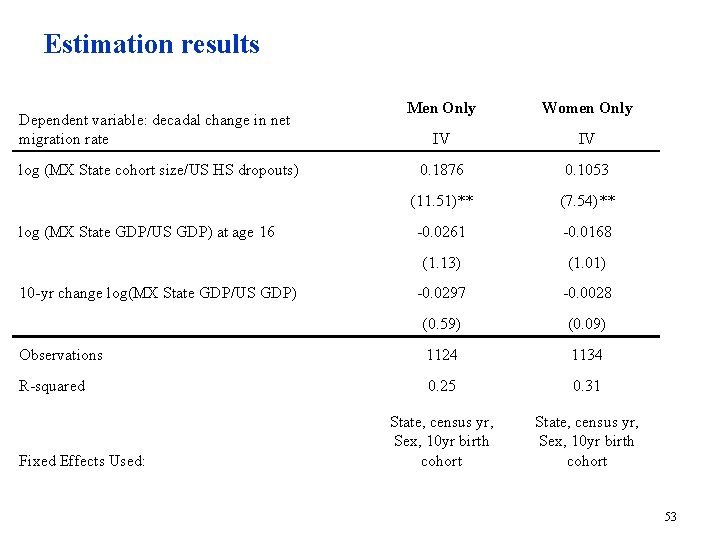
Specification n Empirical specification for emigration rate of cohort with birth year (i), gender (j), birth state (s), in year (t): q lijs is initial MX-US relative labor supply and demand q xist is subsequent shock to relative labor demand q A, I, J, S, T are fixed effects for age, birth year, gender, birth state, and census year 48
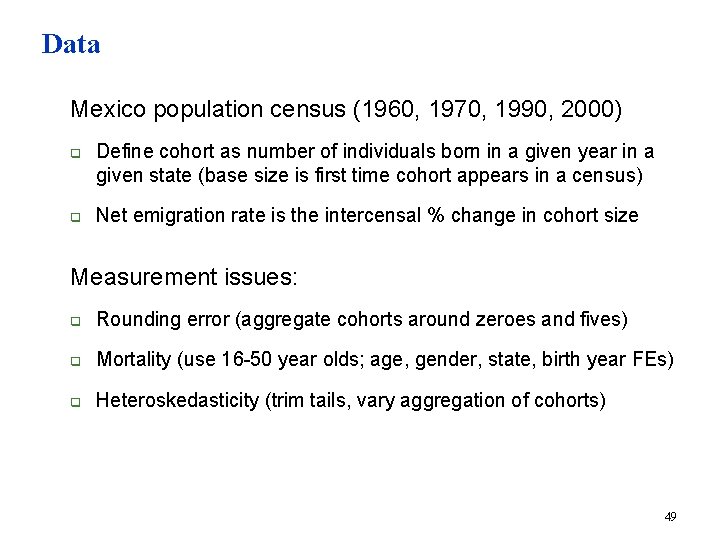
Data n Mexico population census (1960, 1970, 1990, 2000) q q n Define cohort as number of individuals born in a given year in a given state (base size is first time cohort appears in a census) Net emigration rate is the intercensal % change in cohort size Measurement issues: q Rounding error (aggregate cohorts around zeroes and fives) q Mortality (use 16 -50 year olds; age, gender, state, birth year FEs) q Heteroskedasticity (trim tails, vary aggregation of cohorts) 49
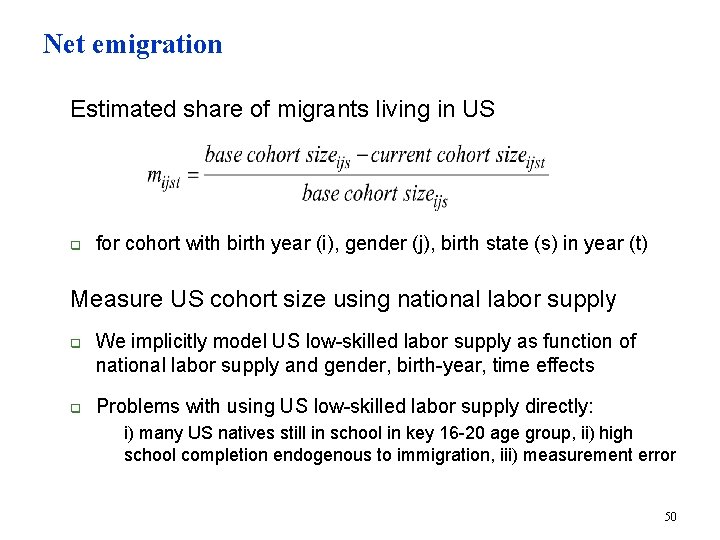
Net emigration n Estimated share of migrants living in US q n for cohort with birth year (i), gender (j), birth state (s) in year (t) Measure US cohort size using national labor supply q q We implicitly model US low-skilled labor supply as function of national labor supply and gender, birth-year, time effects Problems with using US low-skilled labor supply directly: n i) many US natives still in school in key 16 -20 age group, ii) high school completion endogenous to immigration, iii) measurement error 50
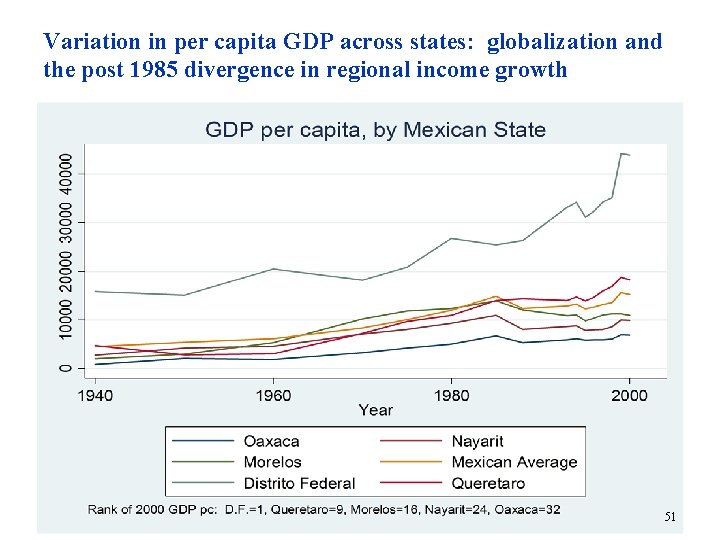
Variation in per capita GDP across states: globalization and the post 1985 divergence in regional income growth 51
Specification n Empirical specification for emigration rate of cohort with birth year (i), gender (j), birth state (s), in year (t): q lijs is initial MX-US relative labor-market conditions q xist is subsequent shock to relative labor demand q A, I, J, S, T are fixed effects for age, birth year, gender, birth state, and census year 52
Estimation results Men Only Women Only IV IV 0. 1876 0. 1053 (11. 51)** (7. 54)** -0. 0261 -0. 0168 (1. 13) (1. 01) -0. 0297 -0. 0028 (0. 59) (0. 09) Observations 1124 1134 R-squared 0. 25 0. 31 State, census yr, Sex, 10 yr birth cohort Dependent variable: decadal change in net migration rate log (MX State cohort size/US HS dropouts) log (MX State GDP/US GDP) at age 16 10 -yr change log(MX State GDP/US GDP) Fixed Effects Used: 53
54
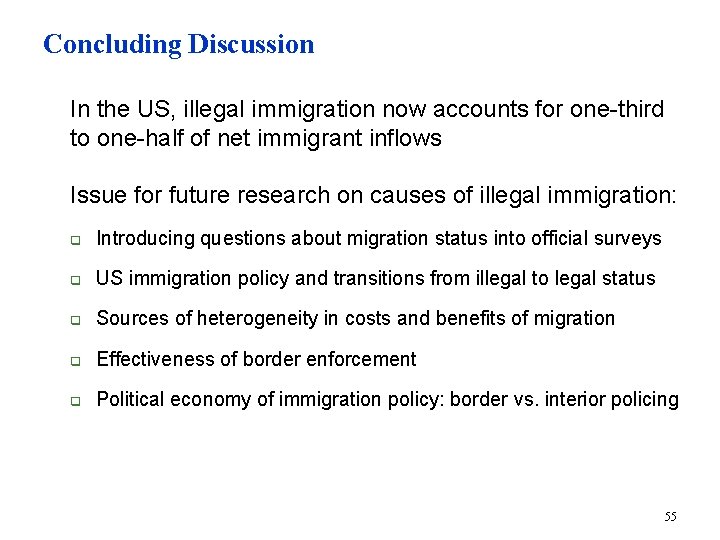
Concluding Discussion n In the US, illegal immigration now accounts for one-third to one-half of net immigrant inflows n Issue for future research on causes of illegal immigration: q Introducing questions about migration status into official surveys q US immigration policy and transitions from illegal to legal status q Sources of heterogeneity in costs and benefits of migration q Effectiveness of border enforcement q Political economy of immigration policy: border vs. interior policing 55