Hydrologic Cycle and Precipitation Lecture Goals 1 Understand


 • Climate/Weather data • http:")

 Runoff = Inputs –")


 +")


")


 • Compute area between each")

 • Duration (time) • Frequency (time)")


 is the period within which the")


- Slides: 42
Hydrologic Cycle and Precipitation
Lecture Goals 1. Understand the major components of the hydrologic cycle. 2. Appreciate the wide variety of precipitation types in various climate regions and lay a foundation for how precipitation affects upcoming topics such as runoff and erosion. 3. Quantitatively use important concepts such as return period and storm duration. 4. Discuss precipitation data availability Key Words: hydrology cycle, precipitation, water balance
What are the components of the hydrologic cycle?
Hydrologic Cycle
Hydrologic Measurements • Want data to help understand weather patterns, help predict future weather, design conservation structures, reduce NPS pollution, etc. • Precipitation – rain gage and/or snow gage • Accumulated snow – snow survey • Runoff – stream gages • Evaporation – pan, ET w/ lysimeters, sap flow meters • Groundwater levels – monitoring wells • Other important meteorological data for modeling and design: • Wind speed • Solar radiation • Temperature
Hydrologic Data • National Oceanic and Atmospheric Administration (NOAA) • Climate/Weather data • http: //www. noaa. gov/ • http: //hdsc. nws. noaa. gov/hdsc/pfds/ • http: //www. ncdc. noaa. gov/ • United States Geological Survey (USGS) • Water Quantity • http: //www. usgs. gov/ • United States Environmental Protection Agency (USEPA) • Water Quality • http: //www 3. epa. gov/ • United States Department of Agriculture (USDA) • Soils • http: //websoilsurvey. sc. egov. usda. gov/App/Home. Page. htm
Hydrologic Data Analysis • Statistics – the science of collecting, summarizing, organizing, analyzing, exploring and interpreting data. • Plot data • Descriptive Statistics • Statistics of location/central tendency • Statistics of dispersion and variability • Experimental Error • Standard Error • Confidence Intervals • Probabilities and Distributions
The Drainage Basin as a Flow System (From Jones 1997) Runoff = Inputs – Outputs Storage
Water Balance Inputs – Outputs = Change in Storage Precipitation Runoff Subsurface Flow Irrigation Storage Evaporation Transpiration Runoff • Water Budget Volumes Infiltration Deep Seepage • • Ft 3 (m 3) Gal (L) Acre-feet (ac-ft) Inches (cm) over an area
Example How much irrigation is required during the growing season if the crop requires 850 mm of water for optimal production? How many liters of water will be pumped if the field is 10 ha? Precipitation = 500 mm Percolation below root zone 50 mm Runoff = 15 mm
Solution Inputs – Outputs = Change in Storage Inputs = precipitation (500 mm) + irrigation (? ) Outputs = runoff (15 mm) and deep seepage (50 mm) Change in storage = Water required by plants (850 mm) (500 + I) – (15 + 50) = 850 Irrigation = 415 mm Liters of water = 415 mm * 10 ha = 0. 415 m * 100, 000 m 2 = 41500 m 3 = 41, 500, 000 L
Precipitation
What is precipitation?
Precipitation • Precipitation: water falling from the atmosphere to the earth. • The primary input into the hydrologic cycle. • Atmospheric moisture condenses and forms: • Rain, snow, hail, drizzle, sleet, fog and dew. • Most precipitation falls as rain. • Rain has the largest impact on erosion. • Requires lifting of air mass so that it cools and condenses.
How does precipitation form?
Mechanisms for air lifting
Condensation • Condensation is the change of water vapor into a liquid. For condensation to occur, the air must be at or near saturation in the presence of condensation nuclei. • Condensation nuclei are small particles or aerosol upon which water vapor attaches to initiate condensation. Dust particulates, sea salt, sulfur and nitrogen oxide aerosols serve as common condensation nuclei. • Size of aerosols range from 10 -3 to 10 mm.
Precipitation formation • Lifting cools air masses so moisture condenses • Condensation nuclei (Aerosols) that water molecules attach to • Rising & growing • 0. 5 cm/s sufficient to carry 10 mm droplet • Critical size (~0. 1 mm) • Gravity overcomes and drop falls
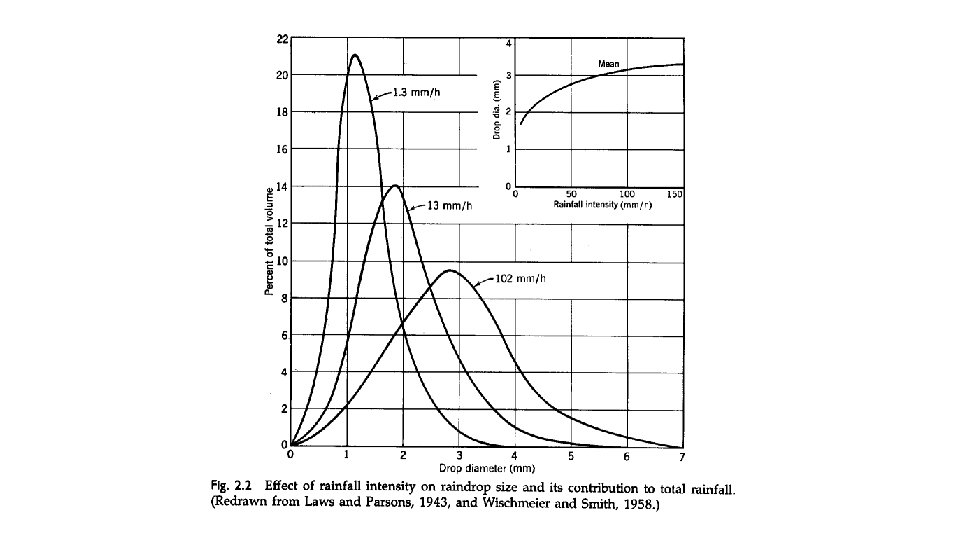
Rain • Raindrops can be as large as 7 mm in diameter. • Uniform droplets less than 0. 5 mm in diameter is drizzle. • The speed of fall depends on the size of the raindrop. • Terminal velocity, Vterm=3. 86 D 0. 67 • Larger raindrops have more energy. • Higher intensity storms typically have larger raindrops. • Intensity = depth of precipitation / time
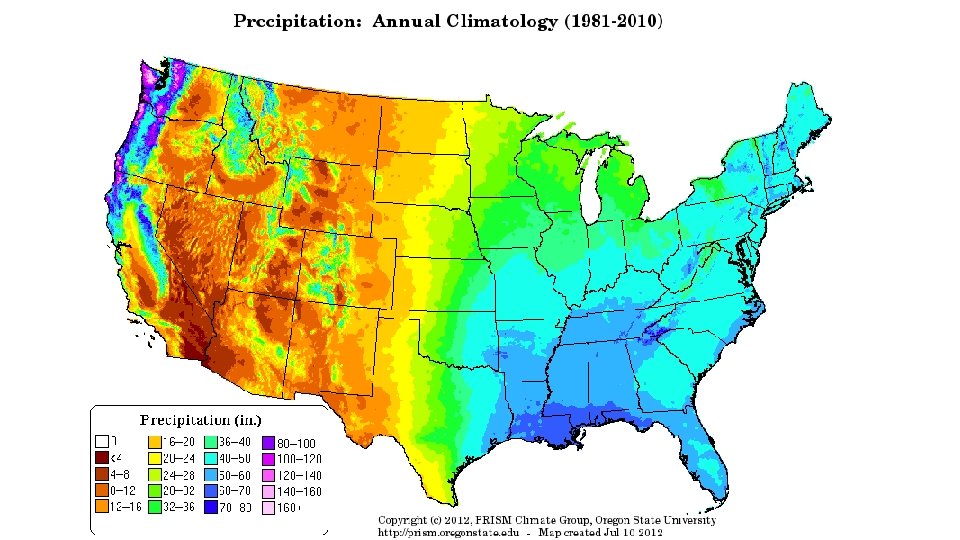
Precipitation Variation • Influenced by • Atmospheric circulation and local factors • Higher near coastlines • Seasonal variation – annual oscillations in some places • Variables in mountainous areas • Increases in plains areas • More uniform in Eastern US than in West
Global Rainfall
How is precipitation measured?
Precipitation Measurement
Cumulative Rainfall Mass Curve
Arithmetic Mean Method • Simplest method for determining areal average P 1 = 10 mm P 1 P 2 = 20 mm P 3 = 30 mm P 2 P 3 • Gages must be uniformly distributed • Gage measurements should not vary greatly about the mean
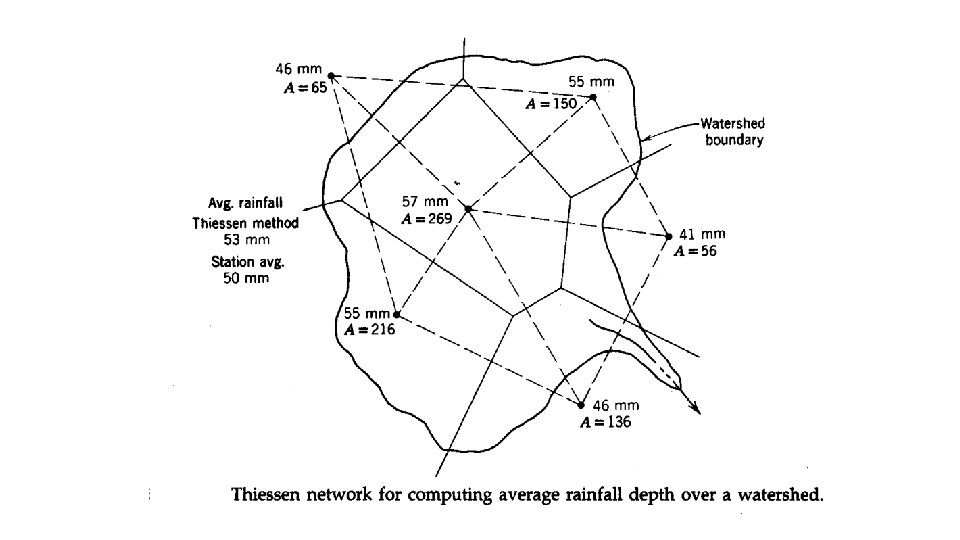
Thiessen polygon method • • • Any point in the watershed receives the same amount of rainfall as that at the nearest gage Rainfall recorded at a gage can be applied to any point at a distance halfway to the next station in any direction Steps in Thiessen polygon method 1. Draw lines joining adjacent gages 2. Draw perpendicular bisectors to the lines created in step 1 3. Extend the lines created in step 2 in both directions to form representative areas for gages 4. Compute representative area for each gage 5. Compute the areal average using the following formula P 1 A 1 P 2 A 2 P 3 A 3 P 1 = 10 mm, A 1 = 12 Km 2 P 2 = 20 mm, A 2 = 15 Km 2 P 3 = 30 mm, A 3 = 20 km 2
Isohyetal method • Steps • Construct isohyets (rainfall contours) • Compute area between each pair of adjacent isohyets (Ai) • Compute average precipitation for each pair of adjacent isohyets (pi) • Compute areal average using the following formula 10 20 P 1 A 1=5 , p 1 = 5 A 2=18 , p 2 = 15 P 2 A 3=12 , p 3 = 25 30 P 3 A 4=12 , p 3 = 35
NEXRAD • NEXt generation RADar: is a doppler radar used for obtaining weather information • A signal is emitted from the radar which returns after striking a rainfall drop • Returned signals from the radar are analyzed to compute the rainfall intensity and integrated over time to get the precipitation NEXRAD Tower http: //radar. weather. gov/radar. php? rid=twx&produ ct=N 0 R&overlay=11101111&loop=no
Precipitation Data Analysis • Intensity (mm/hr) • Duration (time) • Frequency (time)
Hydrologic Frequency Analysis • Many statistical methods have been used for precipitation analysis. • Connect discrete precipitation event analyses to design storm prediction. • Used for predicting storms of specific frequency and duration for a given location.
Hydrologic Frequency Analysis T = 100/P Where T = return period in years, P = probability in percent that an observed event in a given year is equal to or greater than a given event.
Return Period • The return period (reoccurrence interval) is the period within which the depth of precipitation for a specified duration will be equaled or exceeded once on the average • Example: • The 100 yr-24 hr precipitation depth for Manhattan, KS is 7. 5 inches. • Thus, Manhattan receives 7. 5 inches of precipitation within a 24 hr period on average once every 100 years over many 100 year periods.
'1, 000 -year' flood: Weather hyperbole or hard science? • http: //www. cnn. com/videos/weather/2015/10/04/south-carolina-flood-govnikki-haley-sot. wis
Example What is the probability that an event with a 10 year return period will occur in any given year? P = 100/T = 100/10 = 10% The probability of occurrence for a precipitation event is 40%. How often do expect this event? T = 100/P = 100/40 = 2. 5 years
United States Resources • www. weather. gov • http: //hdsc. nws. noaa. gov/hdsc/pfds/ • http: //www. ncdc. noaa. gov/ • https: //www. ksre. ksu. edu/wdl/