CE 461 Hydrology NRCS Hyetographs Objective Able to

CE 461 Hydrology NRCS Hyetographs

Objective • Able to develop NRCS design hyetographs

Definitions • Hyetograph – rain or rain intensity as a function of time • Incremental hyetograph – rainfall amount given during time increments – P(t) • Cumulative hyetograph – rainfall amount since the beginning of the storm • Synthetic hyetograph – artificial hyetograph developed for design purposes • Continuous hyetograph – rainfall given over a period of time such as a year

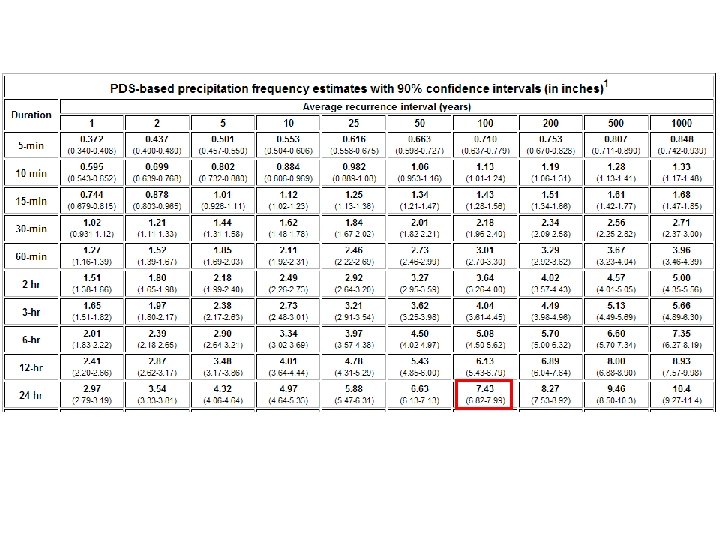
Definitions continued • Storm return period – the average time in years of rainfall of a given depth and duration • Example – 100 -year, 24 -hr storm – On average, once in 100 years P 100 -24 inches (mm) of rain will fall in 24 hours – Bowling Green P 100 -24 = 7. 43 inches

Hyetograph Categories • Real Storm – Rain gage measured hyetograph – Radar measured rainfall varying in space and time • Synthetic – NRCS – Huff • Example: Lexington-Fayette County requires both for watershed modeling

Rain Varies in Time and Space Source: Google Images

Tipping Bucket Rain Gage Source: Rickley Hydrologic

Operation Source: UC Davis

Sources of Error • High intensity rainfall • Wind

NEXRAD • NEXt Generation RADar Source: Hayes Tropical Weather Pages

Composite NEXRAD

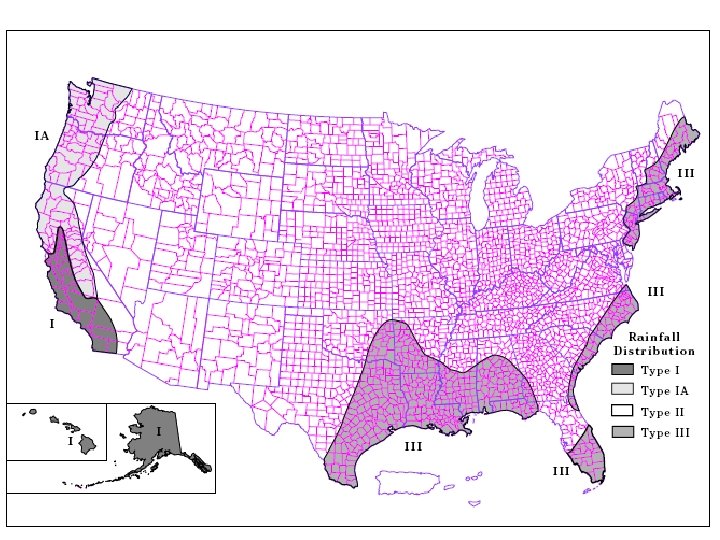
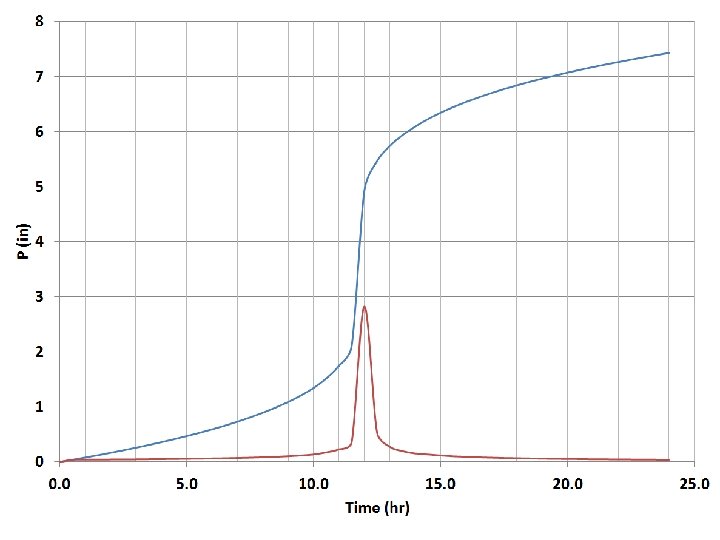
NRCS • • Table 6. 3, pp. 135 -136 Semi-dimensionless P/PTotal vs time NRCS hyetograph represents a 24 -hr storm. To obtain the 24 -hr dimensional hyetograph, multiply P/PTotal by PTotal for the storm.

NRCS to Design Hyetograph • NRCS storm is a 24 hour storm; use the times in the NRCS chart. • Multiply the Pcum/PTotal column by the precipitation total (PTotal). • Pi = Pcumi – Pcumi-1

Example Find the 100 -yr, 24 -hr NRCS storm for Bowling Green.
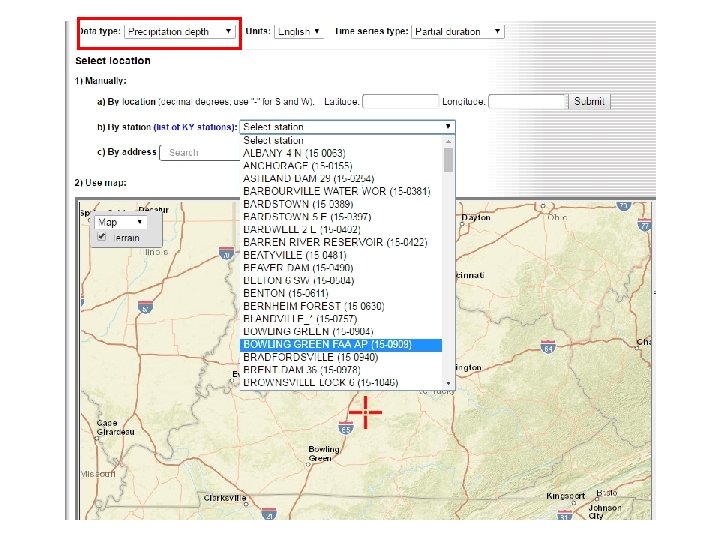

All of Kentucky is NRCS Type II. Copy the Type II column from Table 6 -3, p. 135 in text.

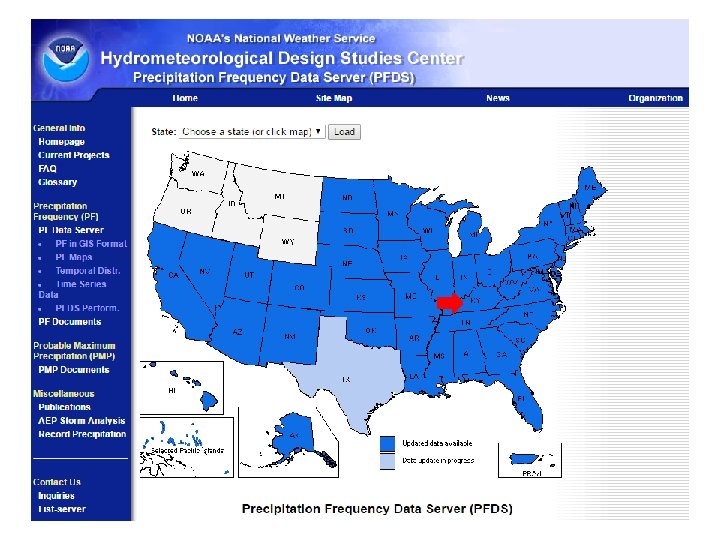
Summary • Be able to develop NRCS curves for any place in the country. • Be able to use Atlas 14.
- Slides: 23