High Voltage MUX for ATLAS Tracker Upgrade EG


- Slides: 26
High Voltage MUX for ATLAS Tracker Upgrade EG Villani STFC RAL on behalf of the ATLAS HVMUX group TWEPP-14, 22 – 26 Sept. 2014
Outline • HV MUX motivation and principle • HV MUX devices requirements • Real time test system and test results • Conclusions
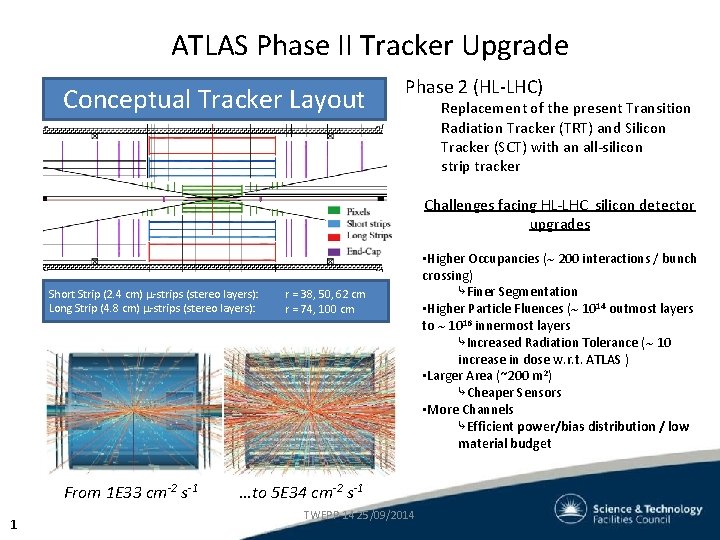
ATLAS Phase II Tracker Upgrade Conceptual Tracker Layout Phase 2 (HL-LHC) Replacement of the present Transition Radiation Tracker (TRT) and Silicon Tracker (SCT) with an all-silicon strip tracker Challenges facing HL-LHC silicon detector upgrades Short Strip (2. 4 cm) -strips (stereo layers): Long Strip (4. 8 cm) -strips (stereo layers): From 1 E 33 cm-2 s-1 1 r = 38, 50, 62 cm r = 74, 100 cm …to 5 E 34 cm-2 s-1 TWEPP-14 25/09/2014 • Higher Occupancies ( 200 interactions / bunch crossing) ⤷Finer Segmentation • Higher Particle Fluences ( 1014 outmost layers to 1016 innermost layers ⤷Increased Radiation Tolerance ( 10 increase in dose w. r. t. ATLAS ) • Larger Area (~200 m 2) ⤷Cheaper Sensors • More Channels ⤷Efficient power/bias distribution / low material budget
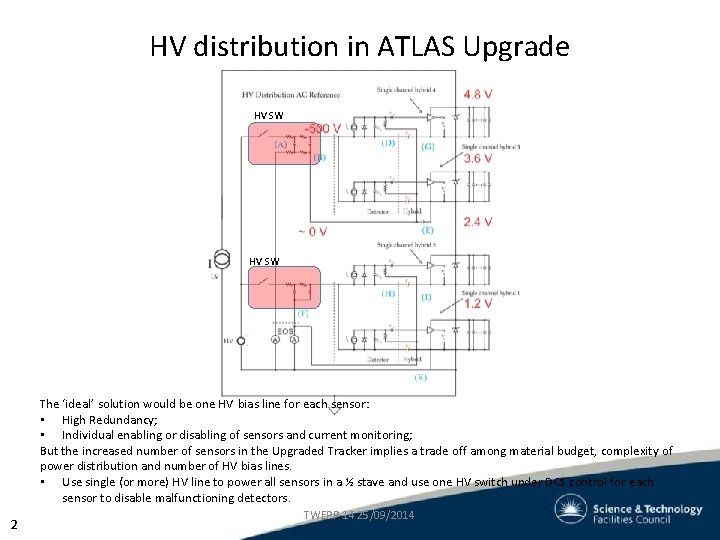
HV distribution in ATLAS Upgrade HV SW The ‘ideal’ solution would be one HV bias line for each sensor: • High Redundancy; • Individual enabling or disabling of sensors and current monitoring; But the increased number of sensors in the Upgraded Tracker implies a trade off among material budget, complexity of power distribution and number of HV bias lines. • Use single (or more) HV line to power all sensors in a ½ stave and use one HV switch under DCS control for each sensor to disable malfunctioning detectors. 2 TWEPP-14 25/09/2014
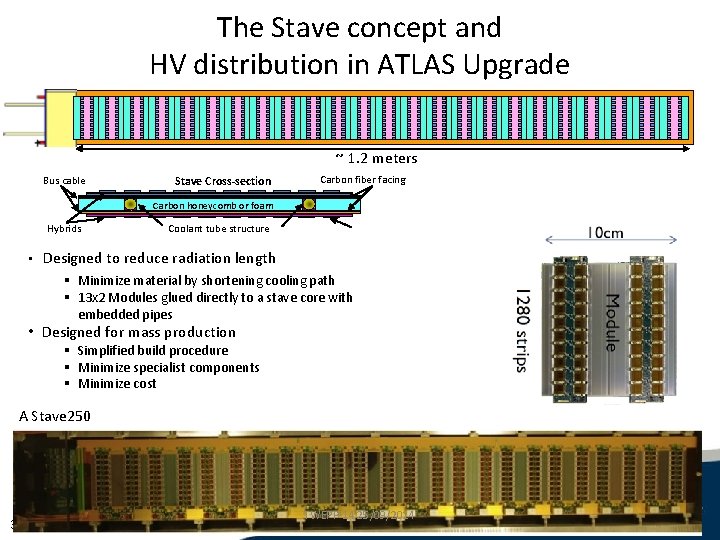
The Stave concept and HV distribution in ATLAS Upgrade ~ 1. 2 meters Bus cable Stave Cross-section Carbon fiber facing Carbon honeycomb or foam Hybrids Coolant tube structure • Designed to reduce radiation length § Minimize material by shortening cooling path § 13 x 2 Modules glued directly to a stave core with embedded pipes • Designed for mass production § Simplified build procedure § Minimize specialist components § Minimize cost A Stave 250 3 TWEPP-14 25/09/2014
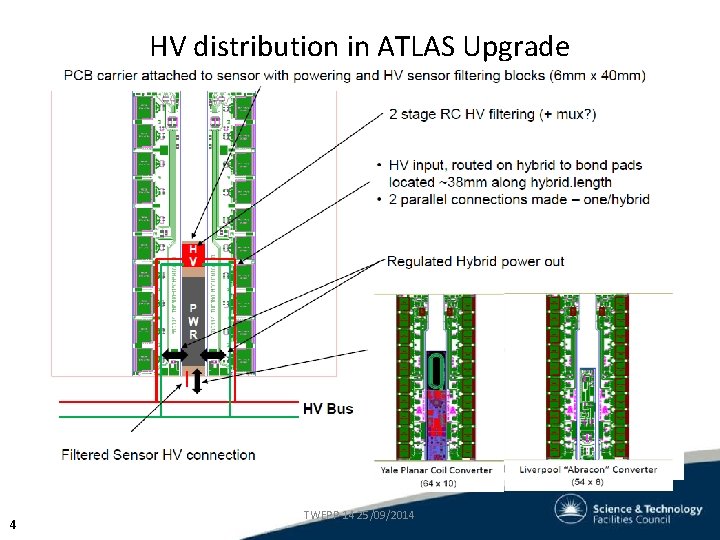
HV distribution in ATLAS Upgrade 4 TWEPP-14 25/09/2014
HV devices requirements High Voltage switches strip detector requirements: • Must be rated to 500 V plus a safety margin; • Must be radiation hard, nominal maximum expected 1 x 10¹⁵ neq/cm 2 , 30 Mrad (Si) for end cap. Multiply by (up to) 2 to include safety margin; • On-state impedance Ron << 1 kΩ // Ion 10 m. A (for irradiated sensors) • Off-state impedance Roff >> 1 GΩ // Ilkg << Isens • Must be unaffected by magnetic field; • Must maintain satisfactory performance at -30 C; • Must be small (area constraint) and cheap (around 1 E 4 needed) 5 TWEPP-14 25/09/2014
HV devices investigated HV Si, Si. C and Ga. N based devices are being investigated FAILED FAILED PASS – N. A. FAILED FAILED T. B. T. PASS – need conf. 6 TWEPP-14 25/09/2014
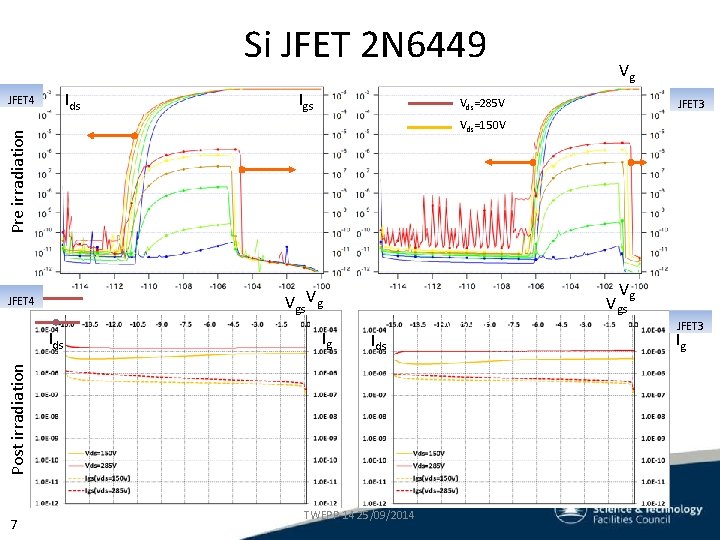
Si JFET 2 N 6449 Ids Background Igs PCBVds. JFETs =285 V Ids JFET 4 Vg Vgs Vg Ig Ids Post irradiation Ids 7 JFET 3 Vds=150 V Pre irradiation JFET 4 Vg TWEPP-14 25/09/2014 PCB JFETs Vgs JFET 3 Ig
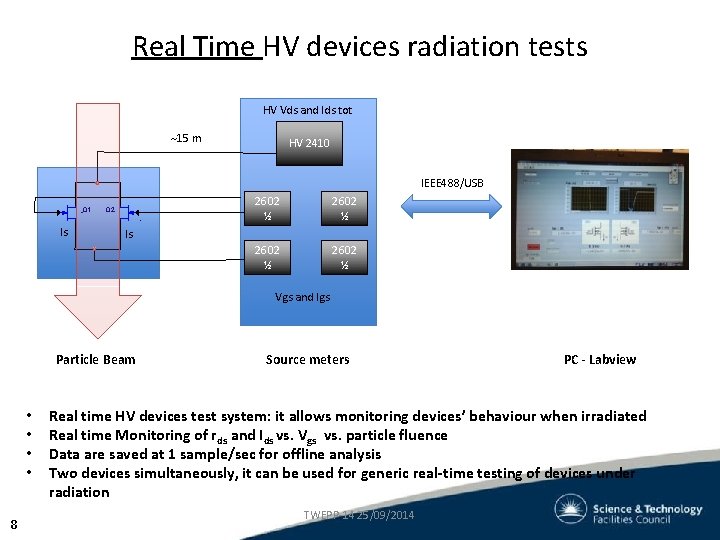
Real Time HV devices radiation tests HV Vds and Ids tot 15 m HV 2410 IEEE 488/USB Q 1 Is Q 2 2602 ½ Is Vgs and Igs Particle Beam • • 8 Source meters PC - Labview Real time HV devices test system: it allows monitoring devices’ behaviour when irradiated Real time Monitoring of rds and Ids vs. Vgs vs. particle fluence Data are saved at 1 sample/sec for offline analysis Two devices simultaneously, it can be used for generic real-time testing of devices under radiation TWEPP-14 25/09/2014
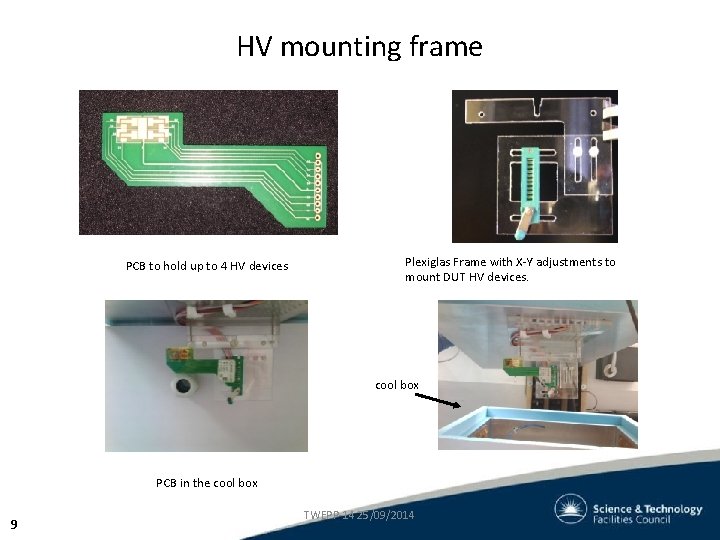
HV mounting frame PCB to hold up to 4 HV devices Plexiglas Frame with X-Y adjustments to mount DUT HV devices. cool box PCB in the cool box 9 TWEPP-14 25/09/2014
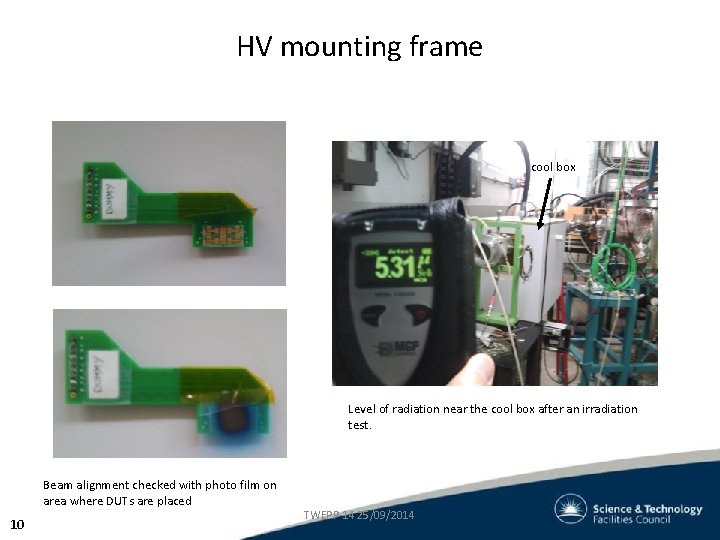
HV mounting frame cool box Level of radiation near the cool box after an irradiation test. Beam alignment checked with photo film on area where DUTs are placed 10 TWEPP-14 25/09/2014
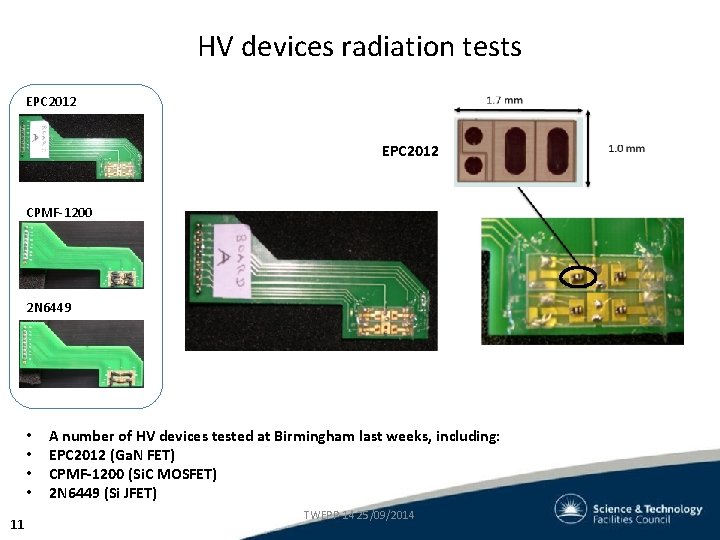
HV devices radiation tests EPC 2012 CPMF-1200 2 N 6449 • • 11 A number of HV devices tested at Birmingham last weeks, including: EPC 2012 (Ga. N FET) CPMF-1200 (Si. C MOSFET) 2 N 6449 (Si JFET) TWEPP-14 25/09/2014
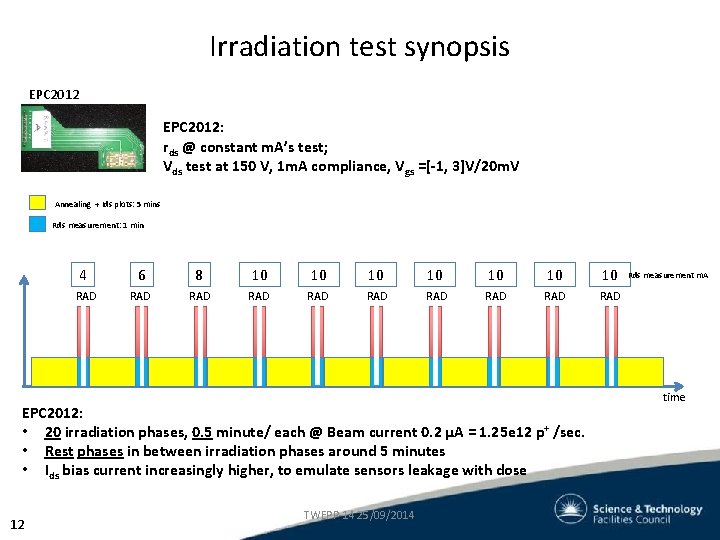
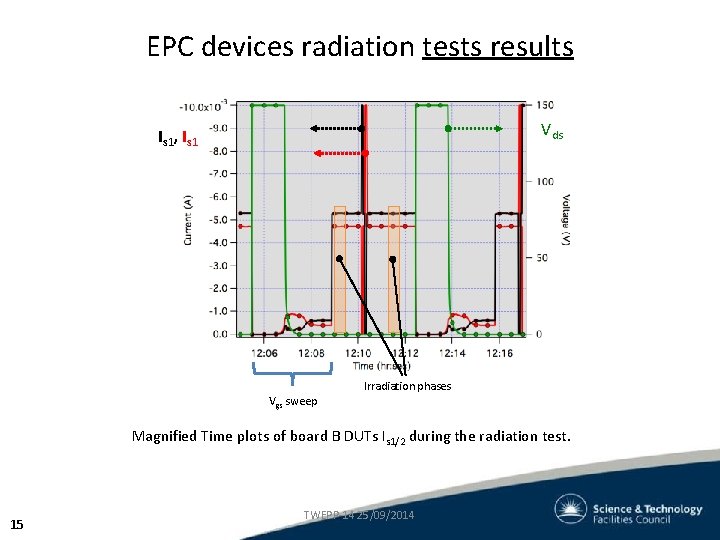
Irradiation test synopsis EPC 2012: rds @ constant m. A’s test; Vds test at 150 V, 1 m. A compliance, Vgs =[-1, 3]V/20 m. V Annealing + Ids plots: 5 mins Rds measurement: 1 min 4 6 8 10 10 RAD RAD RAD EPC 2012: • 20 irradiation phases, 0. 5 minute/ each @ Beam current 0. 2 μA = 1. 25 e 12 p+ /sec. • Rest phases in between irradiation phases around 5 minutes • Ids bias current increasingly higher, to emulate sensors leakage with dose 12 TWEPP-14 25/09/2014 Rds measurement m. A time
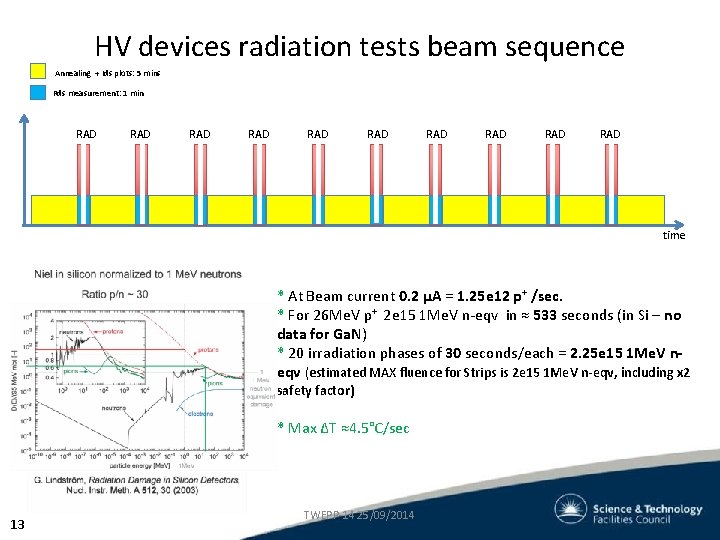
HV devices radiation tests beam sequence Annealing + Ids plots: 5 mins Rds measurement: 1 min RAD RAD RAD time * At Beam current 0. 2 μA = 1. 25 e 12 p+ /sec. * For 26 Me. V p+ 2 e 15 1 Me. V n-eqv in ≈ 533 seconds (in Si – no data for Ga. N) * 20 irradiation phases of 30 seconds/each = 2. 25 e 15 1 Me. V neqv (estimated MAX fluence for Strips is 2 e 15 1 Me. V n-eqv, including x 2 safety factor) * Max ΔT ≈4. 5°C/sec 13 TWEPP-14 25/09/2014
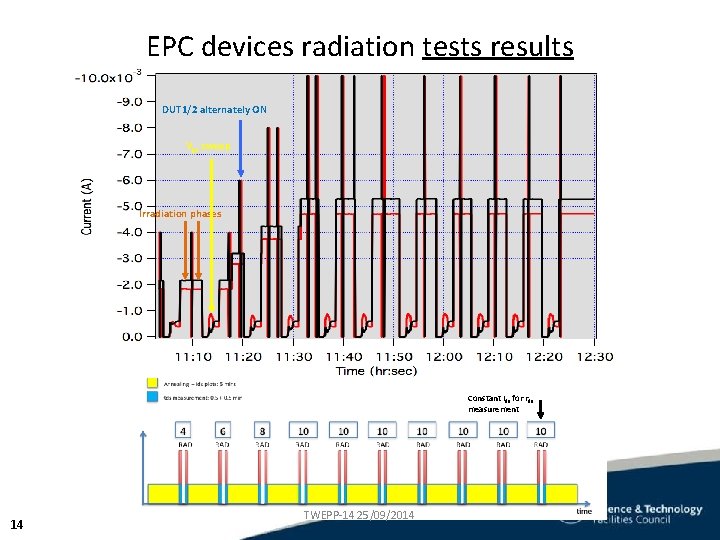
EPC devices radiation tests results DUT 1/2 alternately ON Vgs sweep Irradiation phases Constant Ids for rds measurement 14 TWEPP-14 25/09/2014
EPC devices radiation tests results Vds Is 1, Is 1 Irradiation phases Vgs sweep Magnified Time plots of board B DUTs Is 1/2 during the radiation test. 15 TWEPP-14 25/09/2014
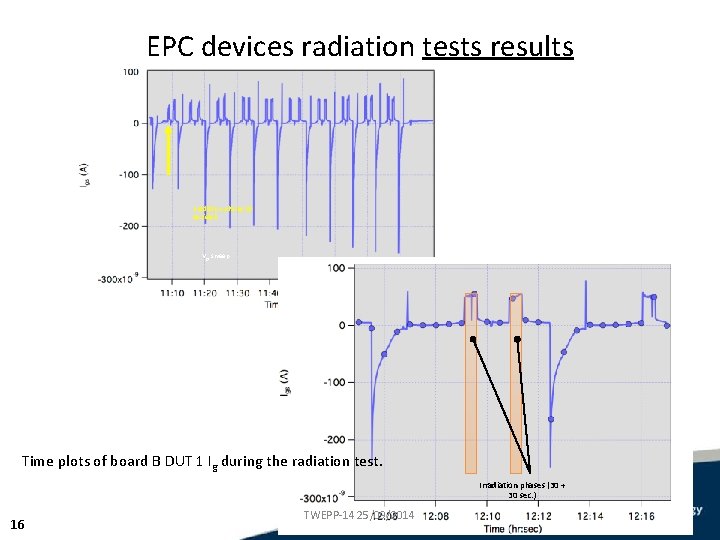
EPC devices radiation tests results Irradiation phases 30 sec/each Vgs sweep Time plots of board B DUT 1 Ig during the radiation test. Irradiation phases (30 + 30 sec. ) 16 TWEPP-14 25/09/2014
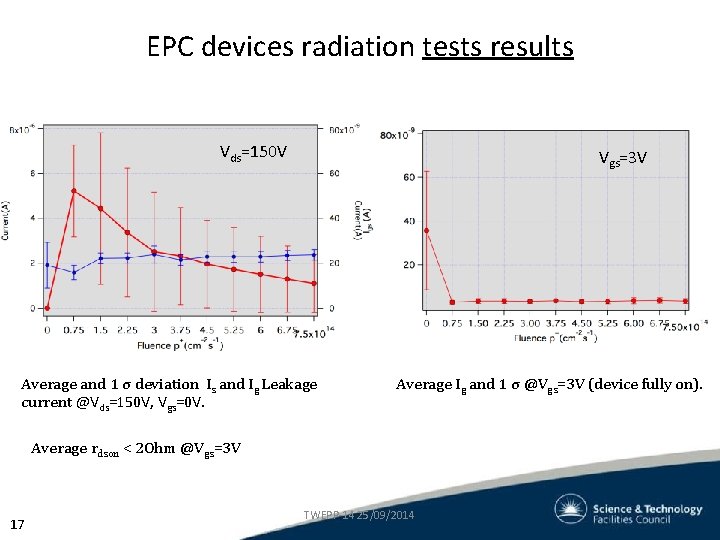
EPC devices radiation tests results Vds=150 V Vgs=3 V Average and 1 σ deviation Is and Ig Leakage current @Vds=150 V, Vgs=0 V. Average Ig and 1 σ @Vgs=3 V (device fully on). Average rdson < 2 Ohm @Vgs=3 V 17 TWEPP-14 25/09/2014
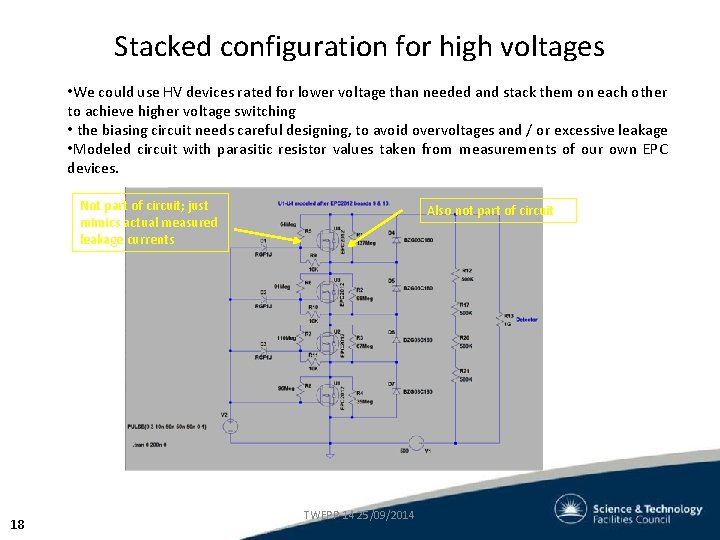
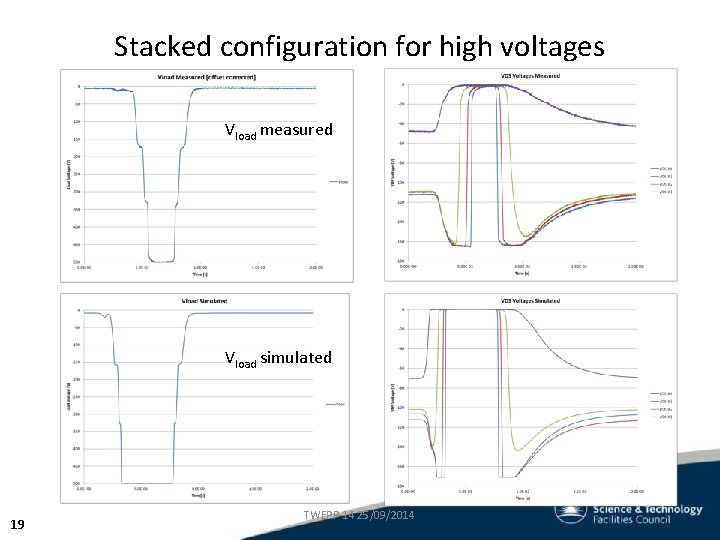
Stacked configuration for high voltages • We could use HV devices rated for lower voltage than needed and stack them on each other to achieve higher voltage switching • the biasing circuit needs careful designing, to avoid overvoltages and / or excessive leakage • Modeled circuit with parasitic resistor values taken from measurements of our own EPC devices. Not part of circuit; just mimics actual measured leakage currents 18 Also not part of circuit TWEPP-14 25/09/2014
Stacked configuration for high voltages Vload measured Vload simulated 19 TWEPP-14 25/09/2014
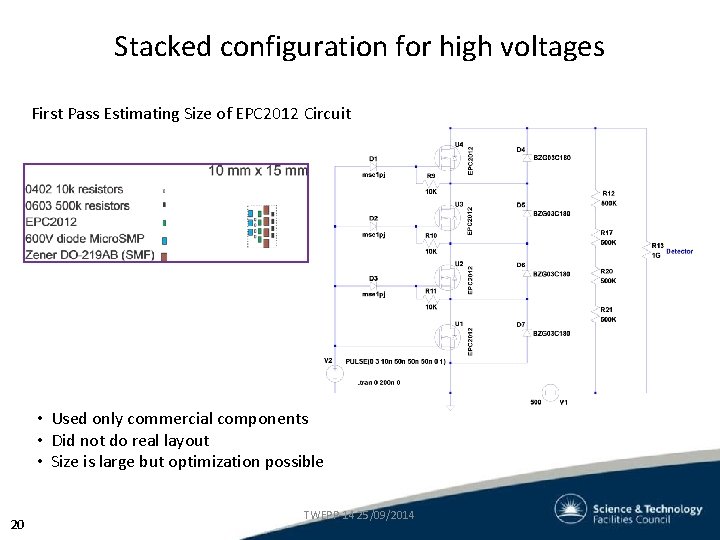
Stacked configuration for high voltages First Pass Estimating Size of EPC 2012 Circuit • Used only commercial components • Did not do real layout • Size is large but optimization possible 20 TWEPP-14 25/09/2014
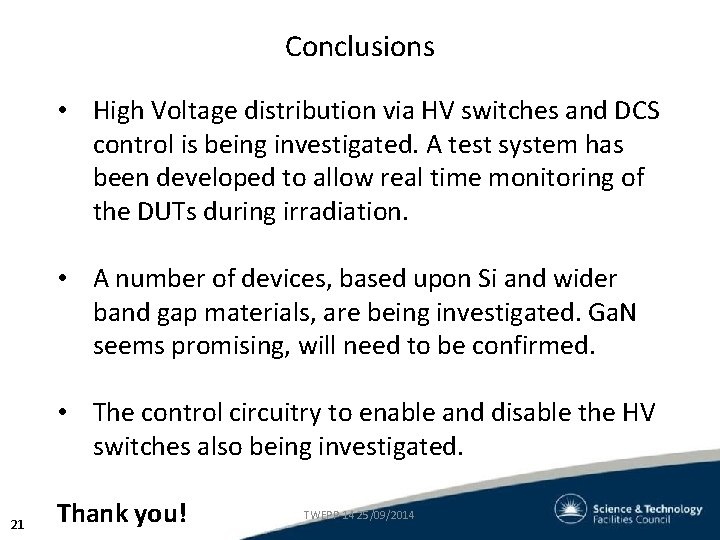
Conclusions • High Voltage distribution via HV switches and DCS control is being investigated. A test system has been developed to allow real time monitoring of the DUTs during irradiation. • A number of devices, based upon Si and wider band gap materials, are being investigated. Ga. N seems promising, will need to be confirmed. • The control circuitry to enable and disable the HV switches also being investigated. 21 Thank you! TWEPP-14 25/09/2014
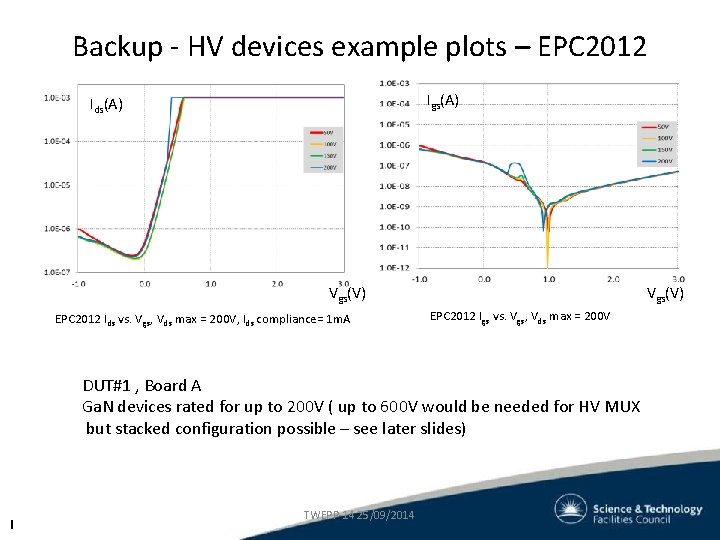
Backup - HV devices example plots – EPC 2012 Igs(A) Ids(A) Vgs(V) EPC 2012 Ids vs. Vgs, Vds max = 200 V, I ds compliance= 1 m. A Vgs(V) EPC 2012 Igs vs. Vgs, Vds max = 200 V DUT#1 , Board A Ga. N devices rated for up to 200 V ( up to 600 V would be needed for HV MUX but stacked configuration possible – see later slides) I TWEPP-14 25/09/2014
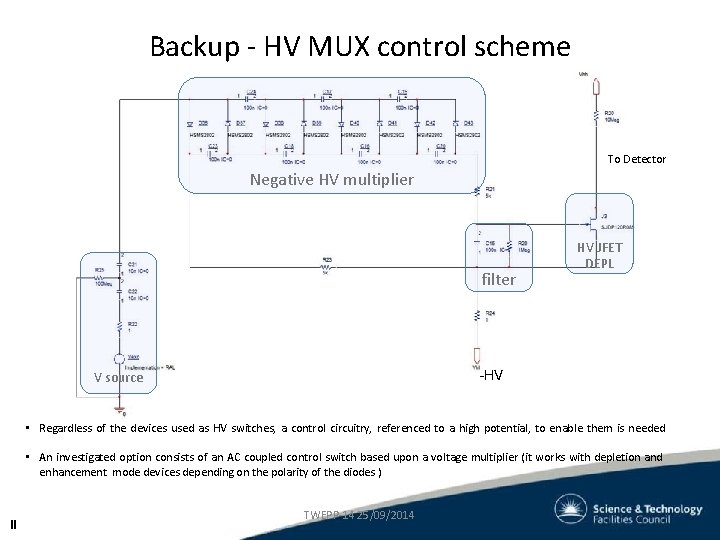
Backup - HV MUX control scheme To Detector Negative HV multiplier filter HV JFET DEPL -HV V source • Regardless of the devices used as HV switches, a control circuitry, referenced to a high potential, to enable them is needed • An investigated option consists of an AC coupled control switch based upon a voltage multiplier (it works with depletion and enhancement mode devices depending on the polarity of the diodes ) II TWEPP-14 25/09/2014
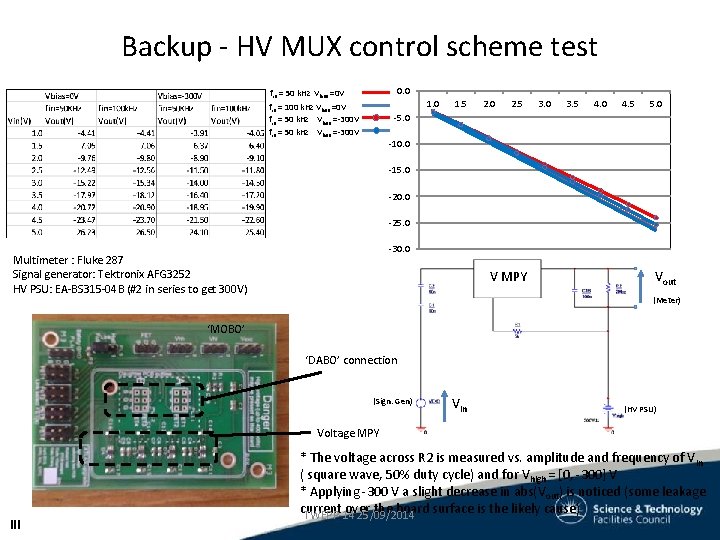
Backup - HV MUX control scheme test 0. 0 fin = 50 k. Hz Vbias =0 V 1. 0 fin = 100 k. Hz Vbias =0 V fin = 50 k. Hz Vbias =-300 V 1. 5 2. 0 2. 5 3. 0 3. 5 4. 0 4. 5 5. 0 -10. 0 -15. 0 -20. 0 -25. 0 -30. 0 Multimeter : Fluke 287 Signal generator: Tektronix AFG 3252 HV PSU: EA-BS 315 -04 B (#2 in series to get 300 V) V MPY Vout (Meter) ‘MOBO’ ‘DABO’ connection (Sign. Gen) Vin (HV PSU) Voltage MPY III * The voltage across R 2 is measured vs. amplitude and frequency of Vin ( square wave, 50% duty cycle) and for Vhigh = [0, -300] V * Applying -300 V a slight decrease in abs(Vout) is noticed (some leakage current over the board surface is the likely cause) TWEPP-14 25/09/2014