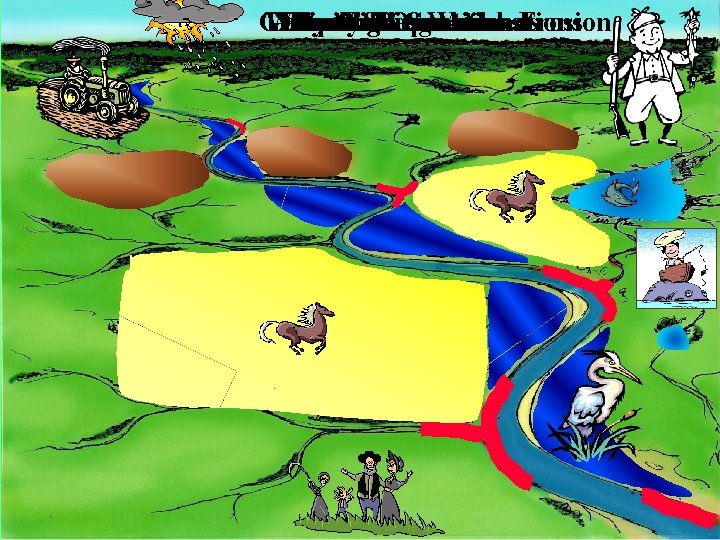
Gully Watershed Lakes Farming Family Climate Hunting Livestock


















- Slides: 67
Gully Watershed Lakes Farming Family Climate Hunting Livestock Riparian &Fishing &Streambank Recreation Reservoirs Operations Considerations &Wetlands Erosion
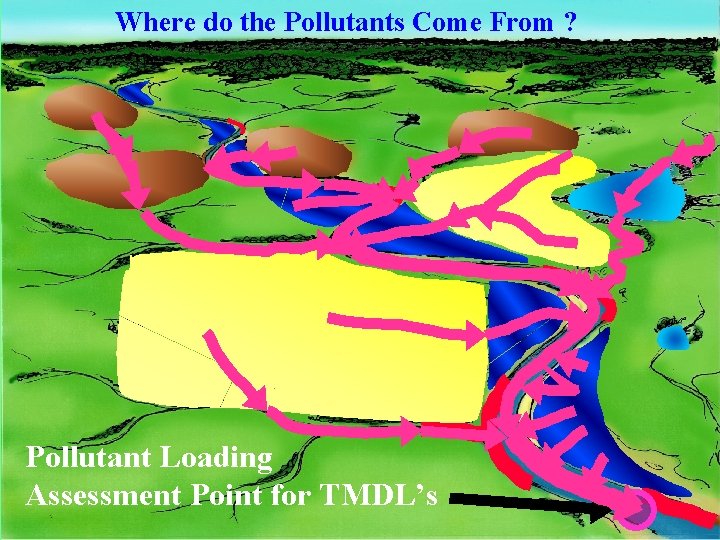
Where do the Pollutants Come From ? Pollutant Loading Assessment Point for TMDL’s
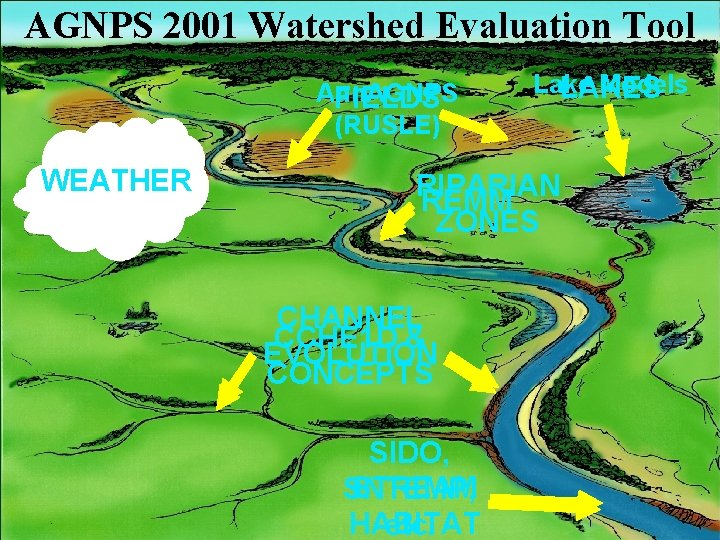
AGNPS 2001 Watershed Evaluation Tool Ann. AGNPS FIELDS (RUSLE) WEATHER GEM Lake Models LAKES RIPARIAN REMM ZONES CHANNEL CCHE 1 D & EVOLUTION CONCEPTS SIDO, STREAM SNTEMP, HABITAT etc.
AGNPS 2001 A partnering effort between the: Agricultural Research Service and Natural Resource Conservation Service
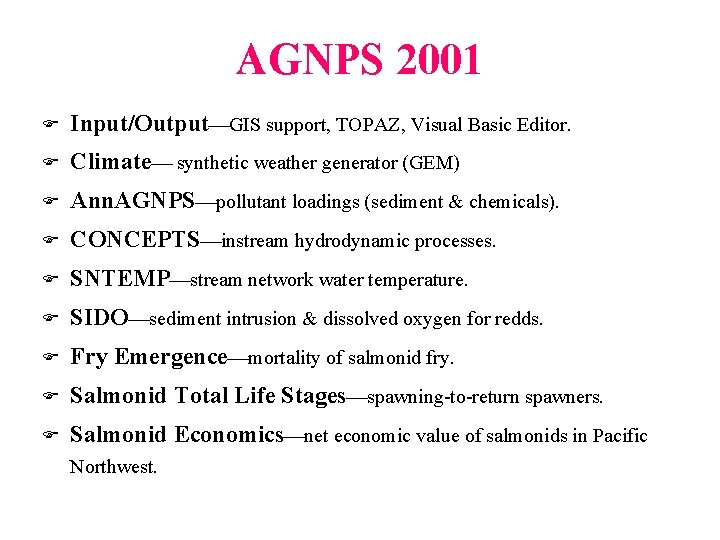
AGNPS 2001 F Input/Output GIS support, TOPAZ, Visual Basic Editor. F Climate synthetic weather generator (GEM) F Ann. AGNPS pollutant loadings (sediment & chemicals). F CONCEPTS instream hydrodynamic processes. F SNTEMP stream network water temperature. F SIDO sediment intrusion & dissolved oxygen for redds. F Fry Emergence mortality of salmonid fry. F Salmonid Total Life Stages spawning-to-return spawners. F Salmonid Economics net economic value of salmonids in Pacific Northwest.
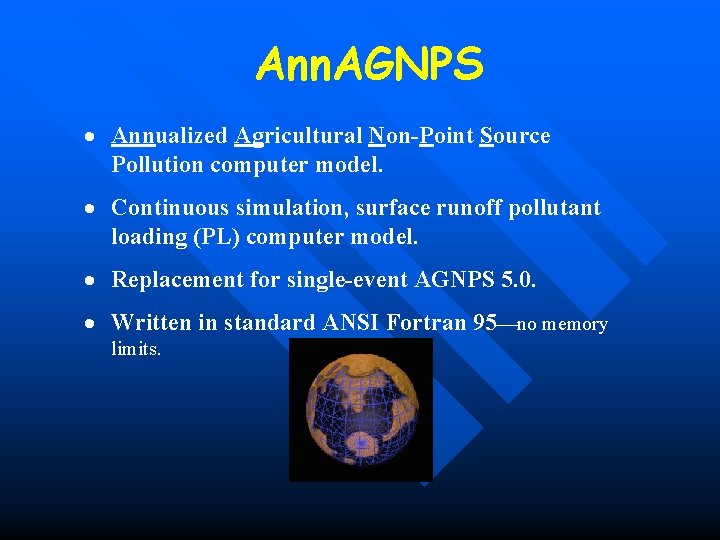
Ann. AGNPS · Annualized Agricultural Non-Point Source Pollution computer model. · Continuous simulation, surface runoff pollutant loading (PL) computer model. · Replacement for single-event AGNPS 5. 0. · Written in standard ANSI Fortran 95 no memory limits.
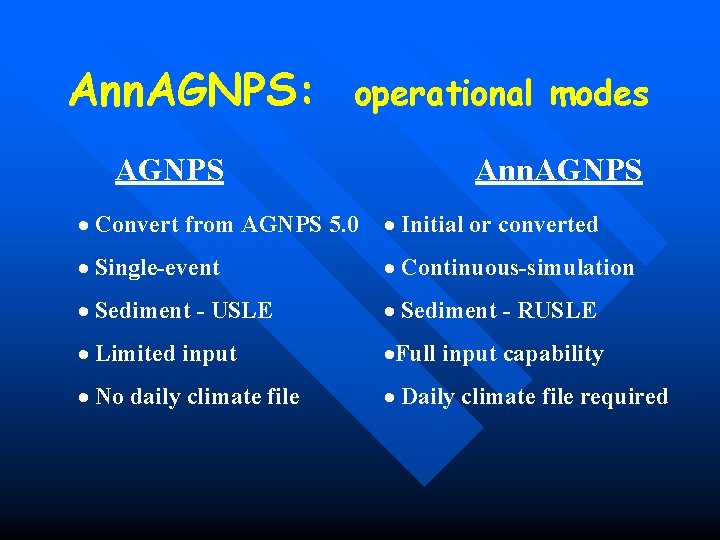
Ann. AGNPS: operational modes AGNPS Ann. AGNPS · Convert from AGNPS 5. 0 · Initial or converted · Single-event · Continuous-simulation · Sediment - USLE · Sediment - RUSLE · Limited input ·Full input capability · No daily climate file · Daily climate file required
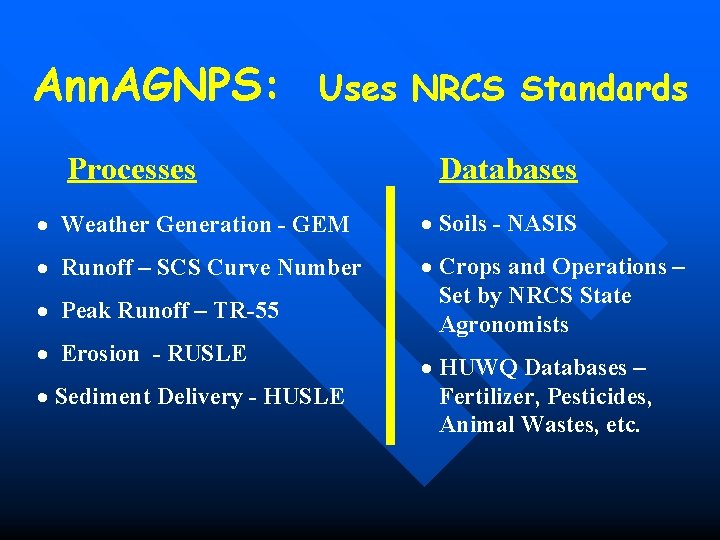
Ann. AGNPS: Uses NRCS Standards Processes Databases · Weather Generation - GEM · Soils - NASIS · Runoff – SCS Curve Number · Crops and Operations – Set by NRCS State Agronomists · Peak Runoff – TR-55 · Erosion - RUSLE · Sediment Delivery - HUSLE · HUWQ Databases – Fertilizer, Pesticides, Animal Wastes, etc.
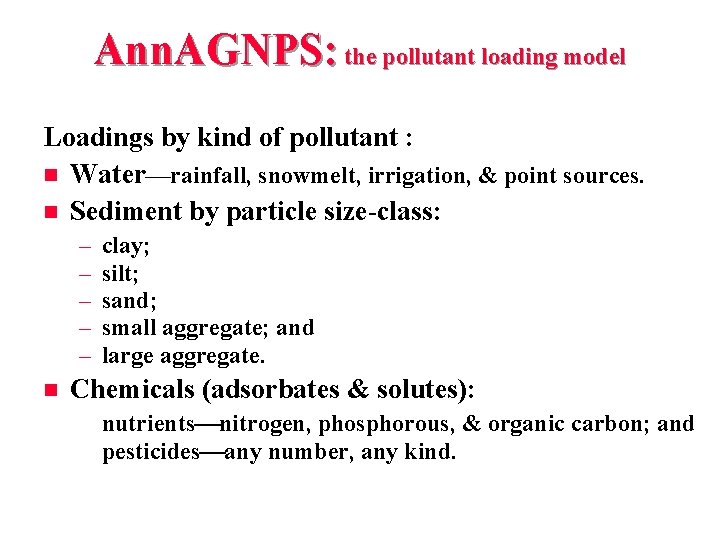
Ann. AGNPS: the pollutant loading model Loadings by kind of pollutant : n Water rainfall, snowmelt, irrigation, & point sources. n Sediment by particle size-class: – – – n clay; silt; sand; small aggregate; and large aggregate. Chemicals (adsorbates & solutes): – nutrients nitrogen, phosphorous, & organic carbon; and – pesticides any number, any kind.
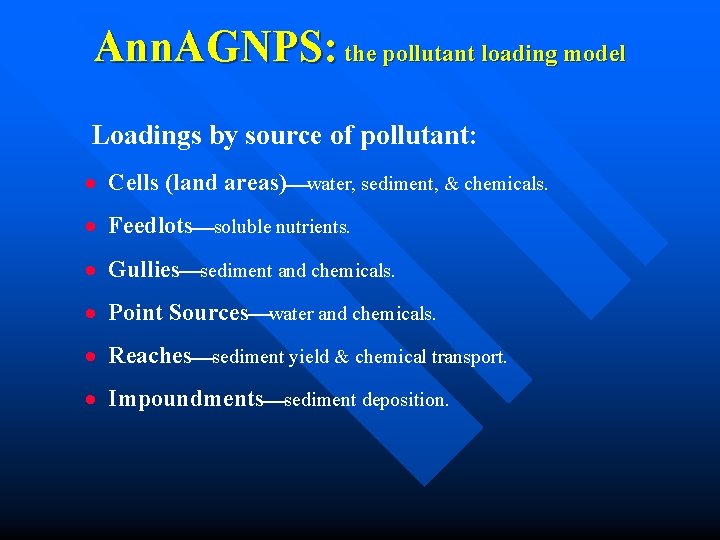
Ann. AGNPS: the pollutant loading model Loadings by source of pollutant: · Cells (land areas) water, sediment, & chemicals. · Feedlots soluble nutrients. · Gullies sediment and chemicals. · Point Sources water and chemicals. · Reaches sediment yield & chemical transport. · Impoundments sediment deposition.
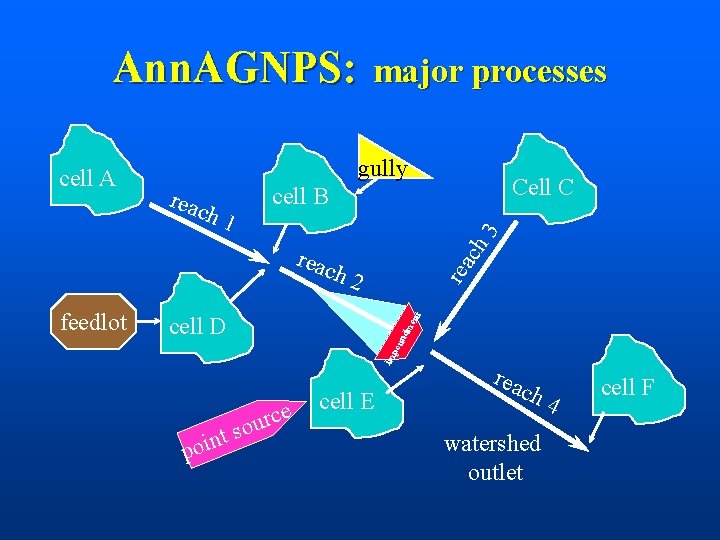
Ann. AGNPS: gully Cell C cell B reac 3 h 1 ch cell A major processes ou n dm en t cell D im p feedlot reac h 2 s t n i po o urce cell E rea ch watershed outlet 4 cell F
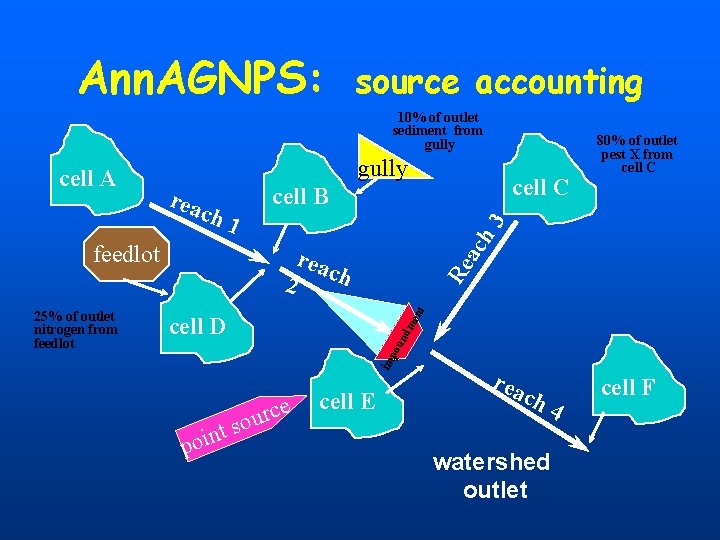
Ann. AGNPS: source accounting 10% of outlet sediment from gully feedlot rea ch t 2 ac h 3 h 1 po un dm en cell D im 25% of outlet nitrogen from feedlot cell C cell B rea c Re cell A 80% of outlet pest X from cell C s t n i po e c r u o cell E rea c h 4 watershed outlet cell F
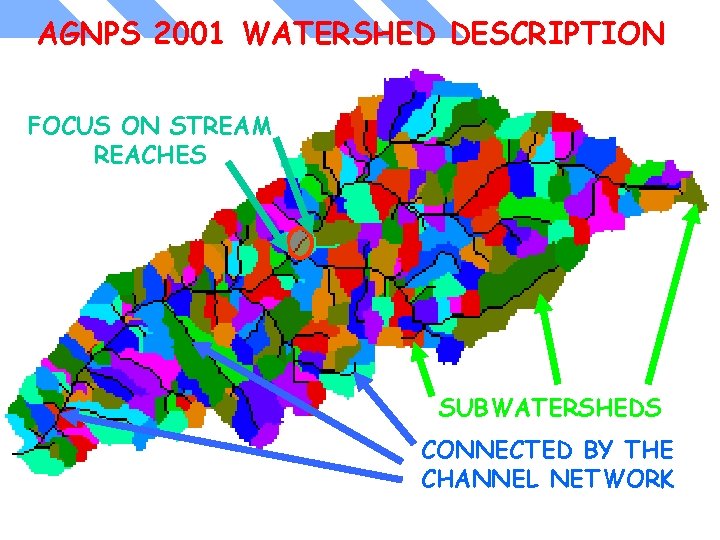
AGNPS 2001 WATERSHED DESCRIPTION FOCUS ON STREAM REACHES SUBWATERSHEDS CONNECTED BY THE CHANNEL NETWORK
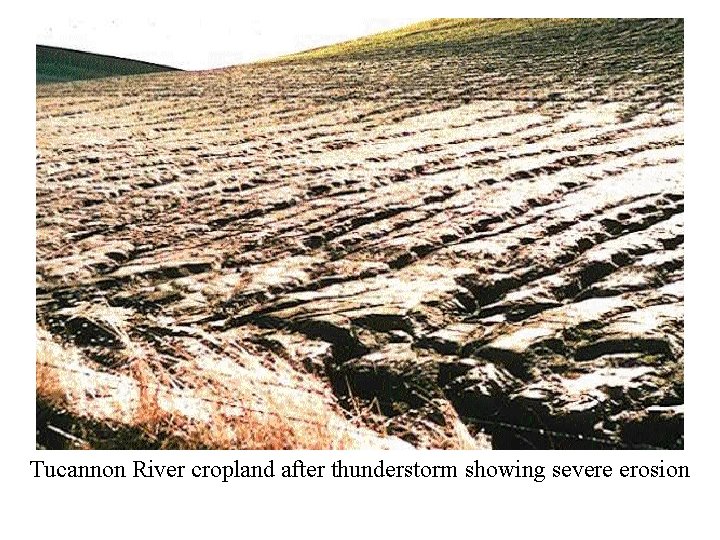
Tucannon River cropland after thunderstorm showing severe erosion
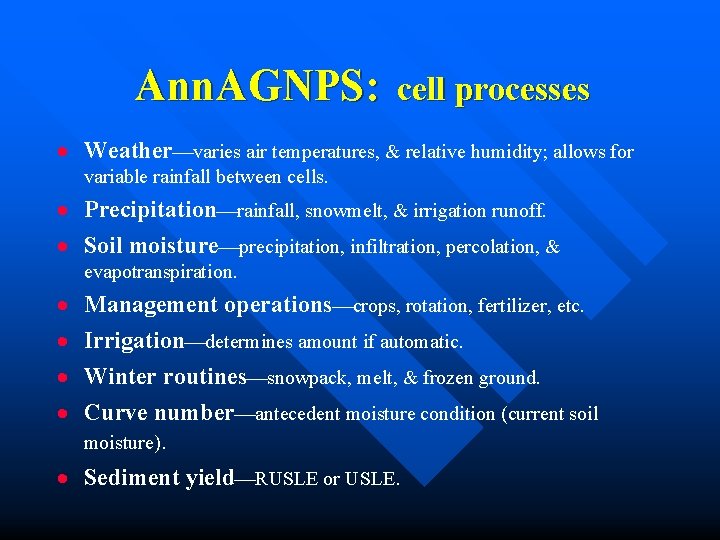
Ann. AGNPS: cell processes · Weather varies air temperatures, & relative humidity; allows for variable rainfall between cells. · Precipitation rainfall, snowmelt, & irrigation runoff. · Soil moisture precipitation, infiltration, percolation, & evapotranspiration. · · Management operations crops, rotation, fertilizer, etc. Irrigation determines amount if automatic. Winter routines snowpack, melt, & frozen ground. Curve number antecedent moisture condition (current soil moisture). · Sediment yield RUSLE or USLE.
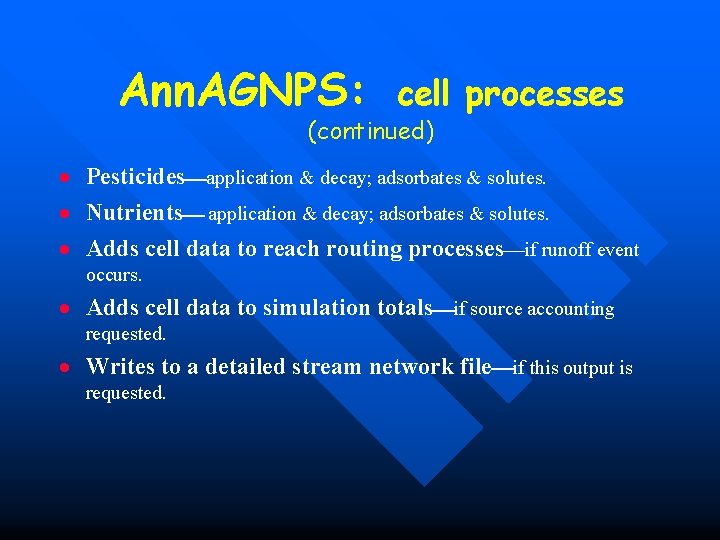
Ann. AGNPS: cell processes (continued) · Pesticides application & decay; adsorbates & solutes. · Nutrients application & decay; adsorbates & solutes. · Adds cell data to reach routing processes if runoff event occurs. · Adds cell data to simulation totals if source accounting requested. · Writes to a detailed stream network file if this output is requested.
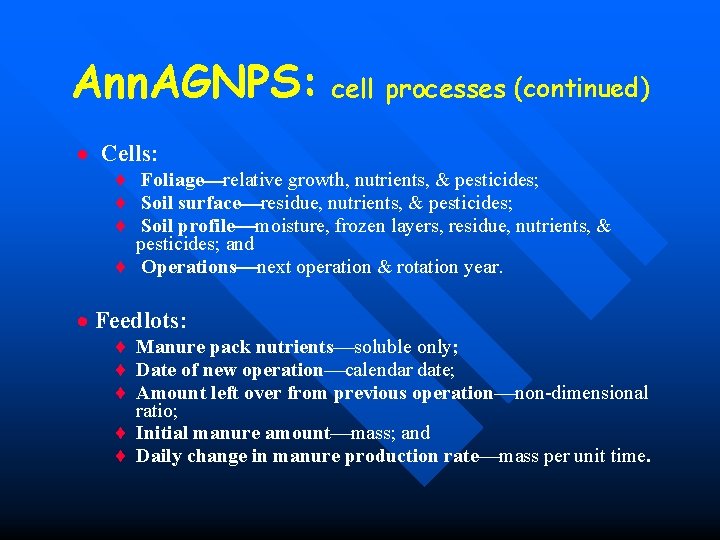
Ann. AGNPS: cell processes (continued) · Cells: ¨ Foliage relative growth, nutrients, & pesticides; ¨ Soil surface residue, nutrients, & pesticides; ¨ Soil profile moisture, frozen layers, residue, nutrients, & pesticides; and ¨ Operations next operation & rotation year. · Feedlots: ¨ Manure pack nutrients soluble only; ¨ Date of new operation calendar date; ¨ Amount left over from previous operation non-dimensional ratio; ¨ Initial manure amount mass; and ¨ Daily change in manure production rate mass per unit time.
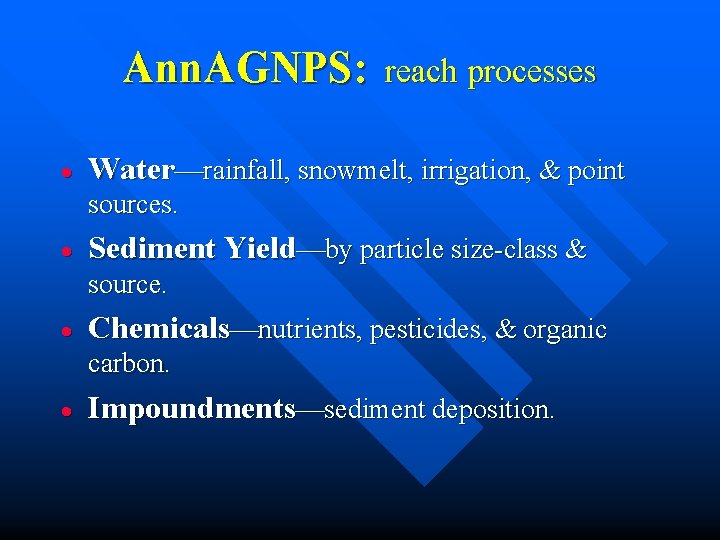
Ann. AGNPS: · reach processes Water rainfall, snowmelt, irrigation, & point sources. · Sediment Yield by particle size-class & source. · Chemicals nutrients, pesticides, & organic carbon. · Impoundments sediment deposition.
USDA-ARS-NSL - CONCEPTS CONSERVATIONAL CHANNEL EROSION POLLUTANT TRANSPORT SYSTEM
USDA-ARS-NSL - CONCEPTS Integrates the impact on instream water quality from upland channel processes to provide a comprehensive stream corridor evaluation tool.
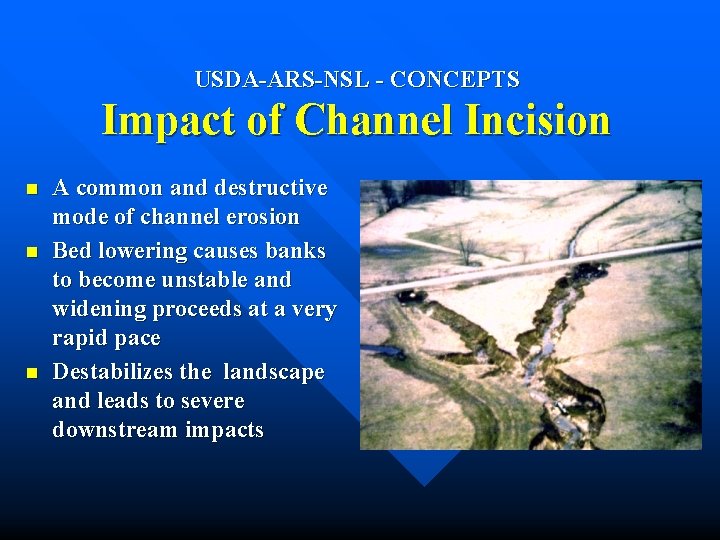
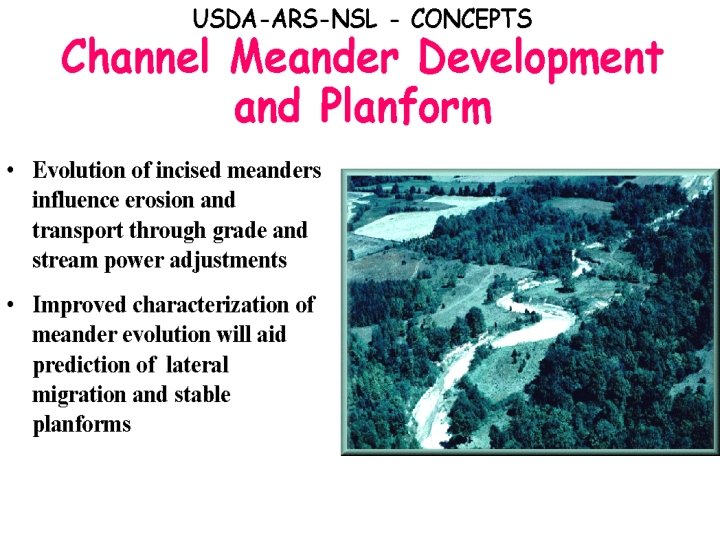
USDA-ARS-NSL - CONCEPTS Impact of Channel Incision n A common and destructive mode of channel erosion Bed lowering causes banks to become unstable and widening proceeds at a very rapid pace Destabilizes the landscape and leads to severe downstream impacts
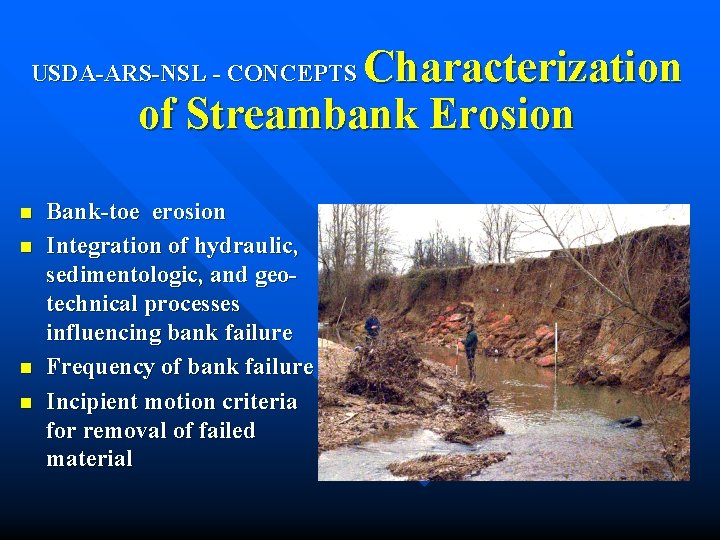
Characterization of Streambank Erosion USDA-ARS-NSL - CONCEPTS n n Bank-toe erosion Integration of hydraulic, sedimentologic, and geotechnical processes influencing bank failure Frequency of bank failure Incipient motion criteria for removal of failed material
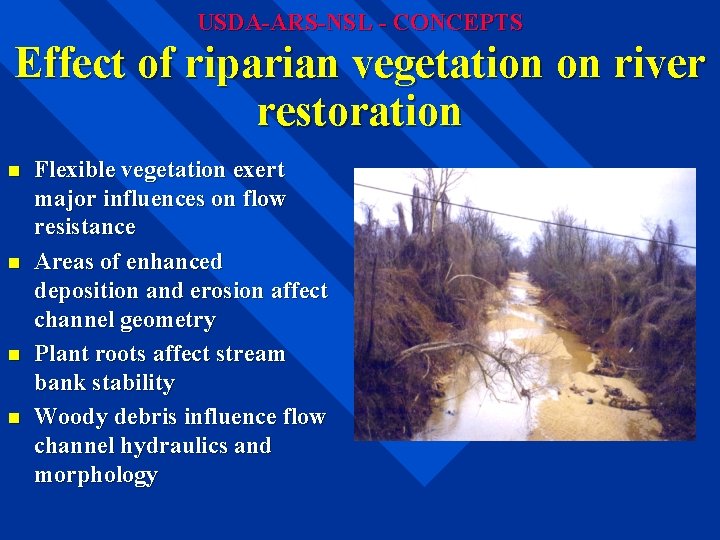
USDA-ARS-NSL - CONCEPTS Effect of riparian vegetation on river restoration n n Flexible vegetation exert major influences on flow resistance Areas of enhanced deposition and erosion affect channel geometry Plant roots affect stream bank stability Woody debris influence flow channel hydraulics and morphology
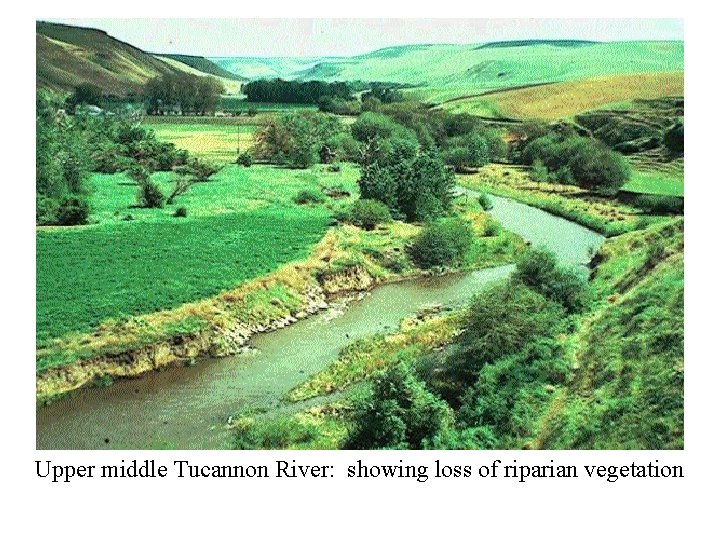
Upper middle Tucannon River: showing loss of riparian vegetation
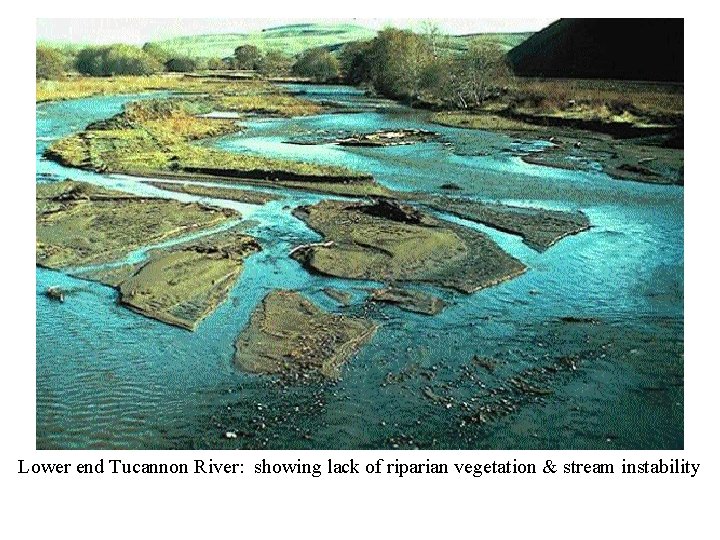
Lower end Tucannon River: showing lack of riparian vegetation & stream instability
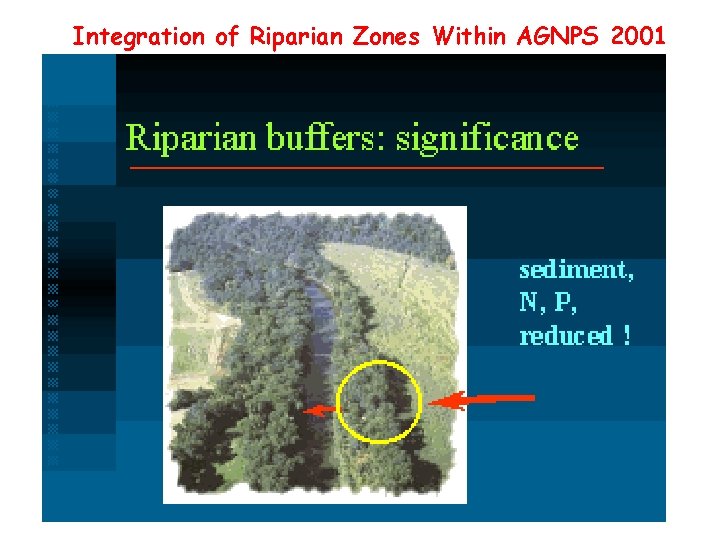
Integration of Riparian Zones Within AGNPS 2001
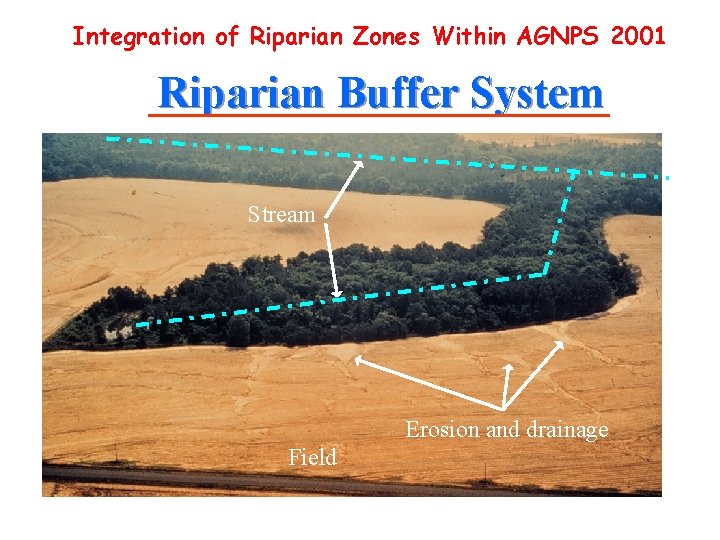
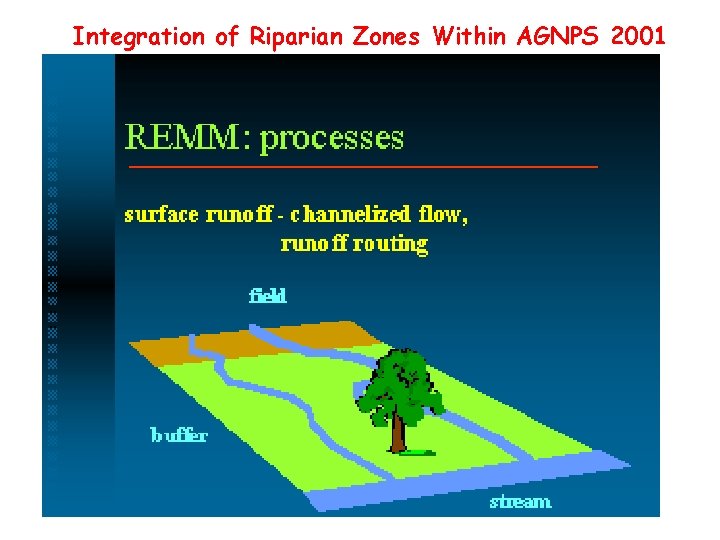
Integration of Riparian Zones Within AGNPS 2001 Riparian Buffer System Stream Erosion and drainage Field
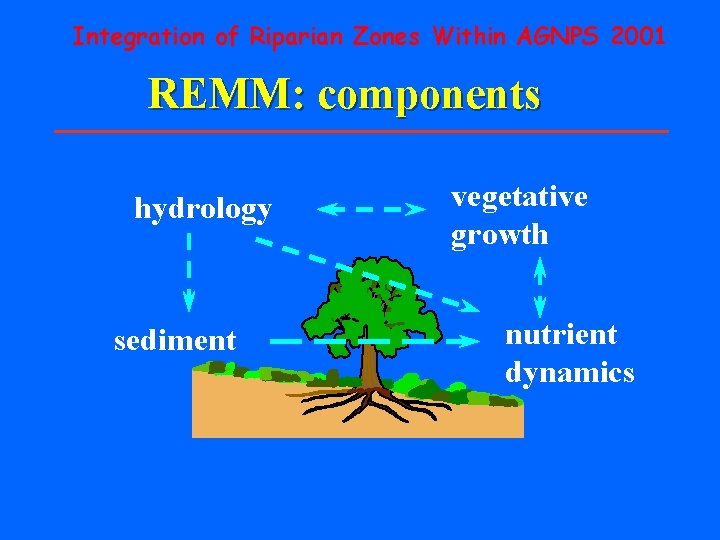
Integration of Riparian Zones Within AGNPS 2001 REMM: components hydrology sediment vegetative growth nutrient dynamics
Integration of Riparian Zones Within AGNPS 2001
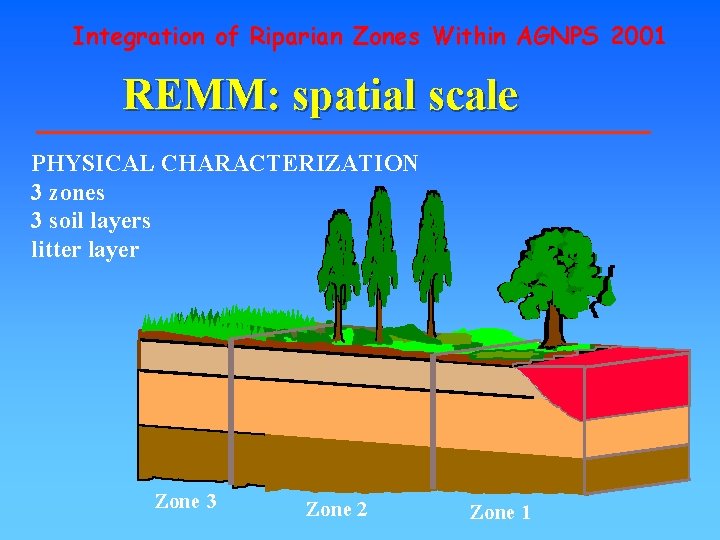
Integration of Riparian Zones Within AGNPS 2001 REMM: spatial scale PHYSICAL CHARACTERIZATION 3 zones 3 soil layers litter layer Zone 3 Zone 2 Zone 1
Integration of Riparian Zones Within AGNPS 2001
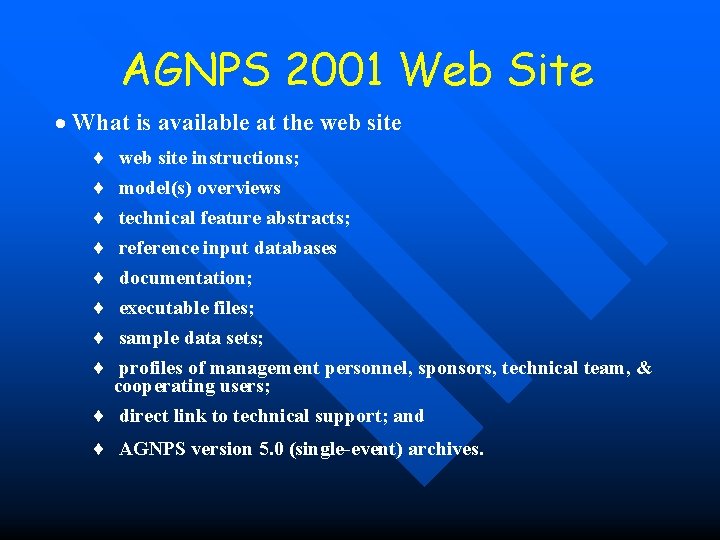
AGNPS 2001 Web Site · What is available at the web site ¨ ¨ ¨ ¨ web site instructions; model(s) overviews technical feature abstracts; reference input databases documentation; executable files; sample data sets; profiles of management personnel, sponsors, technical team, & cooperating users; ¨ direct link to technical support; and ¨ AGNPS version 5. 0 (single-event) archives.
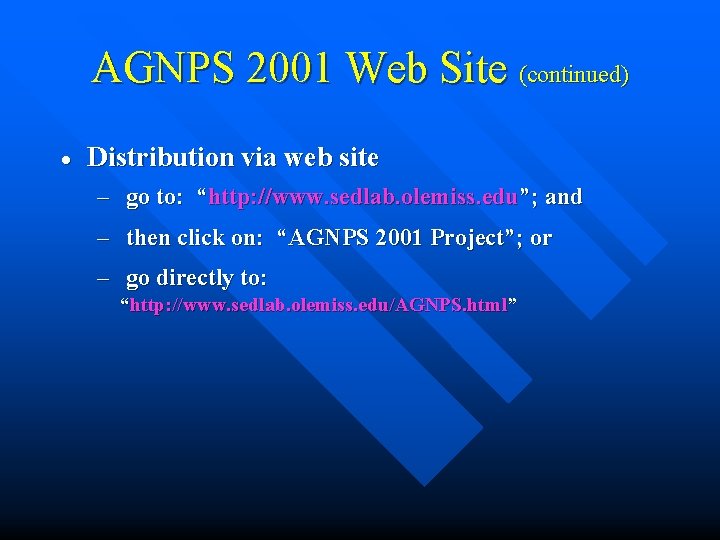
AGNPS 2001 Web Site (continued) · Distribution via web site – go to: “http: //www. sedlab. olemiss. edu”; and – then click on: “AGNPS 2001 Project”; or – go directly to: “http: //www. sedlab. olemiss. edu/AGNPS. html”
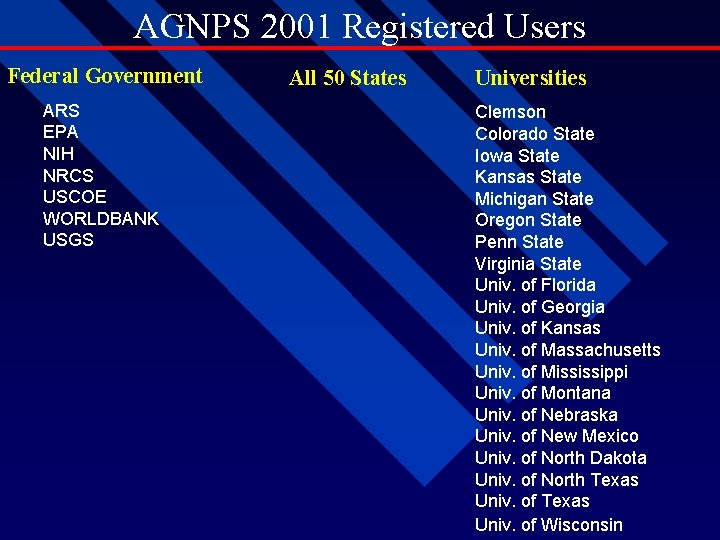
AGNPS 2001 Registered Users Federal Government ARS EPA NIH NRCS USCOE WORLDBANK USGS All 50 States Universities Clemson Colorado State Iowa State Kansas State Michigan State Oregon State Penn State Virginia State Univ. of Florida Univ. of Georgia Univ. of Kansas Univ. of Massachusetts Univ. of Mississippi Univ. of Montana Univ. of Nebraska Univ. of New Mexico Univ. of North Dakota Univ. of North Texas Univ. of Wisconsin
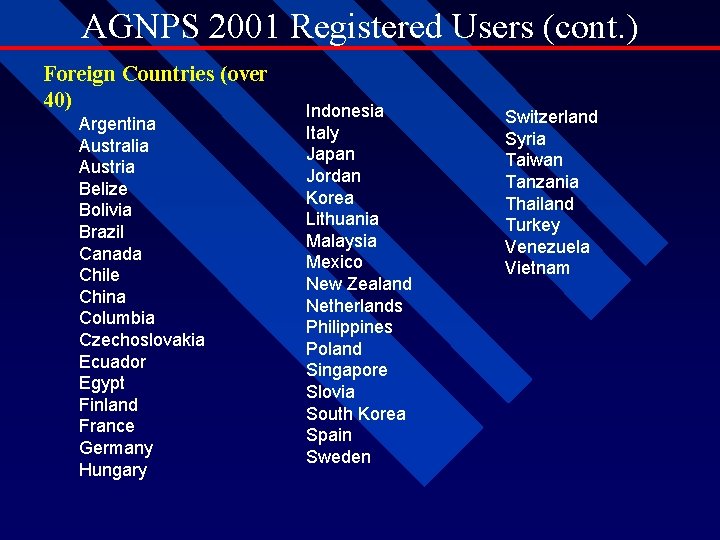
AGNPS 2001 Registered Users (cont. ) Foreign Countries (over 40) Argentina Australia Austria Belize Bolivia Brazil Canada Chile China Columbia Czechoslovakia Ecuador Egypt Finland France Germany Hungary Indonesia Italy Japan Jordan Korea Lithuania Malaysia Mexico New Zealand Netherlands Philippines Poland Singapore Slovia South Korea Spain Sweden Switzerland Syria Taiwan Tanzania Thailand Turkey Venezuela Vietnam
AGNPS 2001 Interface Components èWhat the User sees. è Tools to automatically determine model parameters. è Tools to modify and add parameters. èTools to visualize the watershed.
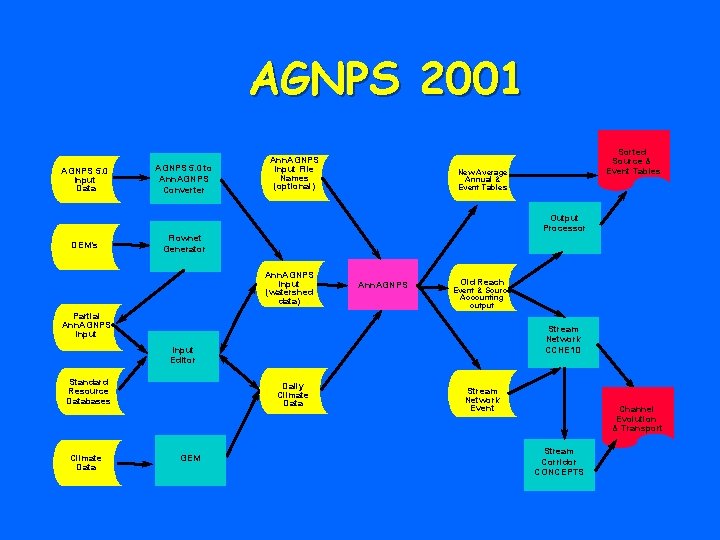
AGNPS 2001 AGNPS 5. 0 Input Data DEM’s AGNPS 5. 0 to Ann. AGNPS Converter Ann. AGNPS Input File Names (optional) New Average Annual & Event Tables Output Processor Flownet Generator Ann. AGNPS Input (watershed data) Ann. AGNPS Old Reach Event & Source Accounting output Partial Ann. AGNPS Input Stream Network CCHE 1 D Input Editor Standard Resource Databases Climate Data Daily Climate Data GEM Sorted Source & Event Tables Stream Network Event Channel Evolution & Transport Stream Corridor CONCEPTS
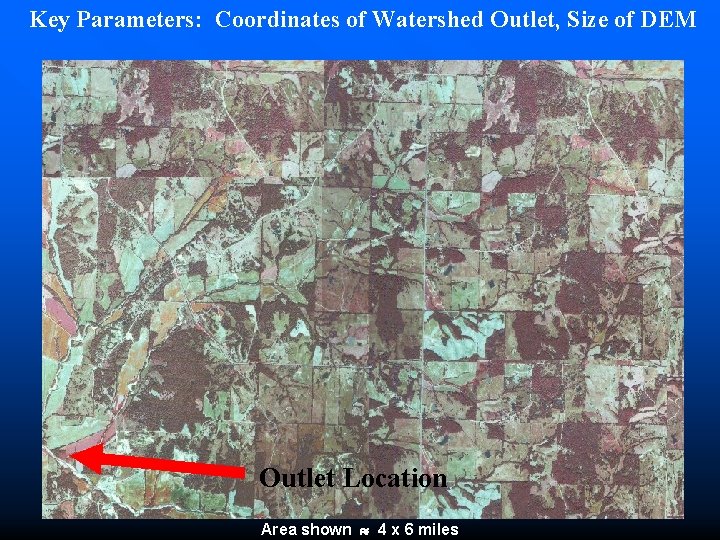
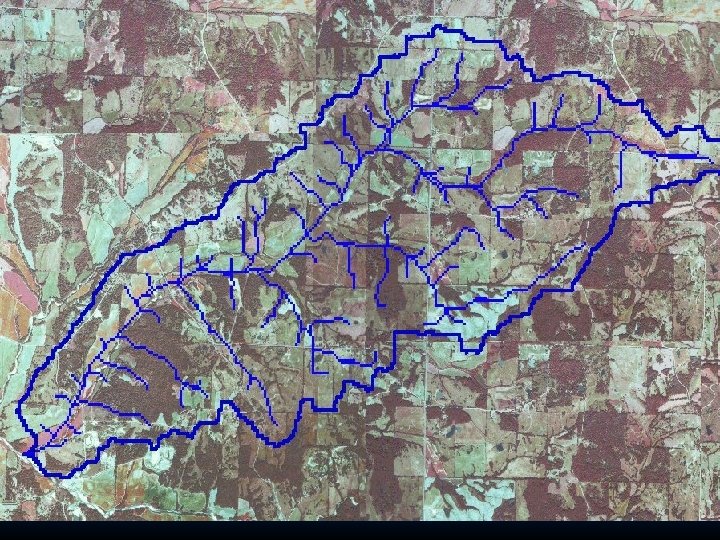
Key Parameters: Coordinates of Watershed Outlet, Size of DEM Outlet Location Area shown 4 x 6 miles
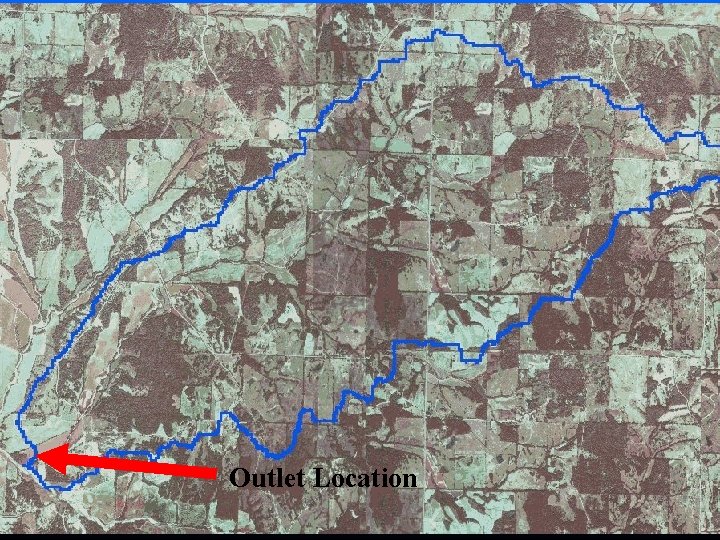
Outlet Location
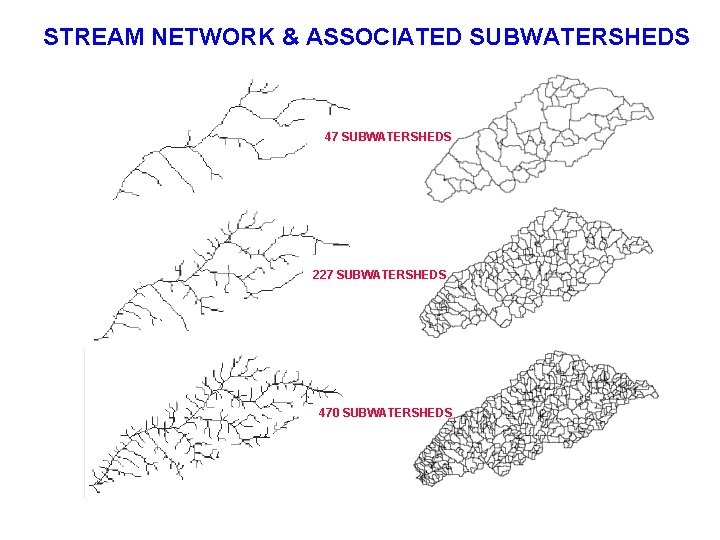
STREAM NETWORK & ASSOCIATED SUBWATERSHEDS 47 SUBWATERSHEDS 227 SUBWATERSHEDS 470 SUBWATERSHEDS
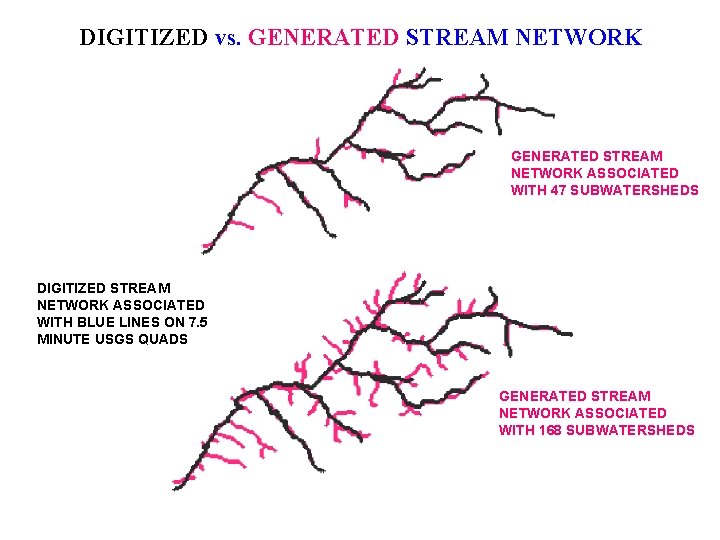
DIGITIZED vs. GENERATED STREAM NETWORK ASSOCIATED WITH 47 SUBWATERSHEDS DIGITIZED STREAM NETWORK ASSOCIATED WITH BLUE LINES ON 7. 5 MINUTE USGS QUADS GENERATED STREAM NETWORK ASSOCIATED WITH 168 SUBWATERSHEDS
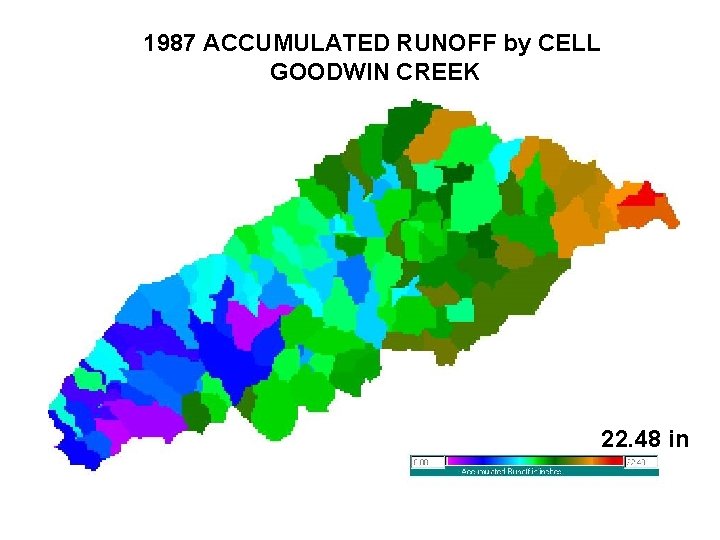
1987 ACCUMULATED RUNOFF by CELL GOODWIN CREEK 0 22. 48 in
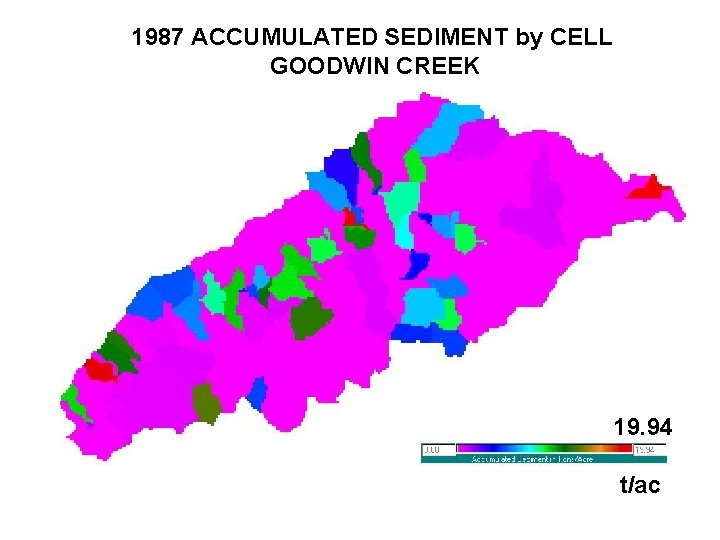
1987 ACCUMULATED SEDIMENT by CELL GOODWIN CREEK 19. 94 t/ac
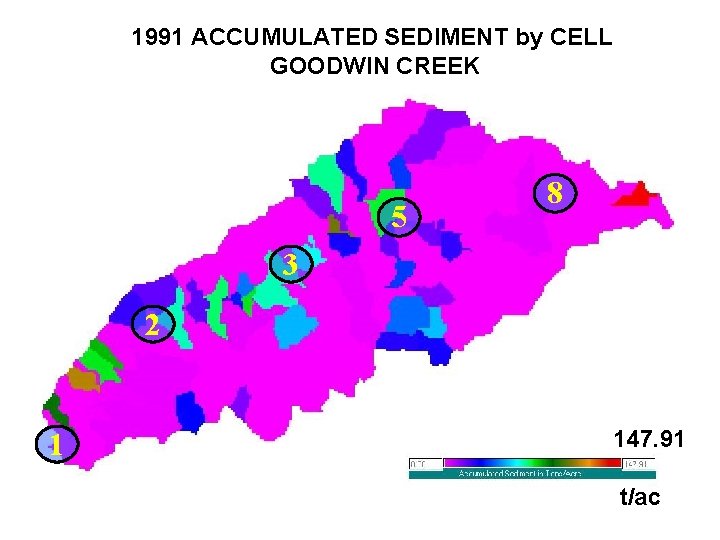
1991 ACCUMULATED SEDIMENT by CELL GOODWIN CREEK 5 8 3 2 1 147. 91 t/ac
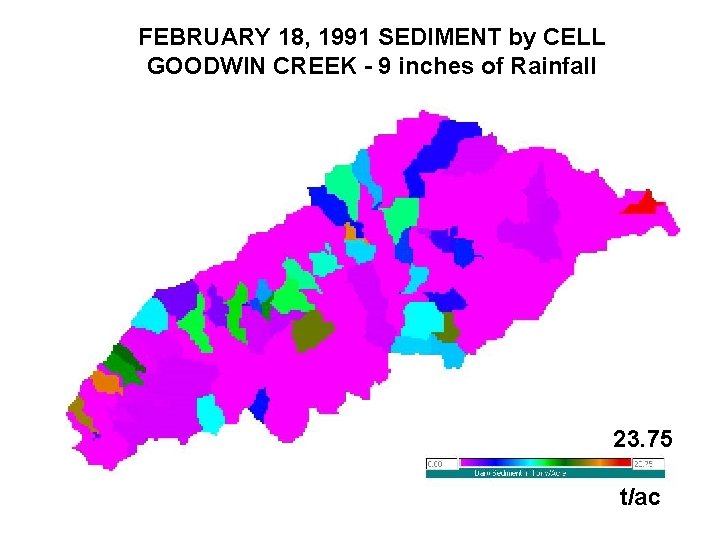
FEBRUARY 18, 1991 SEDIMENT by CELL GOODWIN CREEK - 9 inches of Rainfall 23. 75 t/ac
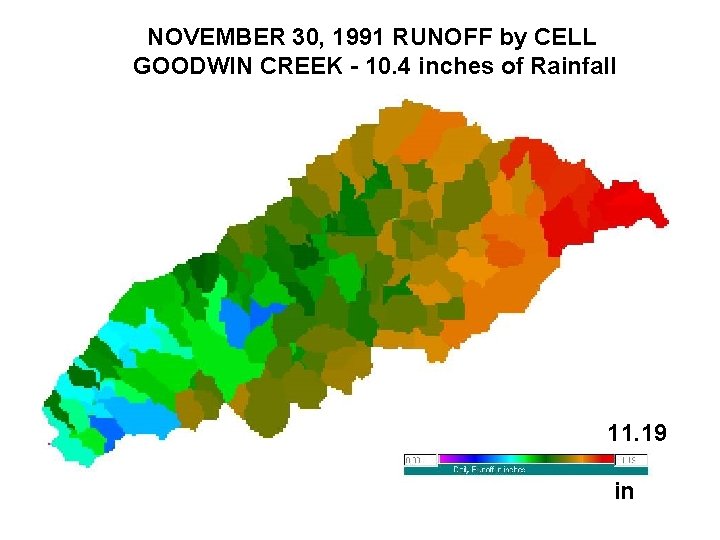
NOVEMBER 30, 1991 RUNOFF by CELL GOODWIN CREEK - 10. 4 inches of Rainfall 11. 19 in
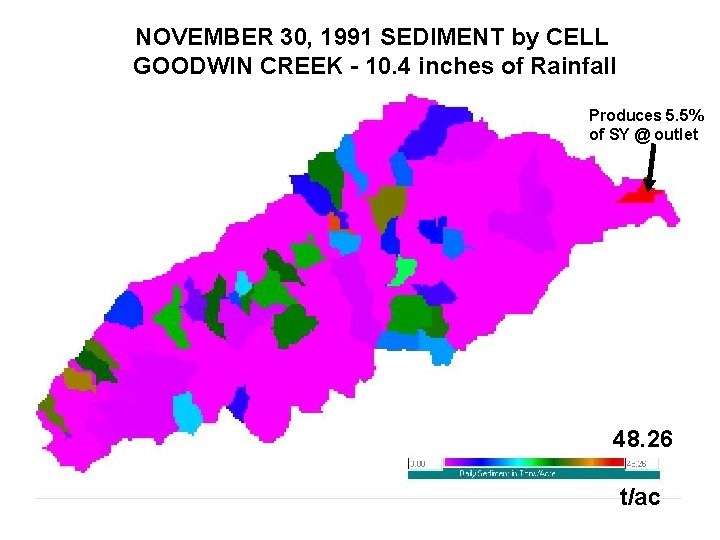
NOVEMBER 30, 1991 SEDIMENT by CELL GOODWIN CREEK - 10. 4 inches of Rainfall Produces 5. 5% of SY @ outlet 48. 26 t/ac