Figure 8 1 Percentage of haemodialysis patients with


- Slides: 24

Figure 8. 1. Percentage of haemodialysis patients with phosphate within the range specified by the RA clinical audit measure (1. 1– 1. 7 mmol/L) by centre in 2013 UK Renal Registry 17 th Annual Report

Figure 8. 2. Funnel plot of percentage of haemodialysis patients with phosphate within the range specified by the RA clinical audit measure (1. 1– 1. 7 mmol/L) by centre in 2013 UK Renal Registry 17 th Annual Report

Figure 8. 3. Percentage of peritoneal dialysis patients with phosphate within the range specified by the RA clinical audit measure (1. 1– 1. 7 mmol/L) by centre in 2013 UK Renal Registry 17 th Annual Report

Figure 8. 4. Funnel plot of percentage of peritoneal dialysis patients with phosphate within the range specified by the RA clinical audit measure (1. 1– 1. 7 mmol/L) by centre in 2013 UK Renal Registry 17 th Annual Report

Figure 8. 5. Longitudinal change in percentage of patients with phosphate below, within and above the 2010 RA standard by dialysis modality 2003– 2013 UK Renal Registry 17 th Annual Report

Figure 8. 6. Percentage of haemodialysis patients with adjusted calcium within range (2. 2– 2. 5 mmol/L) by centre in 2013 UK Renal Registry 17 th Annual Report

Figure 8. 7. Funnel plot of percentage of haemodialysis patients with adjusted calcium within range (2. 2– 2. 5 mmol/L) by centre in 2013 UK Renal Registry 17 th Annual Report

Figure 8. 8. Percentage of peritoneal dialysis patients with adjusted calcium within range (2. 2– 2. 5 mmol/L) by centre in 2013 UK Renal Registry 17 th Annual Report

Figure 8. 9. Funnel plot of percentage of peritoneal dialysis patients with adjusted calcium within range (2. 2– 2. 5 mmol/L) by centre in 2013 UK Renal Registry 17 th Annual Report

Figure 8. 10. Longitudinal change in percentage of patients with adjusted calcium <2. 2 mmol/L, 2. 2– 2. 5 mmol/L and >2. 5 mmol/L by dialysis modality 2003– 2013 UK Renal Registry 17 th Annual Report

Figure 8. 11. Percentage of haemodialysis patients with PTH within range (16– 72 pmol/L) by centre in 2013 UK Renal Registry 17 th Annual Report

Figure 8. 12. Funnel plot of percentage of haemodialysis patients with PTH within range (16– 72 pmol/L) by centre in 2013 UK Renal Registry 17 th Annual Report

Figure 8. 13. Percentage of peritoneal dialysis patients with PTH within range (16– 72 pmol/L) by centre in 2013 UK Renal Registry 17 th Annual Report

Figure 8. 14. Funnel plot of percentage of peritoneal dialysis patients with PTH within range (16– 72 pmol/L) by centre in 2013 UK Renal Registry 17 th Annual Report

Figure 8. 15. Longitudinal change in percentage of patients with PTH within range (16– 72 pmol/L) by dialysis modality 2003– 2013 UK Renal Registry 17 th Annual Report

Figure 8. 16. Percentage of HD patients achieving simultaneous control of all three BMD parameters in preventing severe hyperparathyroidism by centre in 2013 UK Renal Registry 17 th Annual Report

Figure 8. 17. Percentage of PD patients achieving simultaneous control of all three BMD parameters in preventing severe hyperparathyroidism by centre in 2013 UK Renal Registry 17 th Annual Report

Figure 8. 18. Funnel plot for percentage of HD patients achieving simultaneous control of all three BMD parameters in preventing severe hyperparathyroidism by centre in 2013 UK Renal Registry 17 th Annual Report

Figure 8. 19. Funnel plot for percentage of PD patients achieving simultaneous control of all three BMD parameters in preventing severe hyperparathyroidism by centre in 2013 UK Renal Registry 17 th Annual Report

Figure 8. 20. Percentage of haemodialysis patients with serum bicarbonate within range (18– 24 mmol/L) by centre in 2013 UK Renal Registry 17 th Annual Report

Figure 8. 21. Funnel plot for percentage of haemodialysis patients within the range for bicarbonate (18– 24 mmol/L) by centre in 2013 UK Renal Registry 17 th Annual Report

Figure 8. 22. Percentage of peritoneal dialysis patients with serum bicarbonate within range (22– 30 mmol/L) by centre in 2013 UK Renal Registry 17 th Annual Report

Figure 8. 23. Funnel plot for percentage of peritoneal dialysis patients within the range for bicarbonate (22 – 30 mmol/L) by centre in 2013 UK Renal Registry 17 th Annual Report

Figure 8. 24. Longitudinal change in percentage of patients within the range for bicarbonate (18– 24 mmol/L for HD and 22– 30 mmol/L for PD) by dialysis modality 2003– 2013 UK Renal Registry 17 th Annual Report
 Dialysis machine parts and functions
 Washing machine solid or plane figure
 An operation that maps an original geometric figure
 6 figure reference
 Understand rigid transformations
 Module 70 introduction to therapy
 Guideline clinical nutrition in patients with stroke
 Prevention of vte in nonorthopedic surgical patients
 Perimylolysis
 How does nurse ratched manipulate the patients
 Ems lifting and moving patients
 Circumcised vs uncircumcised cartoon
 Rocking chair therapy for dementia patients
 Postoperative nursing care for cataract surgery
 Leadership rounding questions
 Lippincott williams
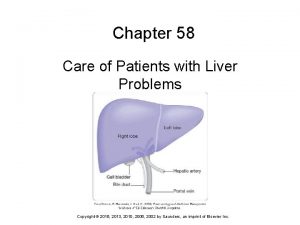
 Chapter 58 care of patients with liver problems
 Tena shampoo caps
 Diet chart for diabetic
 When performing the rapid extrication technique
 The factors of care that patient can expect
 Nursing care of male patients with genitourinary disorders
 Sop for admission and discharge in hospital
 Nursing interventions for stroke patients
 Diet chart for icu patients


