Evaluation Metrics CS 229 Anand Avati Topics Why

- Slides: 31
Evaluation Metrics CS 229 Anand Avati
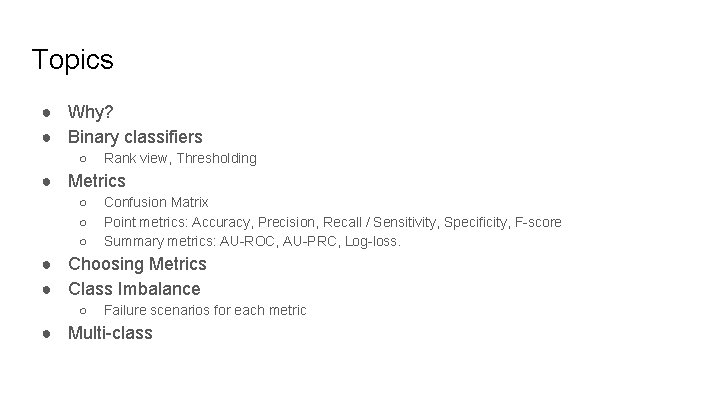
Topics ● Why? ● Binary classifiers ○ Rank view, Thresholding ● Metrics ○ ○ ○ Confusion Matrix Point metrics: Accuracy, Precision, Recall / Sensitivity, Specificity, F-score Summary metrics: AU-ROC, AU-PRC, Log-loss. ● Choosing Metrics ● Class Imbalance ○ Failure scenarios for each metric ● Multi-class
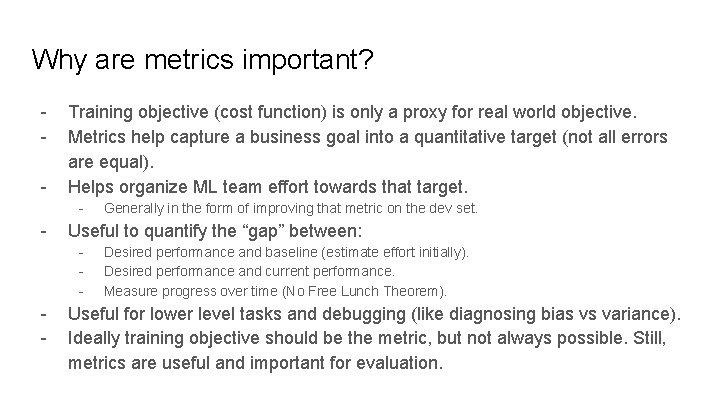
Why are metrics important? - Training objective (cost function) is only a proxy for real world objective. Metrics help capture a business goal into a quantitative target (not all errors are equal). Helps organize ML team effort towards that target. - - Useful to quantify the “gap” between: - - Generally in the form of improving that metric on the dev set. Desired performance and baseline (estimate effort initially). Desired performance and current performance. Measure progress over time (No Free Lunch Theorem). Useful for lower level tasks and debugging (like diagnosing bias vs variance). Ideally training objective should be the metric, but not always possible. Still, metrics are useful and important for evaluation.
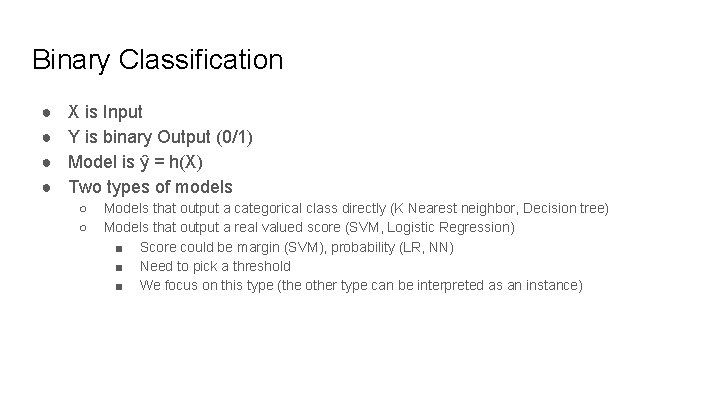
Binary Classification ● ● X is Input Y is binary Output (0/1) Model is ŷ = h(X) Two types of models ○ ○ Models that output a categorical class directly (K Nearest neighbor, Decision tree) Models that output a real valued score (SVM, Logistic Regression) ■ Score could be margin (SVM), probability (LR, NN) ■ Need to pick a threshold ■ We focus on this type (the other type can be interpreted as an instance)
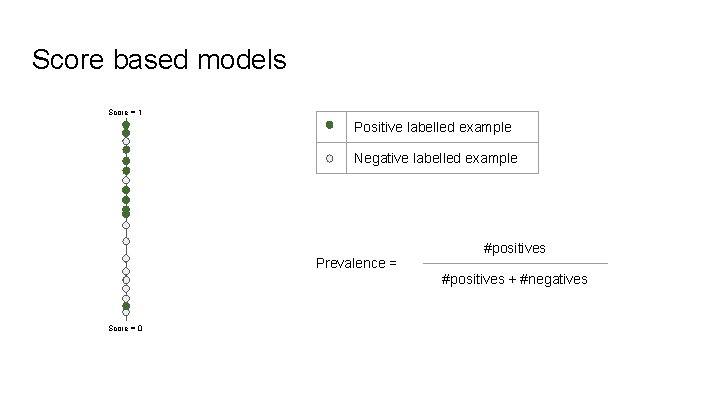
Score based models Score = 1 Positive labelled example Negative labelled example Prevalence = #positives + #negatives Score = 0
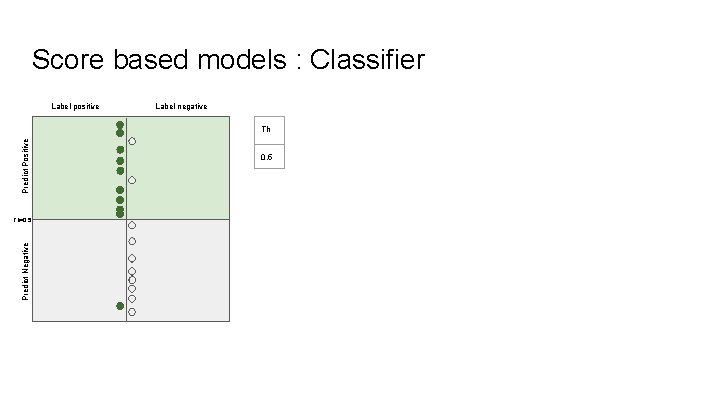
Score based models : Classifier Label positive Label negative Predict Positive Th Predict Negative Th=0. 5
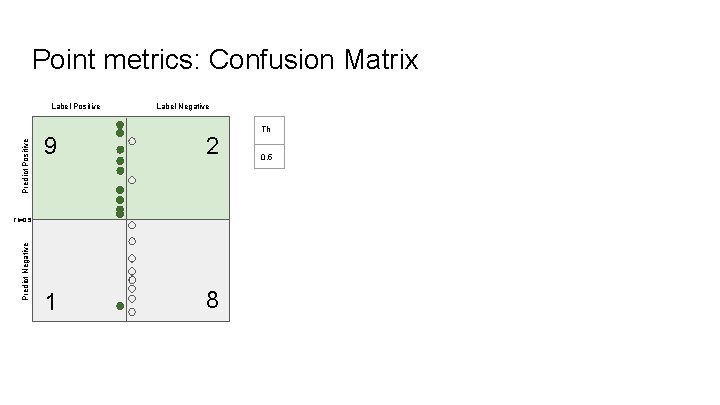
Point metrics: Confusion Matrix Predict Positive Label Negative 9 2 1 8 Predict Negative Th=0. 5 Th 0. 5
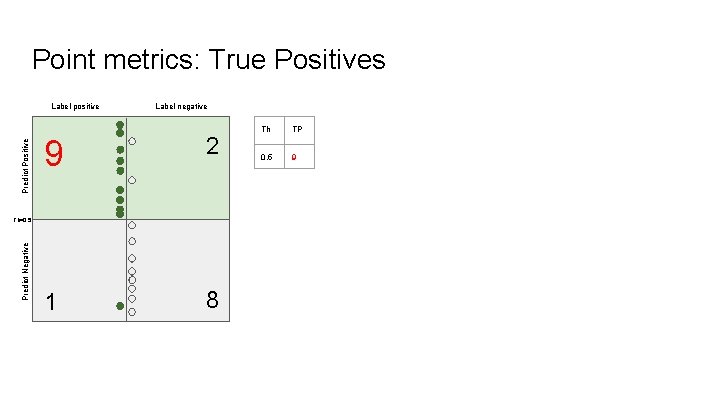
Point metrics: True Positives Predict Positive Label positive Label negative 9 2 1 8 Predict Negative Th=0. 5 Th TP 0. 5 9
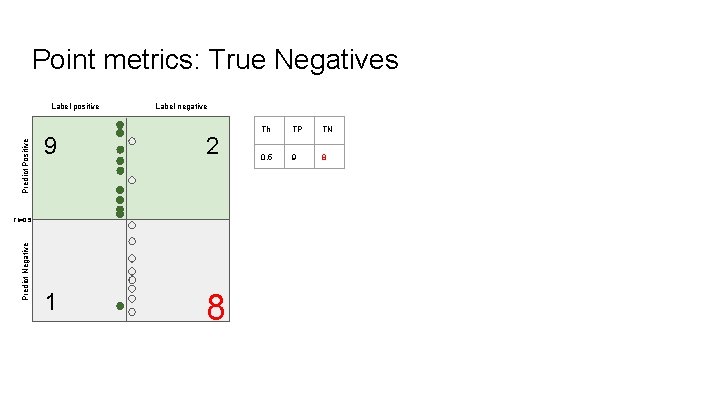
Point metrics: True Negatives Predict Positive Label positive Label negative 9 2 1 8 Predict Negative Th=0. 5 Th TP TN 0. 5 9 8
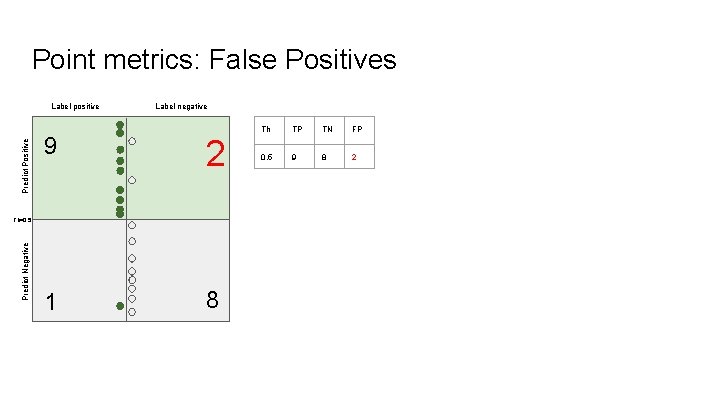
Point metrics: False Positives Predict Positive Label positive Label negative 9 2 1 8 Predict Negative Th=0. 5 Th TP TN FP 0. 5 9 8 2
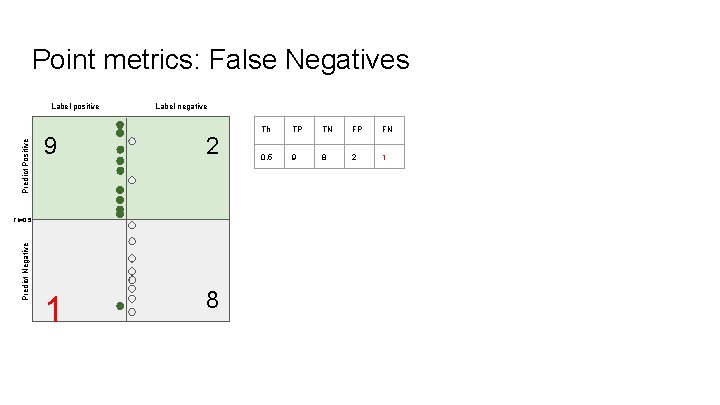
Point metrics: False Negatives Predict Positive Label positive Label negative 9 2 1 8 Predict Negative Th=0. 5 Th TP TN FP FN 0. 5 9 8 2 1
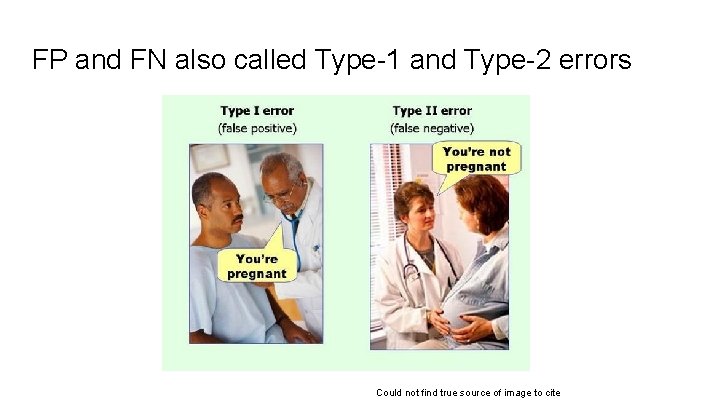
FP and FN also called Type-1 and Type-2 errors Could not find true source of image to cite
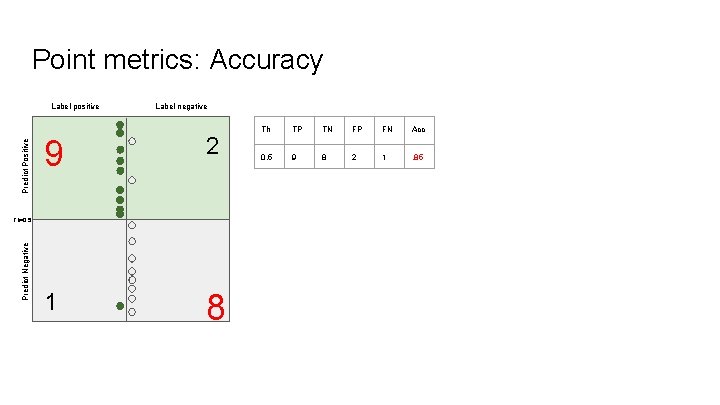
Point metrics: Accuracy Predict Positive Label positive Label negative 9 2 1 8 Predict Negative Th=0. 5 Th TP TN FP FN Acc 0. 5 9 8 2 1 . 85
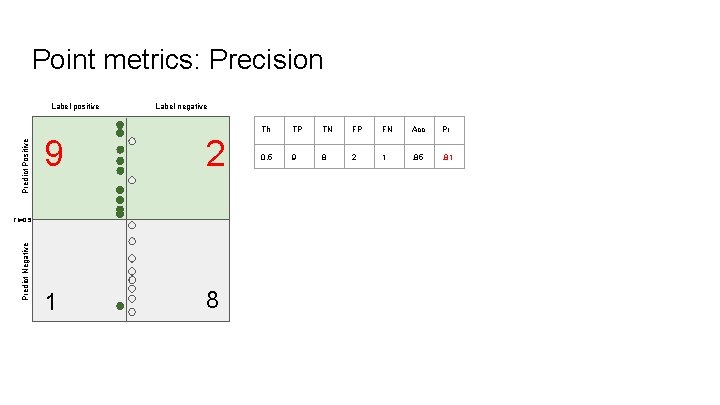
Point metrics: Precision Predict Positive Label positive Label negative 9 2 1 8 Predict Negative Th=0. 5 Th TP TN FP FN Acc Pr 0. 5 9 8 2 1 . 85 . 81
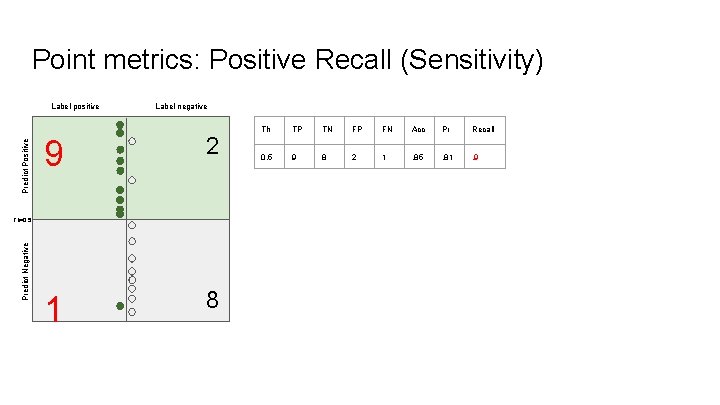
Point metrics: Positive Recall (Sensitivity) Predict Positive Label positive Label negative 9 2 1 8 Predict Negative Th=0. 5 Th TP TN FP FN Acc Pr Recall 0. 5 9 8 2 1 . 85 . 81 . 9
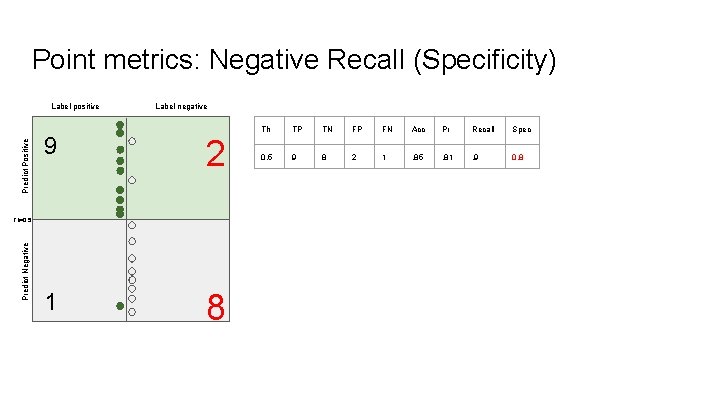
Point metrics: Negative Recall (Specificity) Predict Positive Label positive Label negative 9 2 1 8 Predict Negative Th=0. 5 Th TP TN FP FN Acc Pr Recall Spec 0. 5 9 8 2 1 . 85 . 81 . 9 0. 8
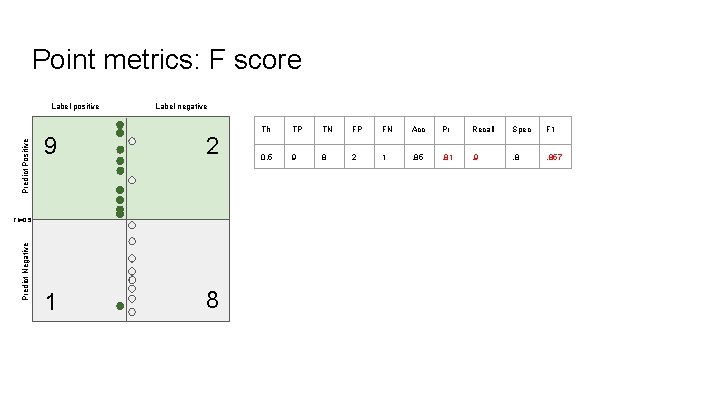
Point metrics: F score Predict Positive Label positive Label negative 9 2 1 8 Predict Negative Th=0. 5 Th TP TN FP FN Acc Pr Recall Spec F 1 0. 5 9 8 2 1 . 85 . 81 . 9 . 857
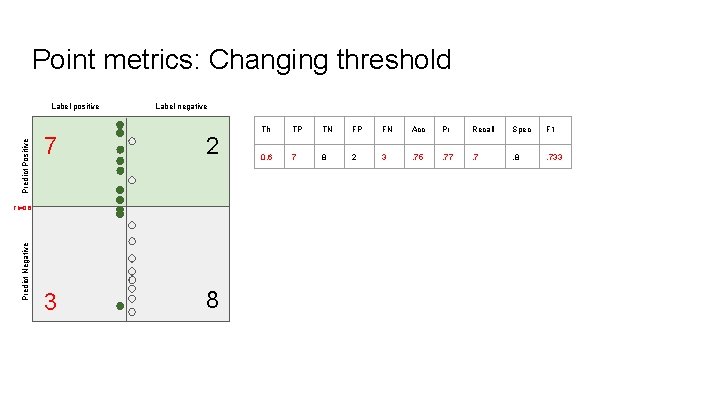
Point metrics: Changing threshold Predict Positive Label positive Label negative 7 2 3 8 Predict Negative Th=0. 6 Th TP TN FP FN Acc Pr Recall Spec F 1 0. 6 7 8 2 3 . 75 . 77 . 8 . 733
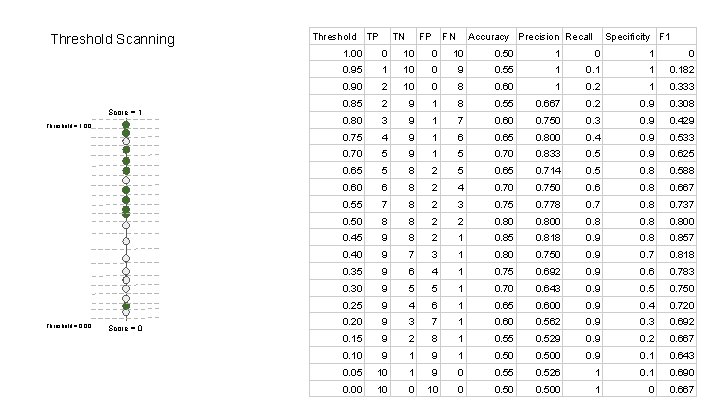
Threshold Scanning Score = 1 Threshold = 1. 00 Threshold = 0. 00 Score = 0 Threshold TP TN FP FN Accuracy Precision Recall Specificity F 1 1. 00 0 10 0. 50 1 0 0. 95 1 10 0 9 0. 55 1 0. 182 0. 90 2 10 0 8 0. 60 1 0. 2 1 0. 333 0. 85 2 9 1 8 0. 55 0. 667 0. 2 0. 9 0. 308 0. 80 3 9 1 7 0. 60 0. 750 0. 3 0. 9 0. 429 0. 75 4 9 1 6 0. 65 0. 800 0. 4 0. 9 0. 533 0. 70 5 9 1 5 0. 70 0. 833 0. 5 0. 9 0. 625 0. 65 5 8 2 5 0. 65 0. 714 0. 5 0. 8 0. 588 0. 60 6 8 2 4 0. 70 0. 750 0. 6 0. 8 0. 667 0. 55 7 8 2 3 0. 75 0. 778 0. 7 0. 8 0. 737 0. 50 8 8 2 2 0. 800 0. 45 9 8 2 1 0. 85 0. 818 0. 9 0. 857 0. 40 9 7 3 1 0. 80 0. 750 0. 9 0. 7 0. 818 0. 35 9 6 4 1 0. 75 0. 692 0. 9 0. 6 0. 783 0. 30 9 5 5 1 0. 70 0. 643 0. 9 0. 5 0. 750 0. 25 9 4 6 1 0. 65 0. 600 0. 9 0. 4 0. 720 0. 20 9 3 7 1 0. 60 0. 562 0. 9 0. 3 0. 692 0. 15 9 2 8 1 0. 55 0. 529 0. 2 0. 667 0. 10 9 1 0. 500 0. 9 0. 1 0. 643 0. 05 10 1 9 0 0. 55 0. 526 1 0. 690 0. 00 10 0 0. 500 1 0 0. 667
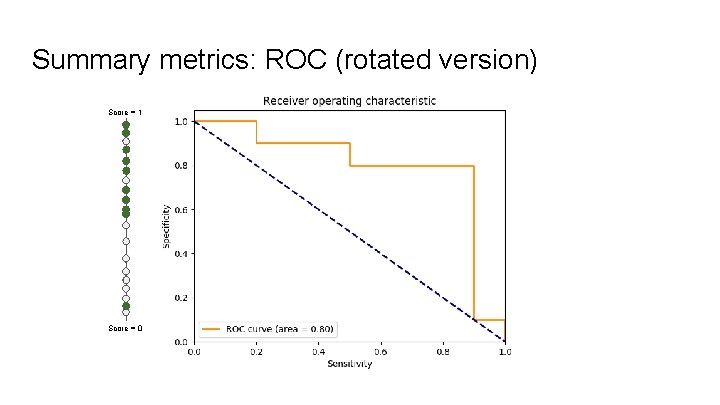
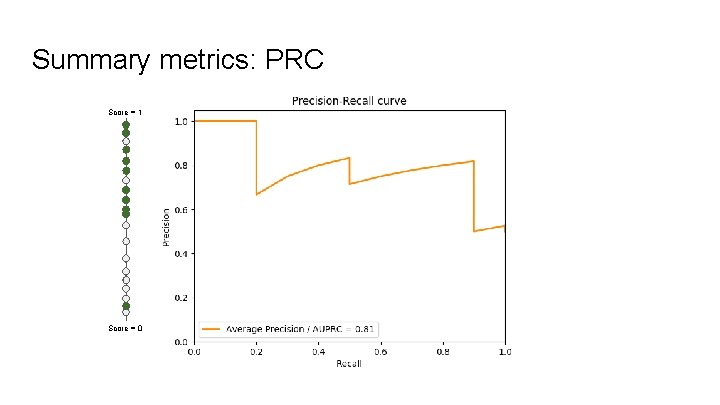
How to summarize the trade-off? {Precision, Specificity} vs Recall/Sensitivity
Summary metrics: ROC (rotated version) Score = 1 Score = 0
Summary metrics: PRC Score = 1 Score = 0
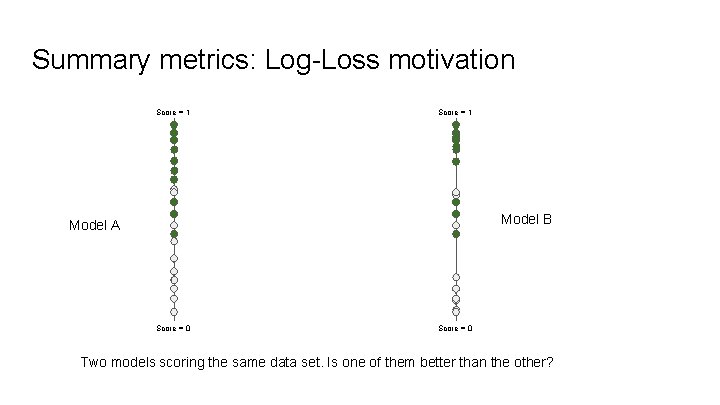
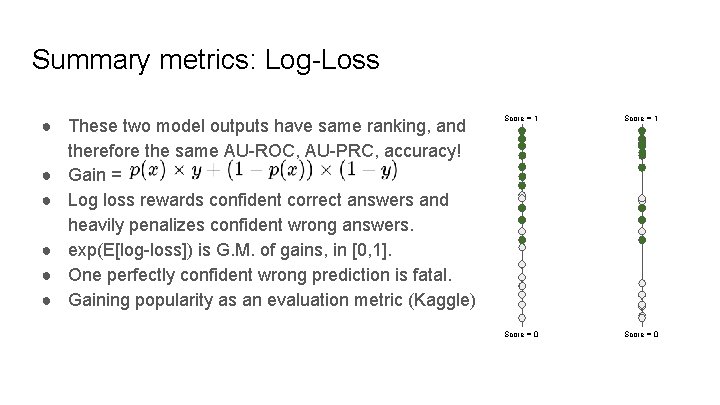
Summary metrics: Log-Loss motivation Score = 1 Model B Model A Score = 0 Two models scoring the same data set. Is one of them better than the other?
Summary metrics: Log-Loss ● These two model outputs have same ranking, and therefore the same AU-ROC, AU-PRC, accuracy! ● Gain = ● Log loss rewards confident correct answers and heavily penalizes confident wrong answers. ● exp(E[log-loss]) is G. M. of gains, in [0, 1]. ● One perfectly confident wrong prediction is fatal. ● Gaining popularity as an evaluation metric (Kaggle) Score = 1 Score = 0
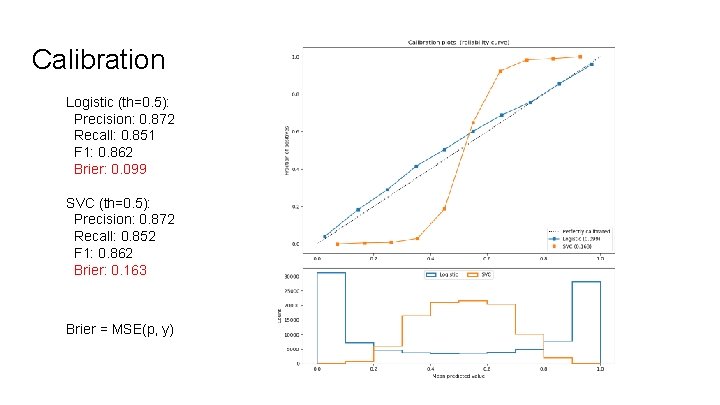
Calibration Logistic (th=0. 5): Precision: 0. 872 Recall: 0. 851 F 1: 0. 862 Brier: 0. 099 SVC (th=0. 5): Precision: 0. 872 Recall: 0. 852 F 1: 0. 862 Brier: 0. 163 Brier = MSE(p, y)
Unsupervised Learning ● log. P(x) is a measure of fit in Probabilistic models (GMM, Factor Analysis) ○ High log. P(x) on training set, but low log. P(x) on test set is a measure of overfitting ○ Raw value of log. P(x) hard to interpret in isolation ● K-means is trickier (because of fixed covariance assumption)
Class Imbalance: Problems Symptom: Prevalence < 5% (no strict definition) Metrics: may not be meaningful. Learning: may not focus on minority class examples at all (majority class can overwhelm logistic regression, to a lesser extent SVM)
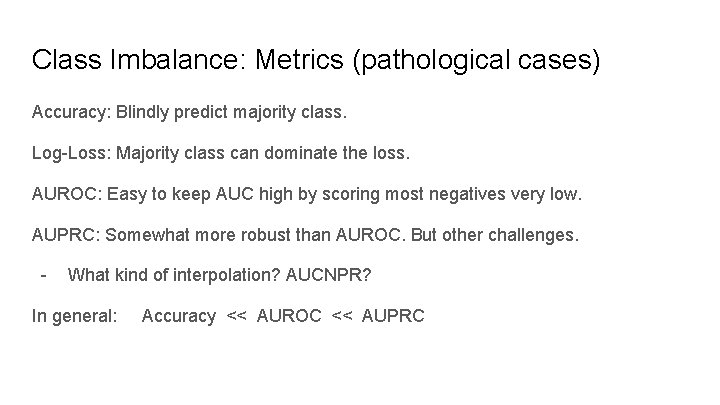
Class Imbalance: Metrics (pathological cases) Accuracy: Blindly predict majority class. Log-Loss: Majority class can dominate the loss. AUROC: Easy to keep AUC high by scoring most negatives very low. AUPRC: Somewhat more robust than AUROC. But other challenges. - What kind of interpolation? AUCNPR? In general: Accuracy << AUROC << AUPRC
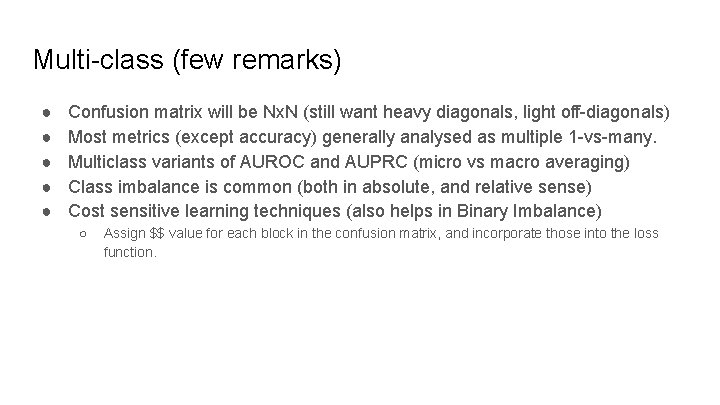
Multi-class (few remarks) ● ● ● Confusion matrix will be Nx. N (still want heavy diagonals, light off-diagonals) Most metrics (except accuracy) generally analysed as multiple 1 -vs-many. Multiclass variants of AUROC and AUPRC (micro vs macro averaging) Class imbalance is common (both in absolute, and relative sense) Cost sensitive learning techniques (also helps in Binary Imbalance) ○ Assign $$ value for each block in the confusion matrix, and incorporate those into the loss function.
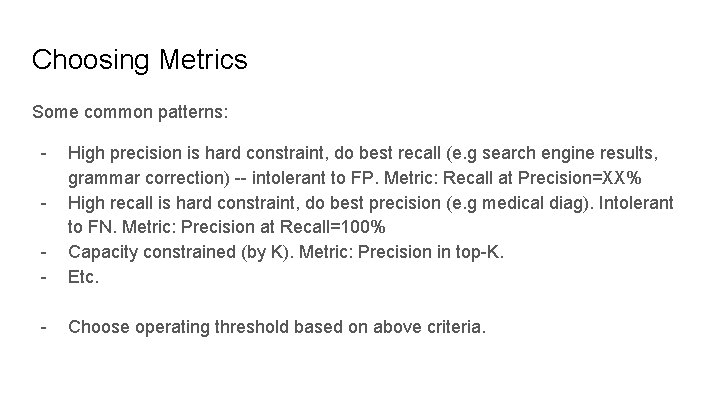
Choosing Metrics Some common patterns: - - High precision is hard constraint, do best recall (e. g search engine results, grammar correction) -- intolerant to FP. Metric: Recall at Precision=XX% High recall is hard constraint, do best precision (e. g medical diag). Intolerant to FN. Metric: Precision at Recall=100% Capacity constrained (by K). Metric: Precision in top-K. Etc. - Choose operating threshold based on above criteria. -
Thank You!