Energy Institute Naveed Arshad LUMS Energy Institute Syed

- Slides: 34
Energy Institute Naveed Arshad LUMS Energy Institute Syed Babar Ali School of Science and Engineering Lahore University of Management Sciences
Vision The vision of LUMS Energy Institute is to help the power sector in Pakistan with adoption of advanced technologies for short, medium and long term sustainable electricity provisioning for all.
Mission The mission of the LUMS Energy Institute is to carry out interdisciplinary research, development and capacity building in power and energy planning, renewable energy technologies, and grid modernization.
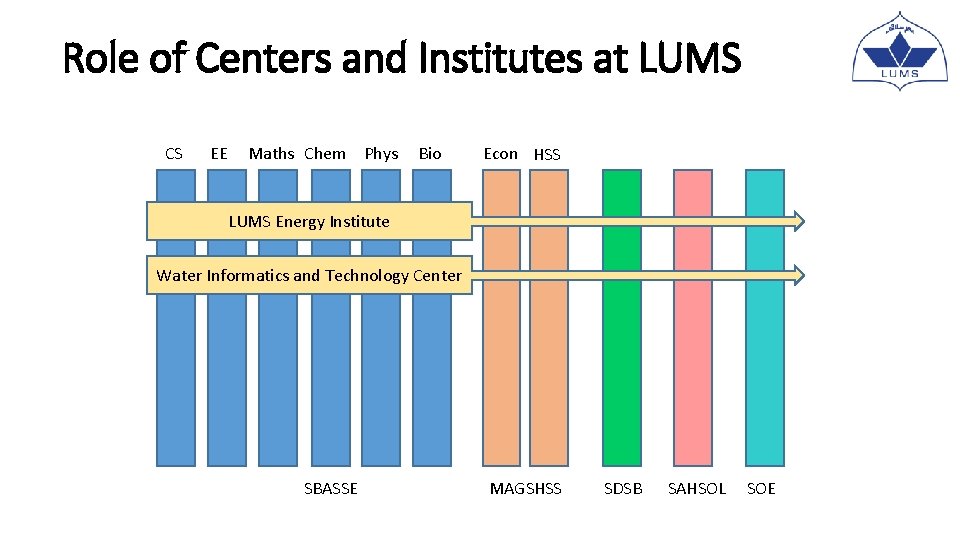
Role of Centers and Institutes at LUMS CS EE Maths Chem Phys Bio Econ HSS LUMS Energy Institute Water Informatics and Technology Center SBASSE MAGSHSS SDSB SAHSOL SOE
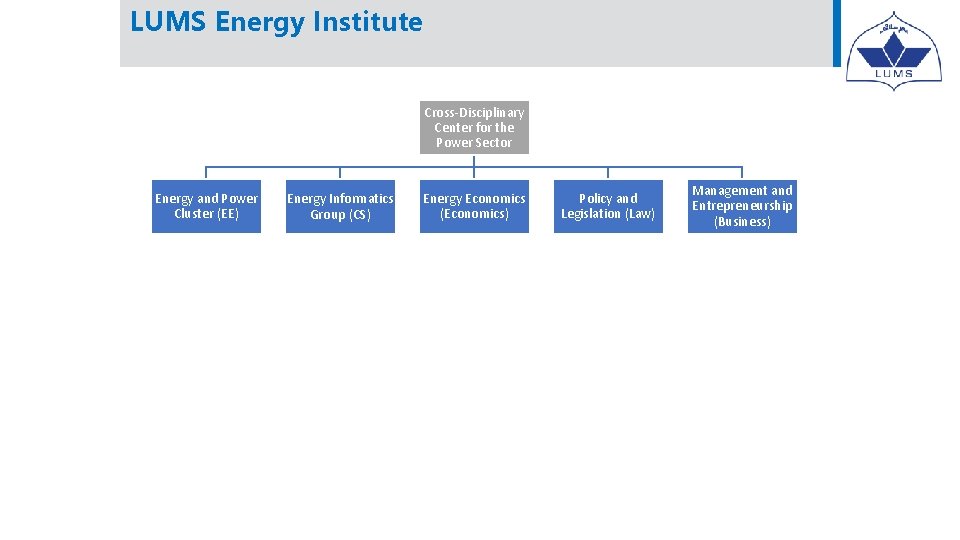
LUMS Energy Institute Cross-Disciplinary Center for the Power Sector Energy and Power Cluster (EE) Energy Informatics Group (CS) Energy Economics (Economics) Policy and Legislation (Law) Management and Entrepreneurship (Business)
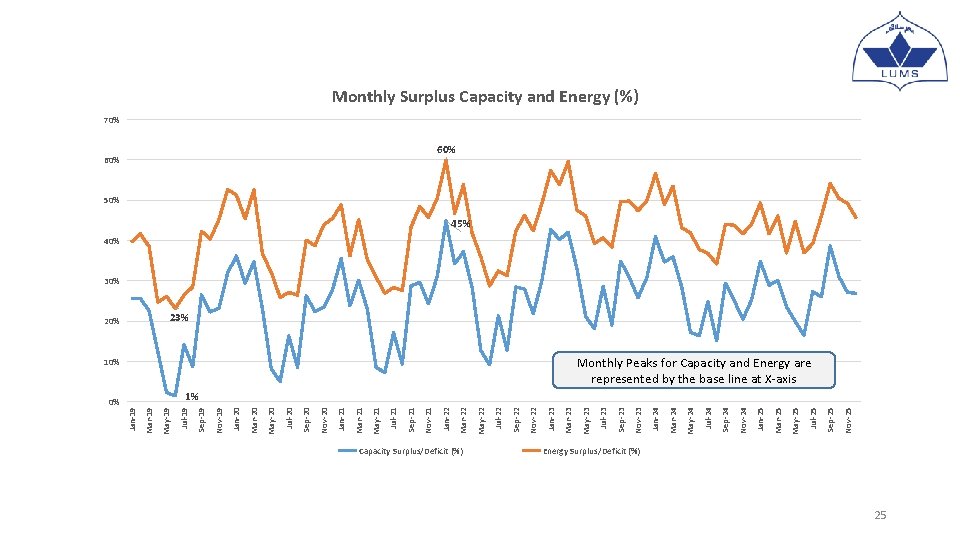
Need for the Energy Institute • Absence of Generation Expansion Plan/Integrated Energy Plan • Created Demand Supply disparity • Shortfall of generation capacity from 2006 -2017 upto 7, 000 MW • Surplus generation capacity from 2018 -2025 to the tune of 9, 300 MW • Sub-Optimal Generation Development (High CAPEX, mostly base load generation on imported fuel, and locations) • Low share of Renewables (only 32% renewable, mostly hydro) is not sustainable • Foreseeable Problems of Power Sector • • Idle capacity and energy payments as well as forced load shedding on high loss feeders Inadequate Transmission and Distribution Infrastructure (new technologies, volume of work) Governance issues with Distribution system management and operation (circular debt) Lack of capacity and capability in the available human resources • Disintegrated Power Sector • Conflicted, duplicated and orphaned roles and responsibilities of various stakeholders like NEPRA, WAPDA, NTDC, AEDB, PPIB, PEPCO, CPPA-G, NEECA/PEECA, DISCOs, Federal and Provincial Governments • Oblivion to new technologies including renewable energy and smart grids • Right structuring of power sector is a absolute must
Energy Institute Focus Power Sector • Current Yearly Financial Volume: Rs 1800 Billion • Expected 2025 Financial Volume: Rs 3000+ Billion • Current R&D Spending: Zero • Current High-Tech Local Manufacturing: Almost Zero
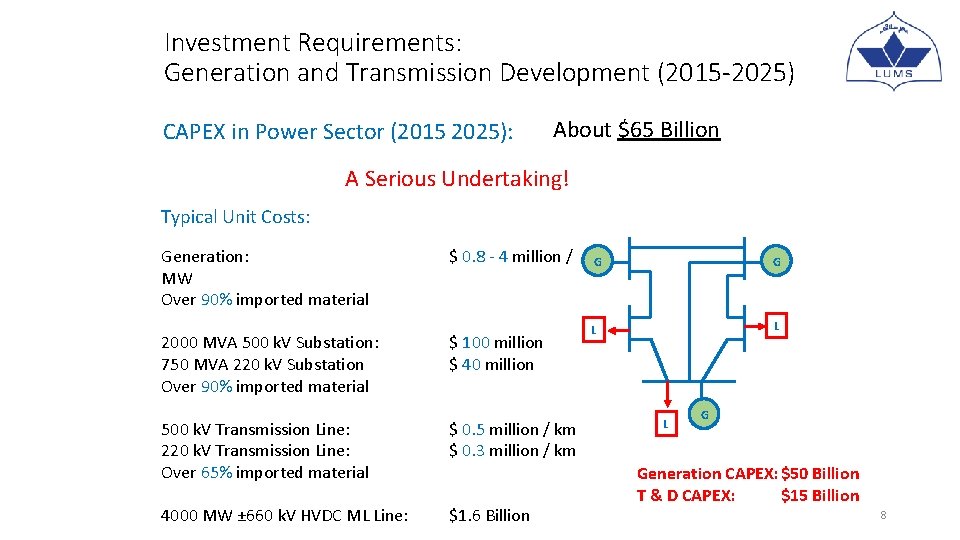
Investment Requirements: Generation and Transmission Development (2015 -2025) CAPEX in Power Sector (2015 2025): About $65 Billion A Serious Undertaking! Typical Unit Costs: Generation: MW Over 90% imported material 2000 MVA 500 k. V Substation: 750 MVA 220 k. V Substation Over 90% imported material $ 0. 8 - 4 million / $ 100 million $ 40 million 500 k. V Transmission Line: 220 k. V Transmission Line: Over 65% imported material $ 0. 5 million / km $ 0. 3 million / km 4000 MW ± 660 k. V HVDC ML Line: $1. 6 Billion G G L L L G Generation CAPEX: $50 Billion T & D CAPEX: $15 Billion 8
Energy Institute Goals • Power and Energy Planning • Adoption of Sustainable and Renewable Energy Technologies • Grid Modernization, Energy Markets and Data Analytics • Capacity Development
Goals (1) Power and Energy Planning Ø Integrated Resource Planning / Integrated System Planning Ø Policies and regulation support and advice Ø Demand forecasting (long, medium and short term) Ø Study new sources of demand including CPEC, young population, electric vehicles etc. Ø Implications on water, food and environment Ø Energy economics and business models
Goals (2) Adoption of Sustainable and Renewable Energy Technologies ØOptimal use of new renewable generation technologies in the power sector ØGrid integration studies and renewable energy production forecasting ØCapacity expansion and unit commitment models ØRole of storage and its technology assessment ØRenewable generation siting and microgrids for rural electrification. ØDisruptive technologies for the future of renewable power
Goals (3) Grid Modernization, Energy Markets and Data Analytics ØPMUs, Sensors, Smart Meters, Io. Ts … ØData analytics for better observability, predictability, controllability etc. ØEnergy Markets for Pakistan ØRight Structuring of Pakistan Power Sector ØAsset management and health monitoring
Goals (4) Capacity Development ØHuman Resource Development of the power sector ØProfessional Development Program (PDP) – New Hires ØAdvanced Development Program (ADP) – Senior Engineers ØEnergy systems and software development ØUse of data analytics in evidence based decision making ØTriple helix linkages between government, industry and academia
Hallmark of Research@LUMS Energy Institute • Blue Sky Research • Impactful Research Spanning 1 -50 Years • Research from a Vintage Point • Concept to Commercialization • Making Pakistan a leader not follower
Strategic Initiatives Immediate to Three Years Impact
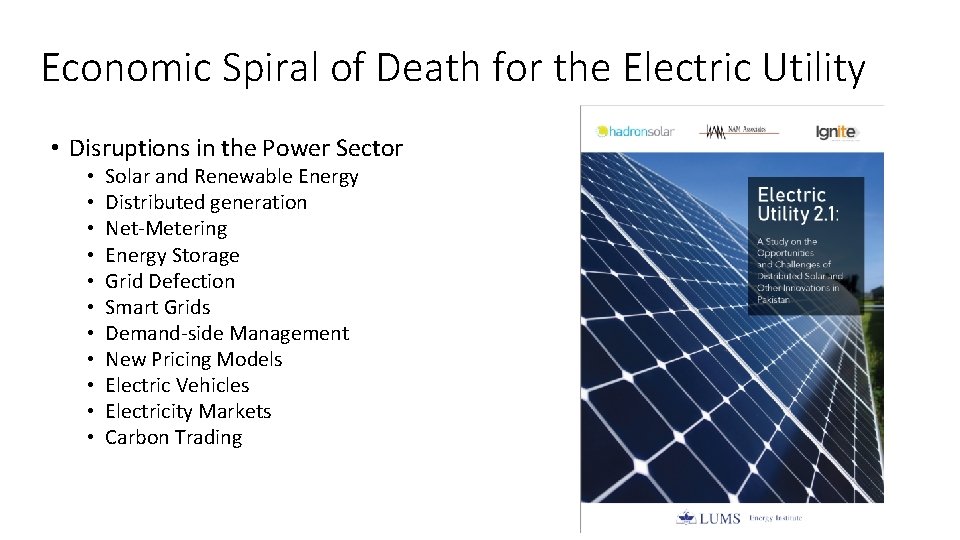
Economic Spiral of Death for the Electric Utility • Disruptions in the Power Sector • • • Solar and Renewable Energy Distributed generation Net-Metering Energy Storage Grid Defection Smart Grids Demand-side Management New Pricing Models Electric Vehicles Electricity Markets Carbon Trading
1 – Competitive Electricity Markets • Partnered with CPPA-G to develop capacity building of Competitive Electricity Markets in Pakistan • Mo. U with CPPA include • Capacity Building of the Power Sector • Housing of Demand Supply Analysis Tools • WASP, Plexos, Energy. Plan • Demand Forecasting Tool for NPCC Operations in collaboration with CPPA • R&D of software and data analytics necessary for market development
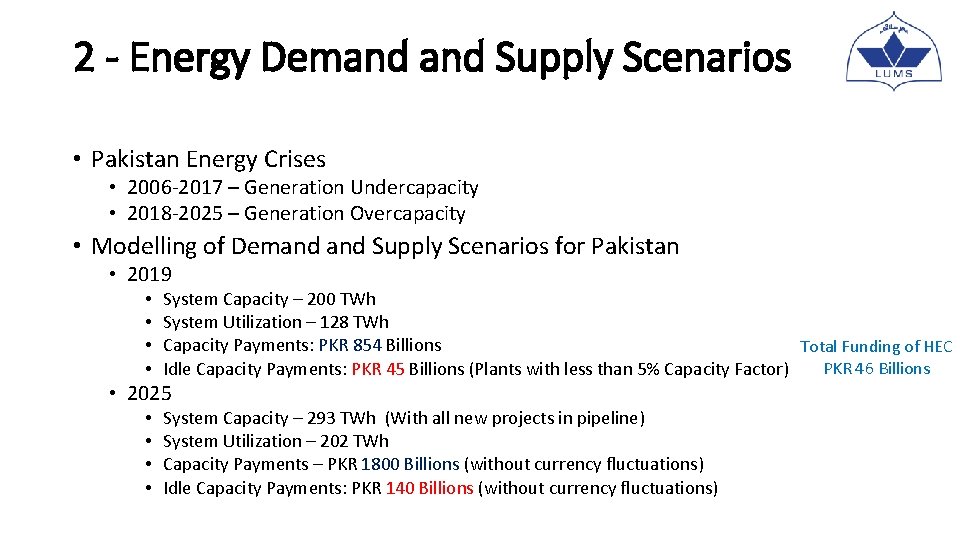
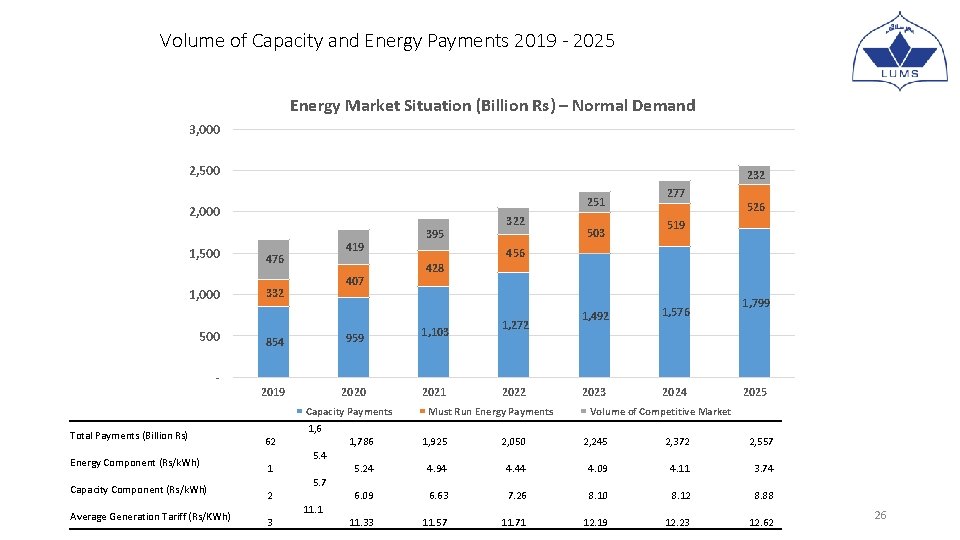
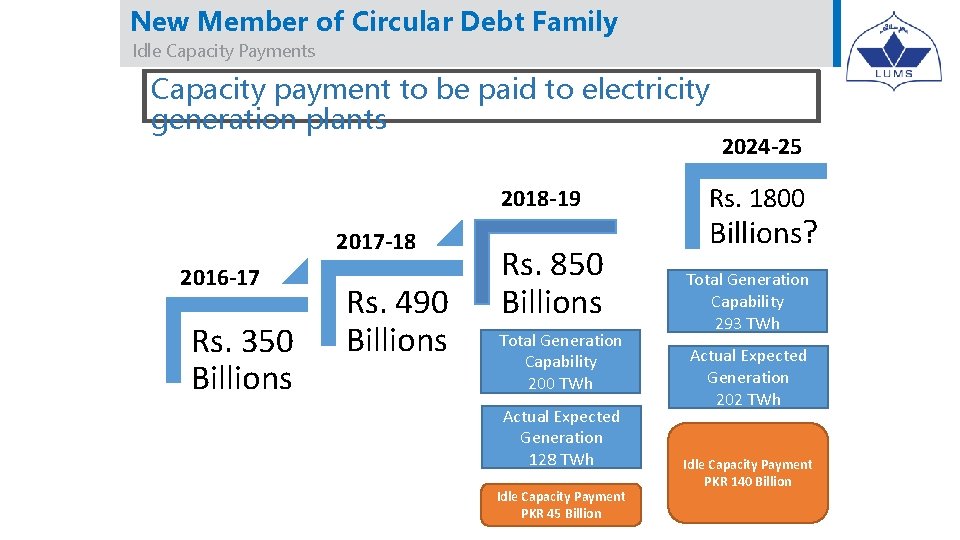
2 - Energy Demand Supply Scenarios • Pakistan Energy Crises • 2006 -2017 – Generation Undercapacity • 2018 -2025 – Generation Overcapacity • Modelling of Demand Supply Scenarios for Pakistan • 2019 • • System Capacity – 200 TWh System Utilization – 128 TWh Capacity Payments: PKR 854 Billions Total Funding of HEC PKR 46 Billions Idle Capacity Payments: PKR 45 Billions (Plants with less than 5% Capacity Factor) • 2025 • • System Capacity – 293 TWh (With all new projects in pipeline) System Utilization – 202 TWh Capacity Payments – PKR 1800 Billions (without currency fluctuations) Idle Capacity Payments: PKR 140 Billions (without currency fluctuations)
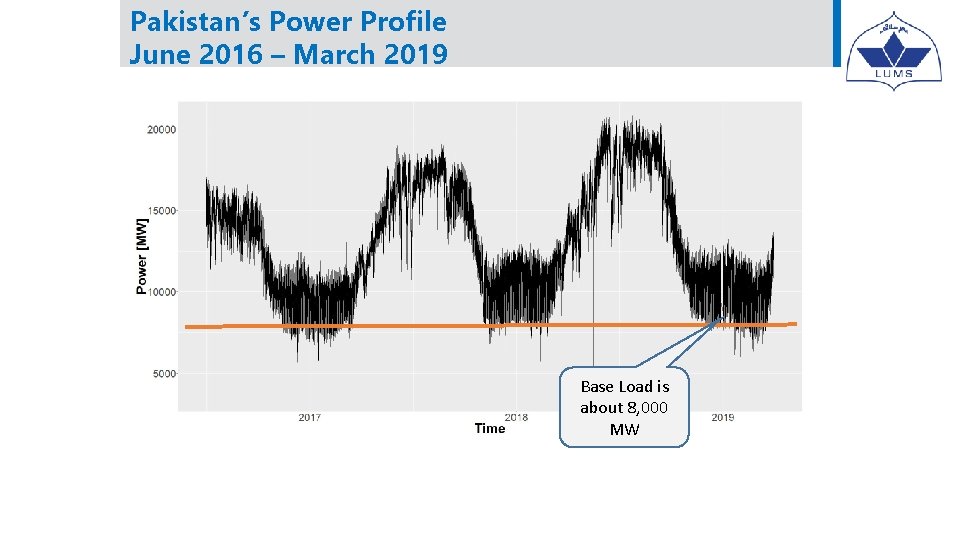
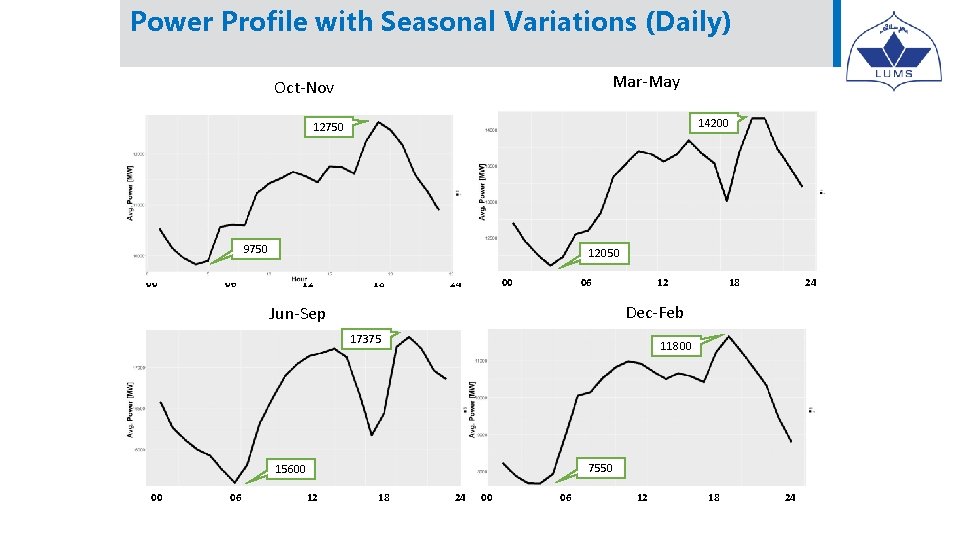
Pakistan’s Power Profile June 2016 – March 2019 Base Load is about 8, 000 MW
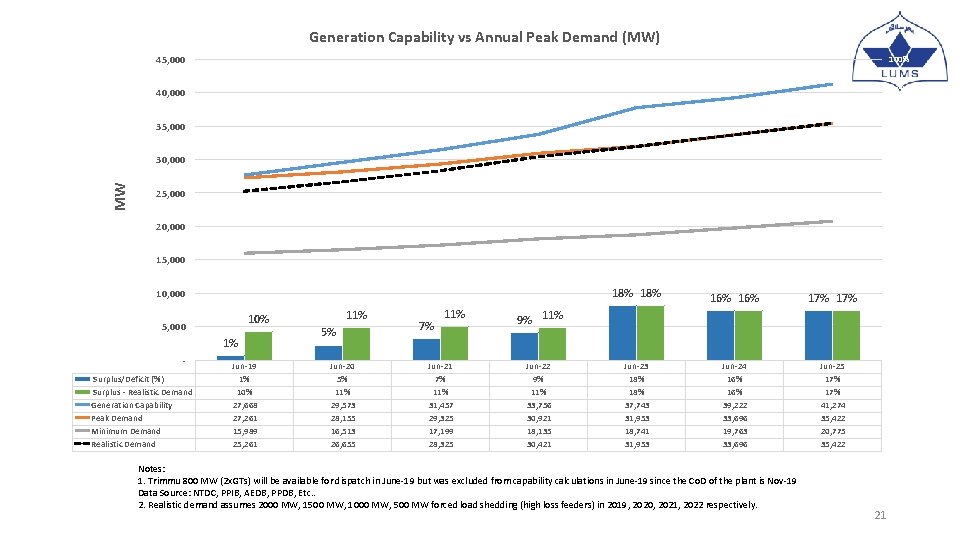
Generation Capability vs Annual Peak Demand (MW) 45, 000 100% 40, 000 90% 80% 35, 000 70% MW 30, 000 60% 25, 000 50% 20, 000 40% 15, 000 30% 18% 10, 000 10% 5, 000 1% Surplus/Deficit (%) Surplus - Realistic Demand Generation Capability Peak Demand Minimum Demand Realistic Demand Jun-19 1% 10% 27, 668 27, 261 15, 989 25, 261 11% 5% Jun-20 5% 11% 29, 573 28, 155 16, 513 26, 655 7% 11% Jun-21 7% 11% 31, 457 29, 325 17, 199 28, 325 16% 17% 20% 9% 11% Jun-22 9% 11% 33, 756 30, 921 18, 135 30, 421 10% Jun-23 18% 37, 743 31, 953 18, 741 31, 953 Jun-24 16% 39, 222 33, 696 19, 763 33, 696 Notes: 1. Trimmu 800 MW (2 x. GTs) will be available for dispatch in June-19 but was excluded from capability calculations in June-19 since the Co. D of the plant is Nov-19 Data Source: NTDC, PPIB, AEDB, PPDB, Etc. . 2. Realistic demand assumes 2000 MW, 1500 MW, 1000 MW, 500 MW forced load shedding (high loss feeders) in 2019, 2020, 2021, 2022 respectively. 0% Jun-25 17% 41, 274 35, 422 20, 775 35, 422 21
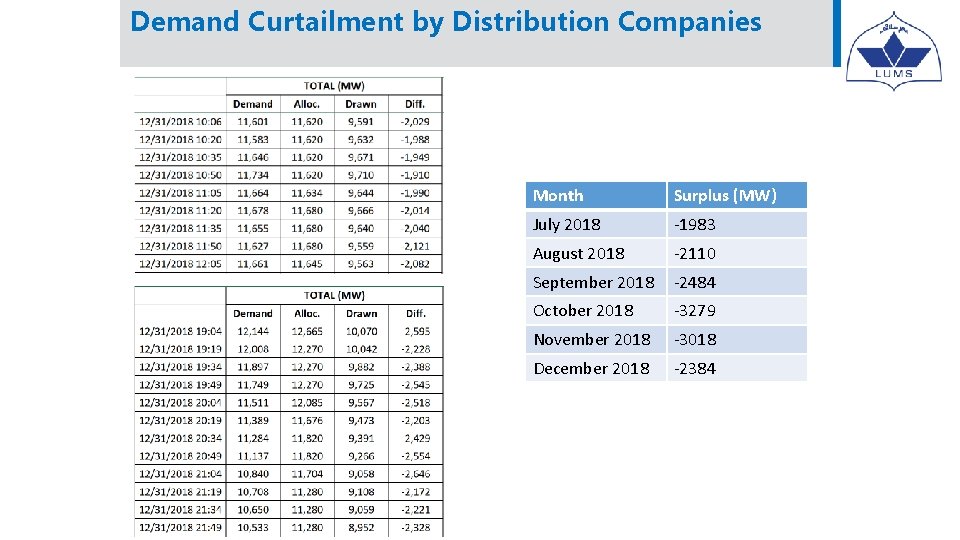
Demand Curtailment by Distribution Companies Month Surplus (MW) July 2018 -1983 August 2018 -2110 September 2018 -2484 October 2018 -3279 November 2018 -3018 December 2018 -2384
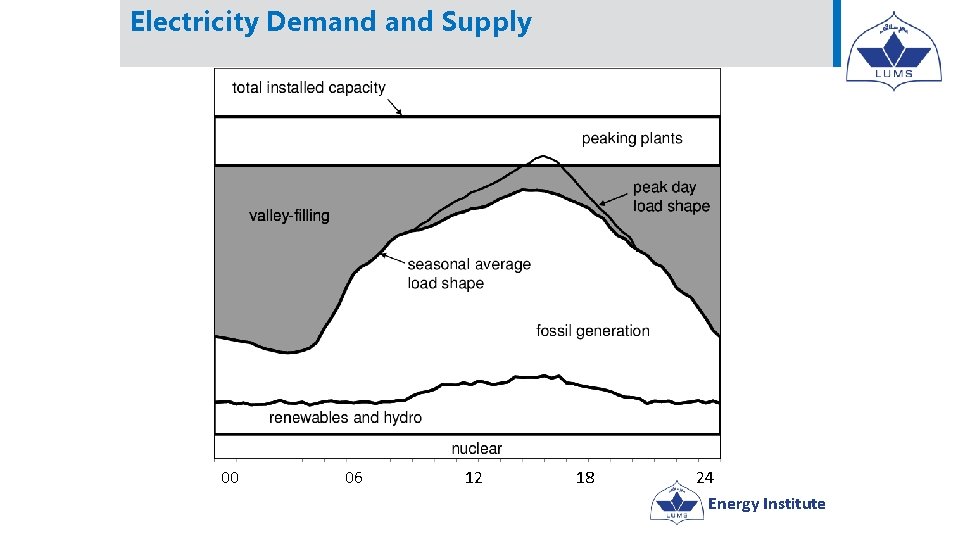
Electricity Demand Supply 00 06 12 18 24 Energy Institute
Power Profile with Seasonal Variations (Daily) Mar-May Oct-Nov 14200 12750 9750 00 06 12050 12 18 24 00 06 12 17375 11800 8550 7550 15600 06 24 Dec-Feb Jun-Sep 00 18 12 18 24 0000 0606 1212 1818 2424
0% Capacity Surplus/Deficit (%) Nov-25 Sep-25 Jul-25 May-25 Mar-25 Jan-25 Nov-24 Sep-24 Jul-24 May-24 Mar-24 Jan-24 Nov-23 Sep-23 Jul-23 10% May-23 Mar-23 Jan-23 Nov-22 Sep-22 Jul-22 May-22 Mar-22 60% Jan-22 Nov-21 Sep-21 Jul-21 May-21 Mar-21 Jan-21 Nov-20 Sep-20 Jul-20 May-20 Mar-20 Jan-20 Nov-19 Sep-19 Jul-19 20% May-19 Mar-19 Jan-19 Monthly Surplus Capacity and Energy (%) 70% 60% 50% 45% 40% 30% 23% Monthly Peaks for Capacity and Energy are represented by the base line at X-axis 1% Energy Surplus/Deficit (%) 25
Volume of Capacity and Energy Payments 2019 - 2025 Energy Market Situation (Billion Rs) – Normal Demand 3, 000 2, 500 232 251 2, 000 1, 500 1, 000 500 - 419 476 407 332 854 2019 2020 2021 Energy Component (Rs/k. Wh) Capacity Component (Rs/k. Wh) Average Generation Tariff (Rs/KWh) 1 2 3 1, 6 5. 4 5. 7 11. 1 503 519 428 1, 103 62 322 526 456 959 Capacity Payments Total Payments (Billion Rs) 395 277 1, 272 2022 Must Run Energy Payments 1, 492 1, 576 2023 2024 1, 799 2025 Volume of Competitive Market 1, 786 1, 925 2, 050 2, 245 2, 372 2, 557 5. 24 4. 94 4. 44 4. 09 4. 11 3. 74 6. 09 6. 63 7. 26 8. 10 8. 12 8. 88 11. 33 11. 57 11. 71 12. 19 12. 23 12. 62 26
Causes of Circular Debt → → → → Theft Non-payments Late payments Subsidies Technical losses Tariff Differentials Late Tariff Notifications _______ Energy Institute
New Member of Circular Debt Family Idle Capacity Payments Capacity payment to be paid to electricity generation plants 2018 -19 2017 -18 2016 -17 Rs. 350 Billions Rs. 490 Billions Rs. 850 Billions Total Generation Capability 200 TWh Actual Expected Generation 128 TWh Idle Capacity Payment PKR 45 Billion 2024 -25 Rs. 1800 Billions? Total Generation Capability 293 TWh Actual Expected Generation 202 TWh Idle Capacity Payment PKR 140 Billion
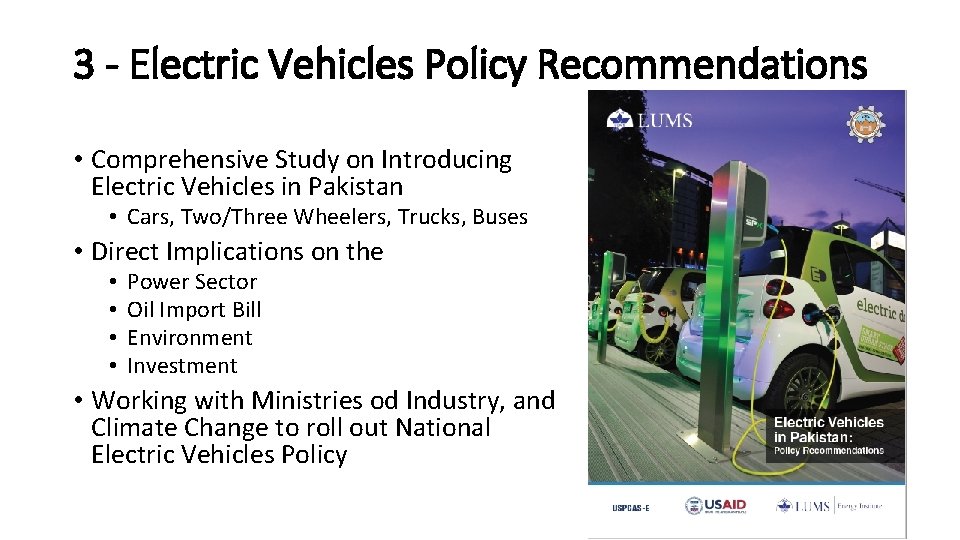
3 - Electric Vehicles Policy Recommendations • Comprehensive Study on Introducing Electric Vehicles in Pakistan • Cars, Two/Three Wheelers, Trucks, Buses • Direct Implications on the • • Power Sector Oil Import Bill Environment Investment • Working with Ministries od Industry, and Climate Change to roll out National Electric Vehicles Policy
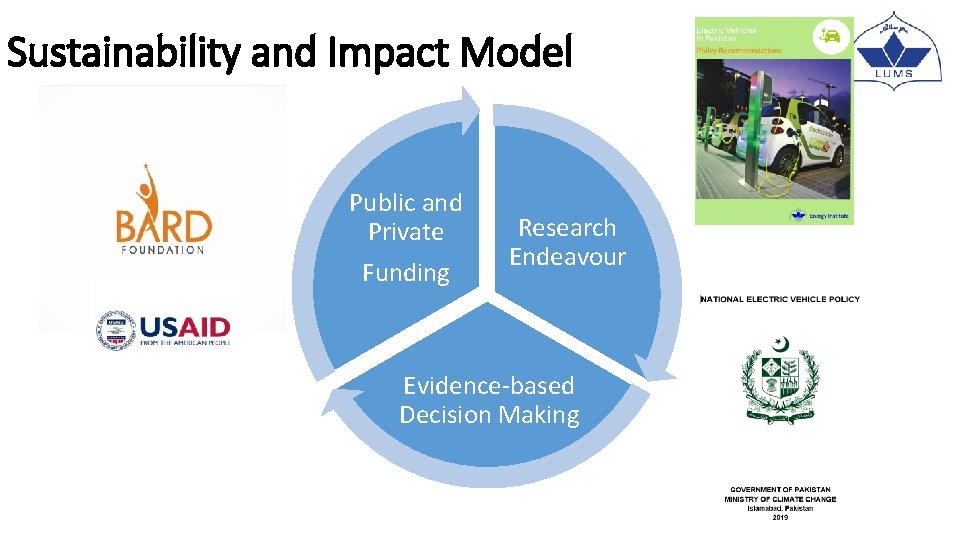
Sustainability and Impact Model Public and Private Funding Research Endeavour Evidence-based Decision Making
4 – Other Notable Initiatives • Automated Metering Infrastructure Design and Analysis with Power Information Technology Company and USAid – Mo. U to be signed on 24 th July, 2019 • Movement towards regulatory allowance of Off-grid Electrification through DC Microgrids with NEPRA • Li-ion Battery Development as replacement for conventional Lead-Acid batteries with 10 X advantage for UPS and other storage requirements • Variable Frequency Drive for Air-Conditioners and Legacy Appliances • Completion of 800 k. Wp Rooftop Solar at LUMS and helping other Govt. organizations and Universities towards rooftop solar initiatives • Participation with Planning Commission for developing Integrated Energy Plan (IEP) • Electric Utility Model for the Smart Grid • New business model for utilities to handle upcoming disruptive innovations
Strategic Research Endeavors Impact Beyond Three Years
Research Endeavors • • • Spatiotemporal Energy Forecasting Planning Deeply Intelligent Distribution System Soft Load shedding Grid free living and Energy Arbitrage using Small-Scale Batteries with decentralized PV generation Green Economic Dispatch Solar PV Duck Curve 2050/100 - Renewable Energy Plan for Pakistan Emissions Free Transportation in Pakistan’s North Policy update for net-metering
Local Partners Current Active Power Sector Partners • CPPA-G • Power Information Technology Company (PITC) • MEPCO • K-Electric • Ministry of Climate Change (Federal) Potential Partners • NEPRA • Ministry of Energy (Federal and Provincial) • NTDC / AEDB / PPIB / NEECA/ PEECA • PEPCO, WAPDA, Planning Commission • IPPs / Renewable Energy Companies / Entities of the Private Sector • Other notable entities including universities