Ecosystem monitoring and indicators Valerie Allain SPC OFP


")


")
 • Community Longevity Support (CLS)")


- Slides: 29
Ecosystem monitoring and indicators Valerie Allain SPC- OFP Ecosystem Monitoring and Analyses
WHAT DO THE TEXTS SAY?
During the past few decades implementation of an Ecosystem Approach to Fisheries Management (EAFM) has been promoted. The FAO Code of conduct for Responsible fisheries states that fisheries management should ensure the conservation not only of target species, but also sympatric non-target species. This resolution is now explicit in most Regional Fisheries Management Organisation (RFMO) conventions including the Western and Central Pacific Fisheries Commission (WCPFC).
The WCPFC convention also states that: - improved knowledge should be acquired for marine ecosystems and populations of non-target, associated and dependent species - the impacts of natural factors and human activities should be assessed - monitoring should be continued or implemented - and conservation and management measures and recommendations should be adopted.
WHERE ARE WE AT?
In single-species management measures based on stock assessment models such as FMSY can guide management decision. Analogous indices for non-target species and ecosystem are needed to implement EAFM These indices are needed to assess overall ecosystem status, the impacts of human activities, and environmental variation They are in a nascent stage of development
INTERNATIONAL WORKSHOP
International workshop on opportunities for Ecosystem Approaches to Fisheries Management in the Pacific Ocean tuna fisheries SPC, Noumea 28 March – 1 April 2011
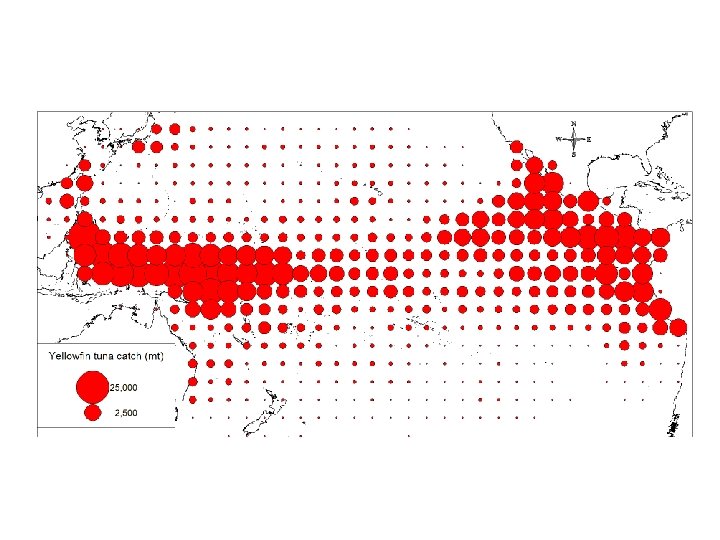
During the workshop, scientific information available from RFMOs and the main scientific organizations were synthesized into 14 presentations which included: -time series of catches (target and non-target), effort -length-frequencies -observer data -potential ecosystem metrics -information on trophic structure and mid-trophic levels -ecosystem models assimilating these data.
SOME RESULTS AND INDICATORS DEMONSTRATING CHANGES IN THE ECOSYSTEM
Time-series analyses showed changes in ecosystem structure in the central North Pacific subtropical pelagic ecosystem. At the base of the ecosystem, cholorophyll data demonstrated that oligotrophic centers of the subtropical gyres in the Pacific have expanded in area by 2 -4%/yr over the past decade. Polovina
At the top of the ecosystem, time-series of observer and logbook data from the Hawaii-based longline fishery showed an increase in catch rates of mid-trophic fishes concurrent with the declines in catch rates of apex predators Polovina
Decadal-scale diet shift in yellowfin tuna in the Eastern Pacific Set Locations 1990 s 2000 Olson s
During the intervening decade, a suite of epipelagic fishes declined from dietary dominance and were largely replaced by mesopelagic fishes and cephalopods Diet composition Auxis spp. Jumbo squid Olson Mesopel. fishes Epipel. fishes
Calculation of ecosystem indicators based on Ecopath models including trophic structure Griffiths
Griffiths
Ecosystem indicators – Structural indices • Degree (number of direct connections to other species) • Betweenness centrality • Closest centrality • Topological importance Griffiths
Ecosystem indicators – Functional indices • Community importance (CI) • Community Longevity Support (CLS) • Interaction Strength Index (ISI) • ‘Keystone’ index or ‘Keystoneness’ – The relative importance of a species • Trophic level of the catch • Fishing-in-balance index (Fi. B) • Mixed Trophic Impact Griffiths
SOME CONCLUSIONS
• Food-web models can produce various indicators particularly relevant to EAFM. • However the validity of the results is highly dependent upon the extent to which the model represents the system. • Better ecosystem (food web) models are needed (spatially-explicit) with good speciesand regionally-specific data and calibration to reliable long time series. • Research on pelagic food webs is progressing and stomach contents analyses are still necessary (monitoring indicator prey species).
• There is no panacea or “silver bullet” for ecosystem indicators • “Of the many hundreds of potential indicators that exist or have been proposed, it is not yet clear which ones achieve this purpose. ” (Fulton et al. 2004) • A combination of indices will be required to capture the range of intricate changes in an ecosystem
• Ecosystem indicators should always be interpreted along with fishing and environmental indicators • Local expertise with extended knowledge of the ecosystem functioning is critical for identifying data bias and for separating fishing from environmental effects
Future Opportunities and Priorities
1. Complete a basin wide ocean monitoring system to support EAFM across the pelagic tropical and subtropical Pacific Ocean. Extended observer coverage can provide a spatially explicit catch time-series of target and non-target species and operational level information. Would supply comprehensive catch information for the upper trophic levels for inclusion in ecosystem models as well as species-specific analyses.
2. Detailed ecological analyses of observer data available in the region should be implemented to understand the influence of environmental and fishing effects and to identify potential changes in the upper trophic levels.
3. Comparison of trophic models would be highly beneficial to ascertain the degree of difference in the function and structure of the ecosystems described across the Pacific Ocean. This comparison would assist in developing a candidate list of indices that could potentially be used by fisheries managers to assess the status of the Pacific Ocean ecosystems and the differential traits of Pacific Ocean marine food webs.
4. These models would also benefit from time series of the composition and biomass estimates of mid-trophic level organisms. Enhanced collection of data on these organisms through standardised acoustic surveys should be encouraged. Predatory fishes are also effective ‘biological samplers’ of this forage and the expanding temporal and spatial coverage of observers across the Pacific Ocean provides an opportunity for the systematic sampling of mid-trophic levels via the stomach contents.
5. Analyses to identify dynamic oceanographic biomes are an immediate priority. Subsequent analysis to associate these biomes with tuna size patterns, growth rates, bycatch composition, diet composition, fat content and stable isotope signatures would provide the spatial template necessary for future sampling programs.