Ecology 8310 Population and Community Ecology Context What
 Ecology")
")


 correlations between vital rates [although I think")

 Small Bluegill Littoral Invertebrate")

…")
 High fitness X Low fitness Trait 1 (Z")
 Common empirical pattern: Trait 1 (Z 1)")
")


 High fitness X Low fitness Trait")
? (in which total allocation to Z 1")
 gh Lo w re so")
 Alternative interpretation: Trait 1 (Z 1)")
 Alternative interpretation: Trade-off hidden by variation in resource acquisition Trait")

")
 i. e. , deleterious environmental change is")

 DC doesn't require negative correlation across space 2) But, at")
 Obtain vital rates for many populations 2) Contribution")
 2. Contributions of vital")

 g = Pr(growth|survival)")
 Convert vital rate to \"contribution to growth, C\" 2)")


 with a comparative study (in")
")

- Slides: 42
Ecology 8310 Population (and Community) Ecology
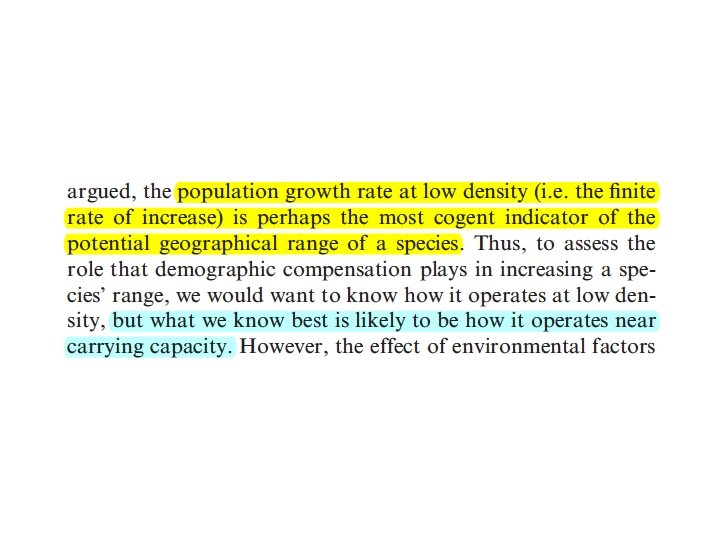
Context • What accounts for the distributional limit? 1. dispersal (perhaps with Allee effects) 2. biotic and abiotic factors • If environmental factors, then: 1. λ(N≈0) > 1 within distribution 2. λ(N≈0) < 1 outside of distribution
Context
Context • Environmental change: • Many species have shifted their ranges in recent decades… • "¼ - ½ of species show no net range shift" (Doak & Morris 2010) • Why?
Context • λ is a complex "trait" • Determined by vital rates: • Birth (or recruitment) rate • Death (or survival) rate • Growth rate (progression to next stage) • These rates may not change concordantly across environmental gradients
Demographic Compensation Various meanings in the literature: • Most commonly: beneficial responses in a vital rate following a deleterious external event (e. g. , birth rates increase after a hurricane). • Usually due to reduction in density-dependence. • Villellas et al: "we mean changes in opposite directions in mean vital rates across populations"
Other studies suggest negative (spatial and/or temporal) correlations between vital rates [although I think the evidence in these citations is weak…to the left is one of the most compelling data] Doak, D. F. & Morris, W. F. (2010). Demographic compensation and tipping points in climate-induced range shifts. Nature, 467, 959– 962.
1. Is it present? 2. What is the pattern? 3. What causes it?
Demographic Compensation 1. Density – mediated (e. g. , sunfish) Small Bluegill Littoral Invertebrate s Large Bluegill Zooplankton
Demographic Compensation 2. Other drivers of negative correlations: • Genetic architecture • Biochemical processes • Energetic constraints
Let's consider two traits (very simplistically)…
Fitness landscapes Trait 2 (Z 2) High fitness X Low fitness Trait 1 (Z 1)
Trait 2 (Z 2) Common empirical pattern: Trait 1 (Z 1)
But what about trade-offs (and the factors driving the variation in traits)
Egg number vs. size Daniel D. Heath et al. Science 2003; 299: 1738 -1740
What if there is a trade-off between Z 1 and Z 2 (i. e. , you can't easily evolve in both directions)?
Fitness landscapes & trade-offs Trait 2 (Z 2) High fitness X Low fitness Trait 1 (Z 1)
What if there are different environments (genotypes)? (in which total allocation to Z 1 and Z 2 is greater or lesser? )
Fitness landscapes & trade-offs Hi Trait 2 (Z 2) gh Lo w re so ur ce ac qu re so u rc isi tio es Trait 1 (Z 1) n
Trait 2 (Z 2) Alternative interpretation: Trait 1 (Z 1)
Trait 2 (Z 2) Alternative interpretation: Trade-off hidden by variation in resource acquisition Trait 1 (Z 1)
So, if the environment changes, what would we expect in terms of the response of Z 1 and Z 2?
From Kerfoot et al. (1985)
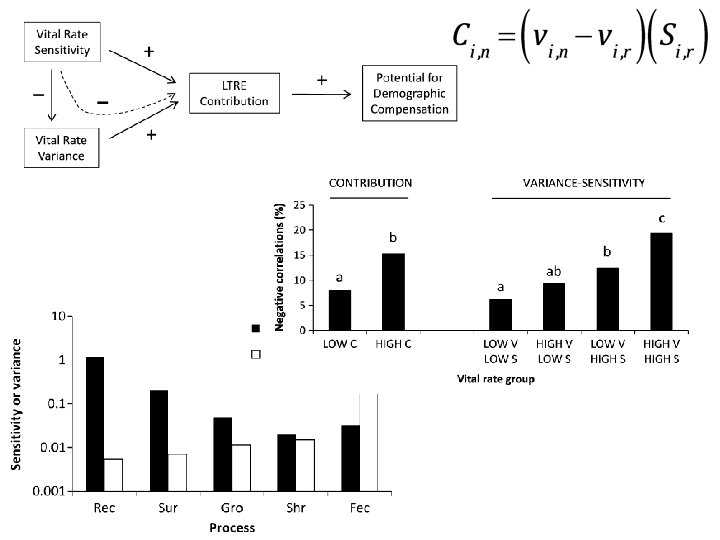
Demographic Compensation = "Trade-off" (between vital rates) i. e. , deleterious environmental change is expected to reduce vital rates (thus reducing population growth). Demographic Compensation can buffer this response (at the extreme, another vital rate will increase).
Their perspective:
Context My view: 1) DC doesn't require negative correlation across space 2) But, at most, an inverse response to change 3) Which buffers response to the change
Approach by Villellas et al 1) Obtain vital rates for many populations 2) Contribution of vital rate to λ 3) Assess correlations among rates 4) For 26 species with >6 pops.
Two analytic challenges 1. Estimation of vital rates (from matrix) 2. Contributions of vital rates to λ (via LTRE)
Projection matrix vital rates Seedbank Seedlings Small juveniles Large juveniles Small adults Large adults • Why isn't there a S 22 term? • Why are there fecundity terms in the second row?
Projection matrix vital rates Sums to s 4 s = Pr(survival) g = Pr(growth|survival) (by any amount) r = Pr (revert|survival) (by any amount) k (or h) = Pr (growth (or shinkage) by >1 step | survival and growth) l = Pr (growth by >2 steps | survival, grow by >1 step) f = fecundity (includes some survival) z = Pr (germination from seedbank); sz = "recruitment"
Life Table Response Experiment 1) Convert vital rate to "contribution to growth, C" 2) Originally proposed to compare two treatments in an experiment (Caswell 2001 – classic book) 3) Here, "reference" is the mean across all populations:
A result 24/ 26 studies had significantly more POSITIVE correlations than expected by chance What does this mean?
A result 11 / 26 studies had significantly more NEGATIVE correlations than expected by chance What does this mean?
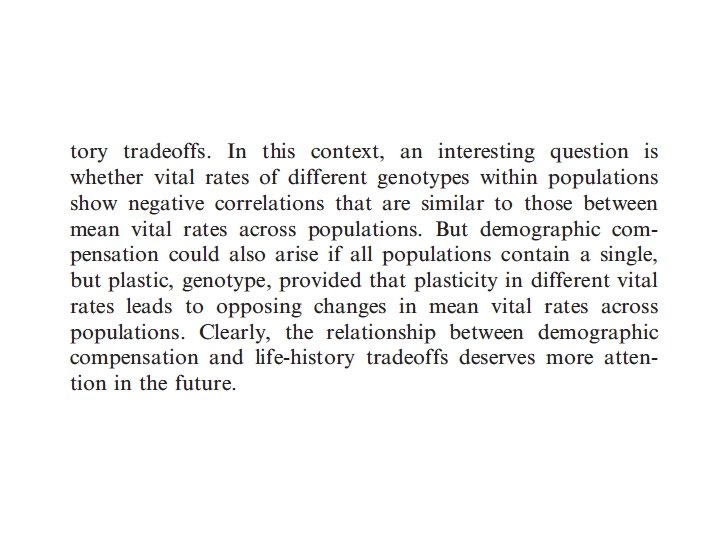
Other results What might this tell us about life history tradeoffs?
How do you expect vital rates to co-vary across space?
What if you examined these patterns at low N vs. near equilibrium?
Timescale issues Compare an experiment (short-term change in environment) with a comparative study (in which the populations have existed for many generations) What do you expect in terms of demographic compensation?
Do these patterns arise from underlying genetic differences or plasticity? (does it matter? )
Bottomline: