Driving with Knowledge from the Physical World Jing
- Slides: 29
Driving with Knowledge from the Physical World Jing Yuan, Yu Zheng Microsoft Research Asia
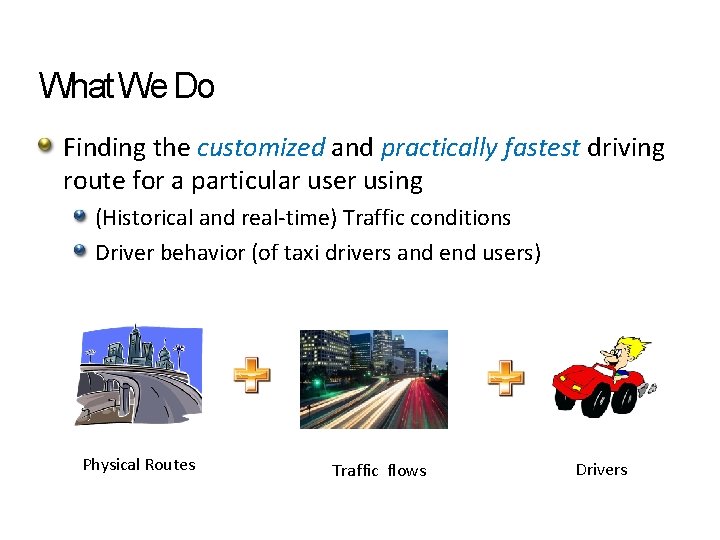
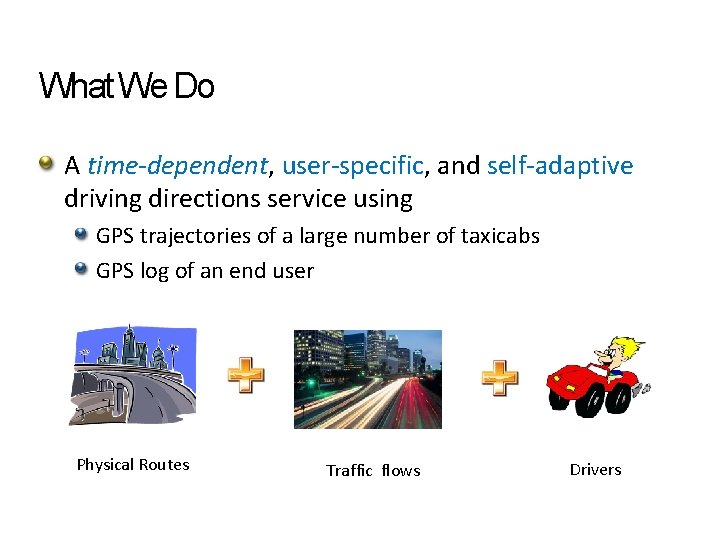
What We Do Finding the customized and practically fastest driving route for a particular user using (Historical and real-time) Traffic conditions Driver behavior (of taxi drivers and end users) Physical Routes Traffic flows Drivers
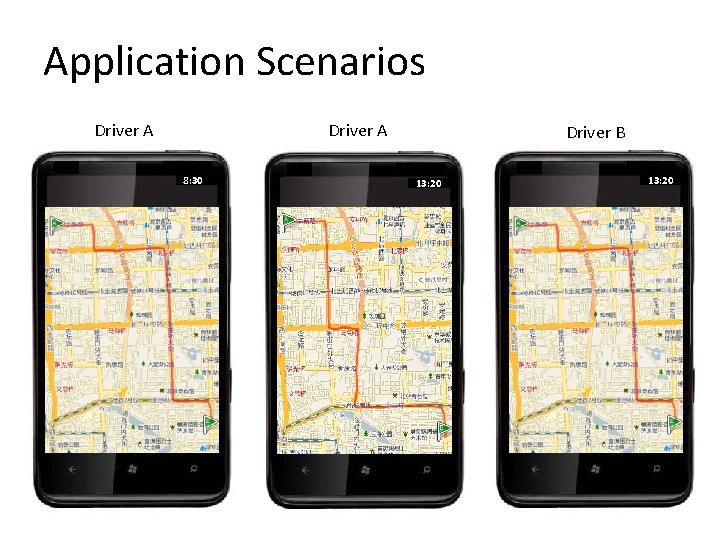
Application Scenarios Driver A 8: 30 Driver B 13: 20
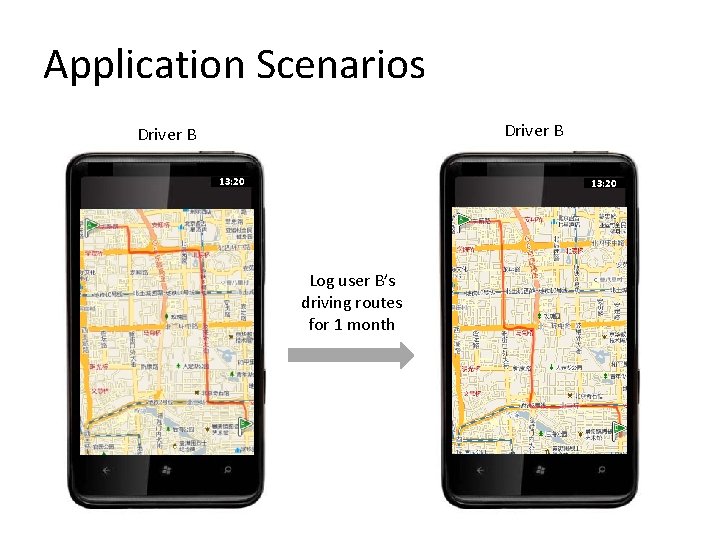
Application Scenarios Driver B 13: 20 Log user B’s driving routes for 1 month
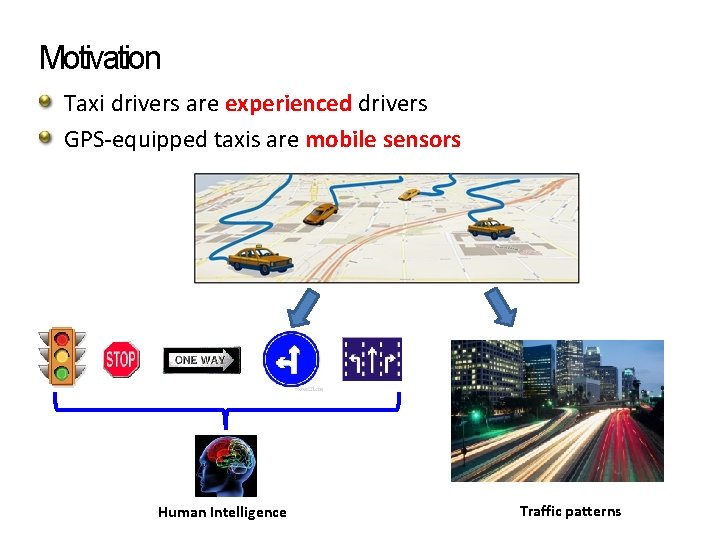
Motivation Taxi drivers are experienced drivers GPS-equipped taxis are mobile sensors Human Intelligence Traffic patterns
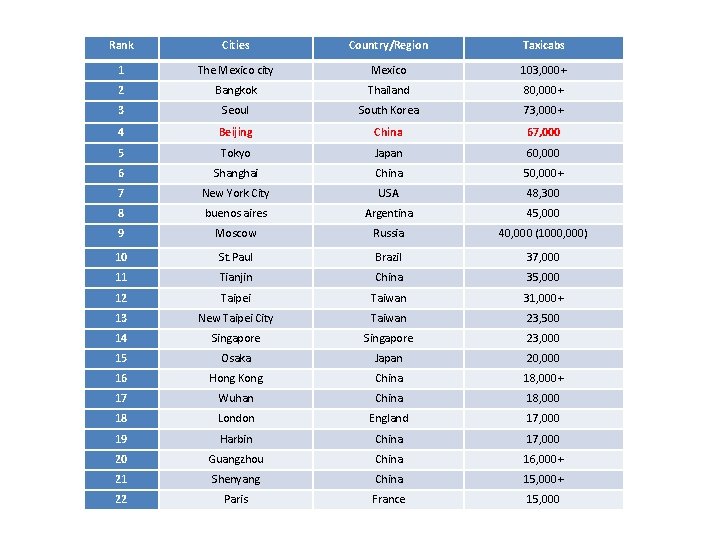
Rank Cities Country/Region Taxicabs 1 The Mexico city Mexico 103, 000+ 2 Bangkok Thailand 80, 000+ 3 Seoul South Korea 73, 000+ 4 Beijing China 67, 000 5 Tokyo Japan 60, 000 6 Shanghai China 50, 000+ 7 New York City USA 48, 300 8 buenos aires Argentina 45, 000 9 Moscow Russia 40, 000 (1000, 000) 10 St. Paul Brazil 37, 000 11 Tianjin China 35, 000 12 Taipei Taiwan 31, 000+ 13 New Taipei City Taiwan 23, 500 14 Singapore 23, 000 15 Osaka Japan 20, 000 16 Hong Kong China 18, 000+ 17 Wuhan China 18, 000 18 London England 17, 000 19 Harbin China 17, 000 20 Guangzhou China 16, 000+ 21 Shenyang China 15, 000+ 22 Paris France 15, 000
What We Do A time-dependent, user-specific, and self-adaptive driving directions service using GPS trajectories of a large number of taxicabs GPS log of an end user Physical Routes Traffic flows Drivers
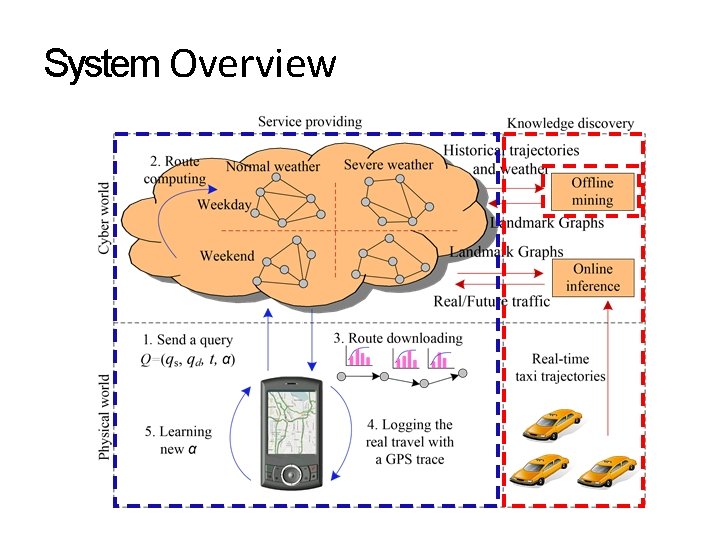
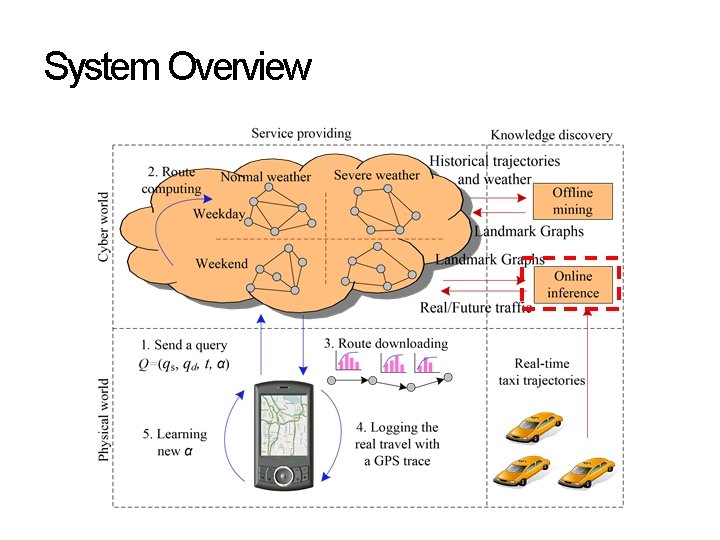
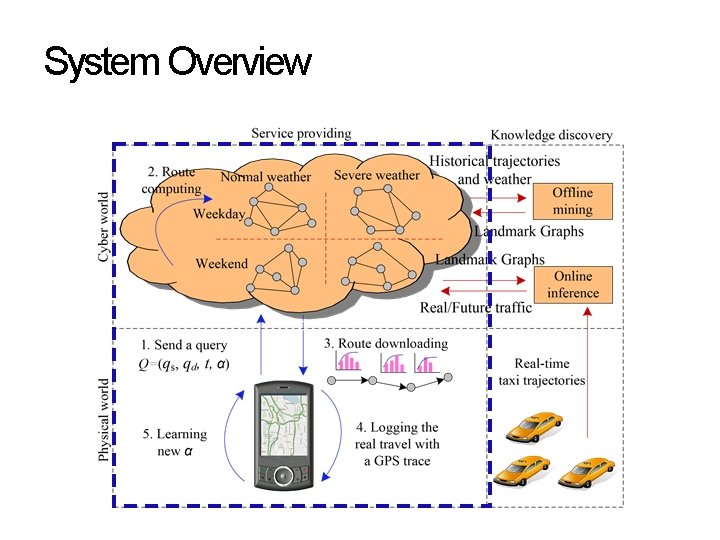
System Overview 0
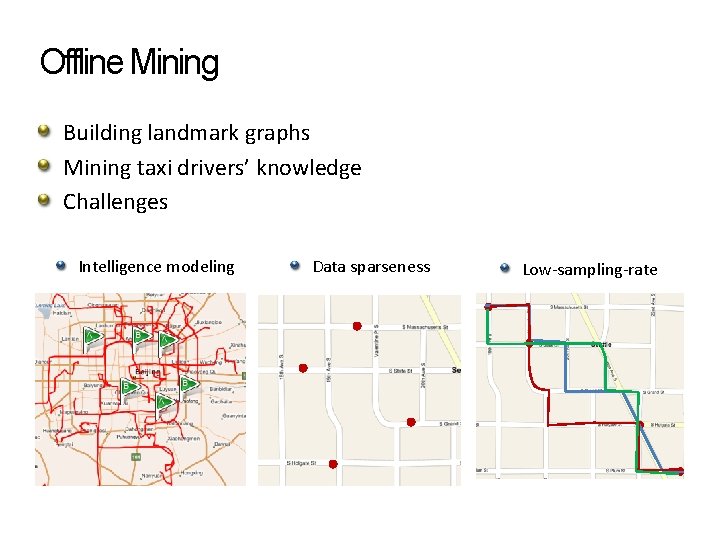
Offline Mining Building landmark graphs Mining taxi drivers’ knowledge Challenges Intelligence modeling Data sparseness Low-sampling-rate
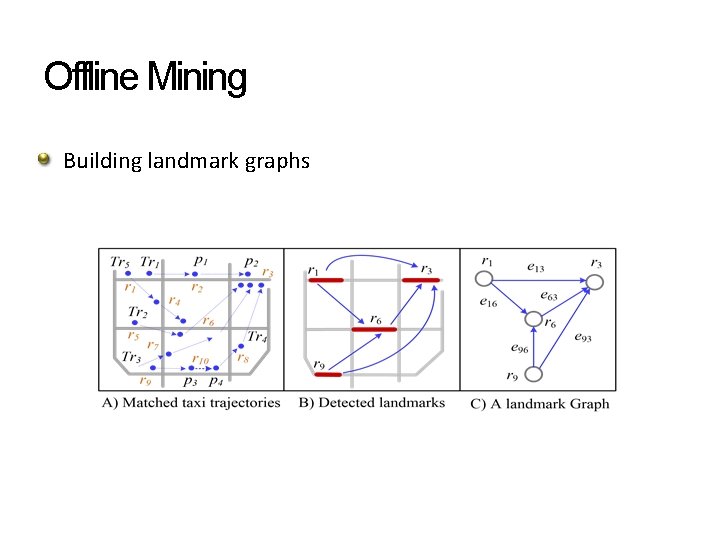
Offline Mining Building landmark graphs
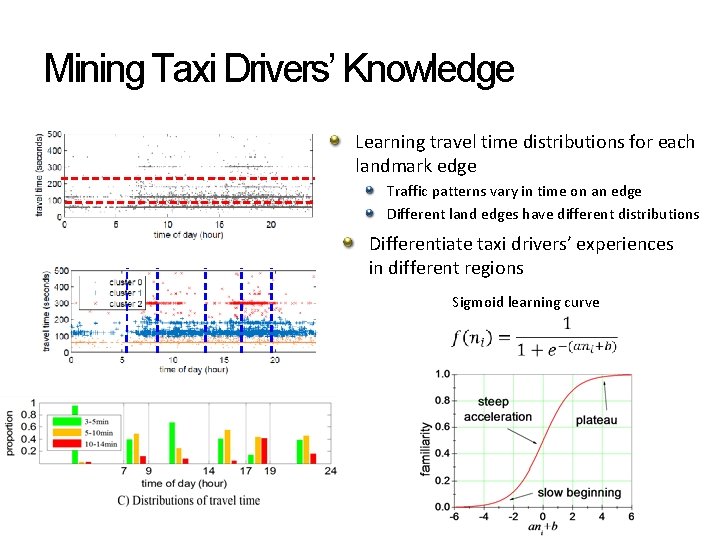
Mining Taxi Drivers’ Knowledge Learning travel time distributions for each landmark edge Traffic patterns vary in time on an edge Different land edges have different distributions Differentiate taxi drivers’ experiences in different regions Sigmoid learning curve
System Overview
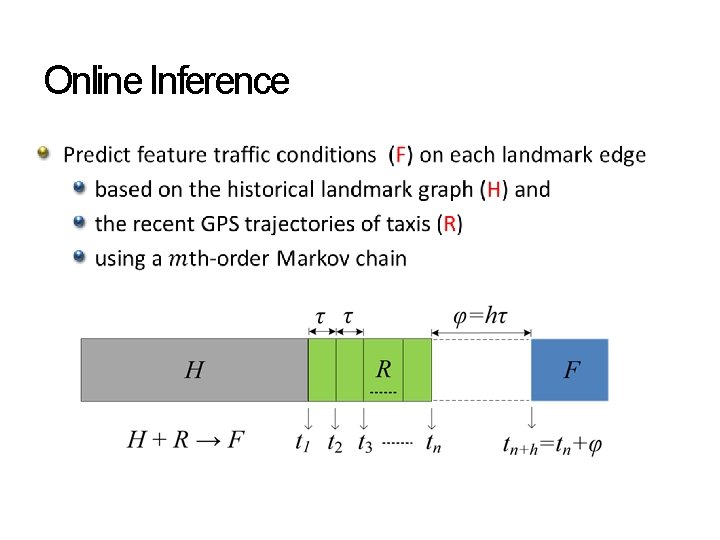
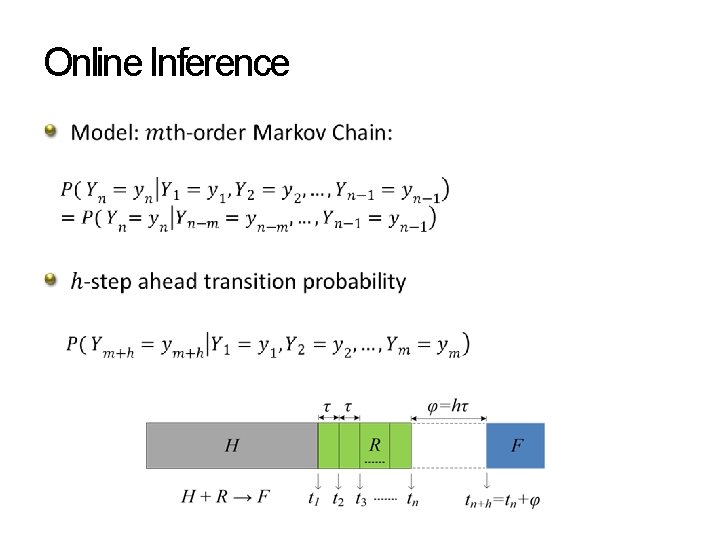
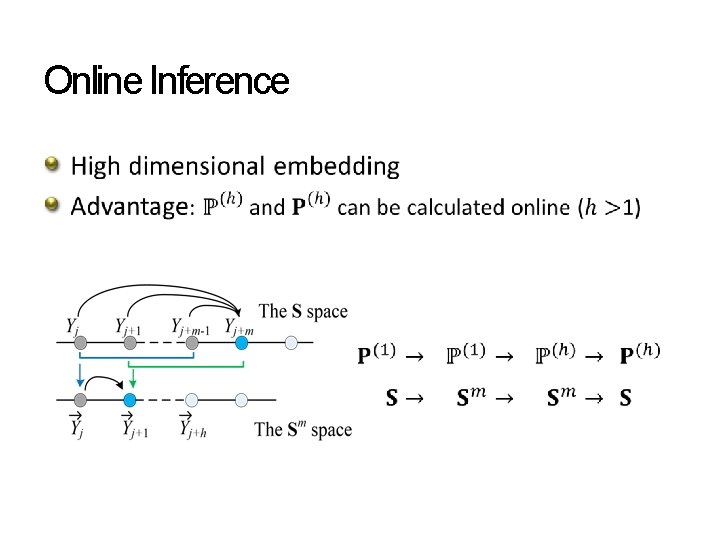
Online Inference
Online Inference •
Online Inference •
System Overview 0
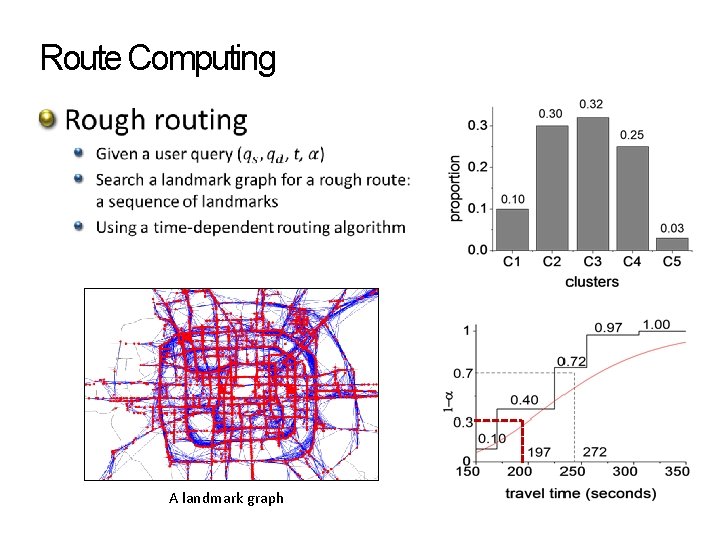
Route Computing A landmark graph
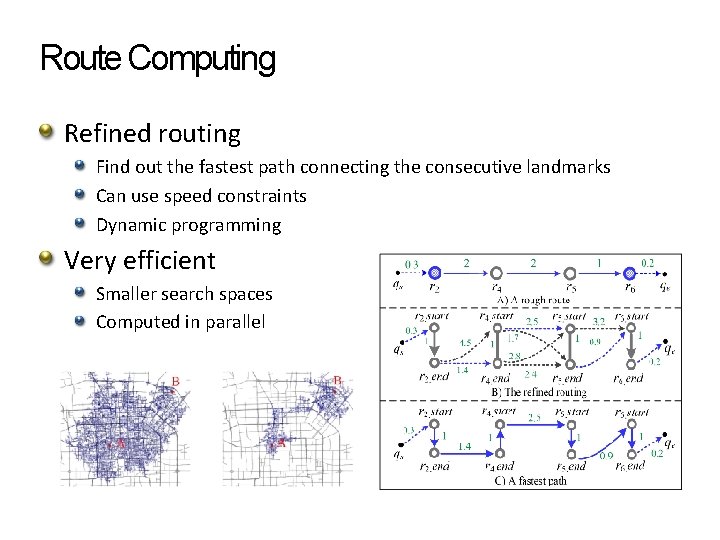
Route Computing Refined routing Find out the fastest path connecting the consecutive landmarks Can use speed constraints Dynamic programming Very efficient Smaller search spaces Computed in parallel
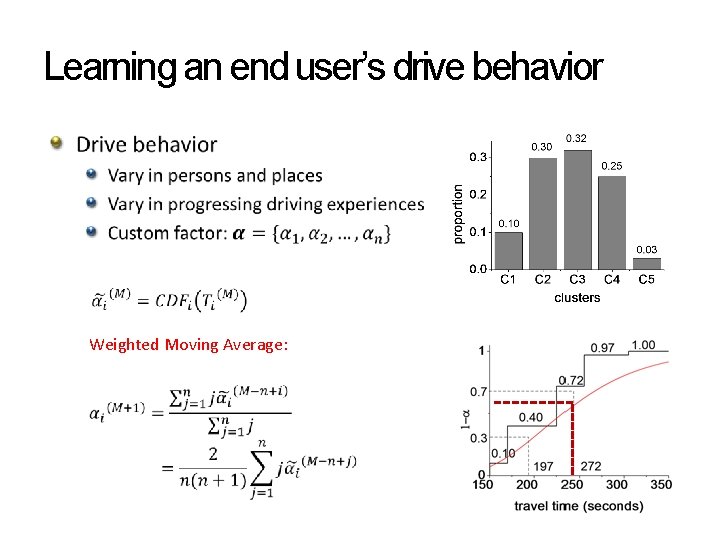
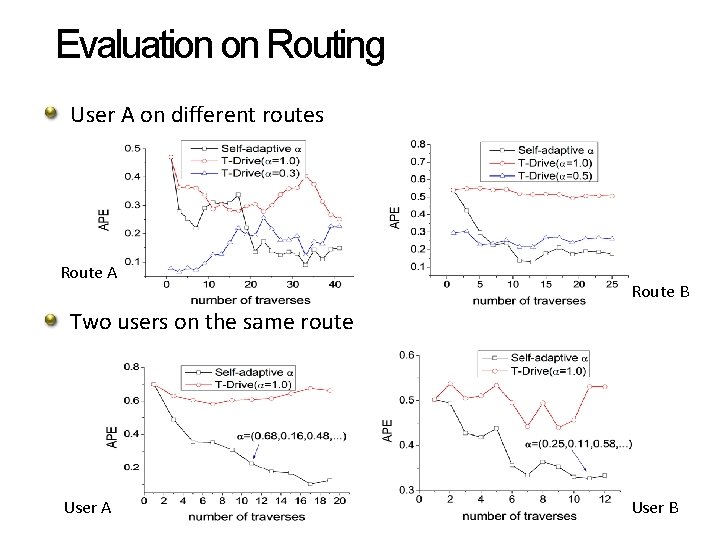
Learning an end user’s drive behavior Weighted Moving Average:
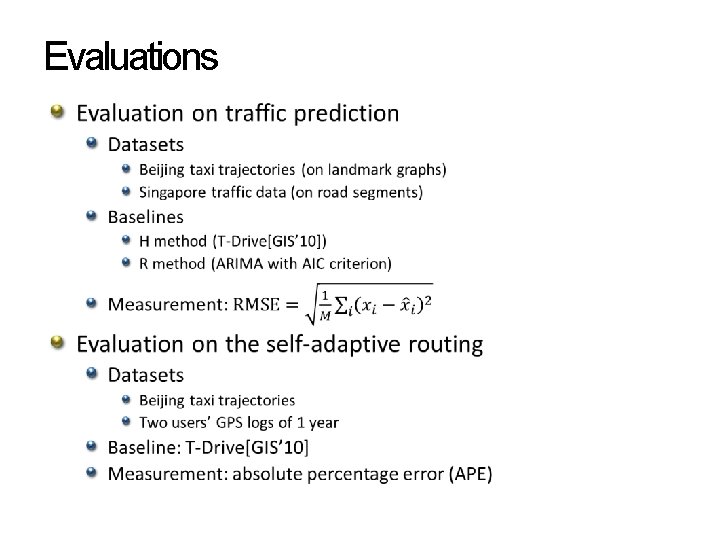
Evaluations •
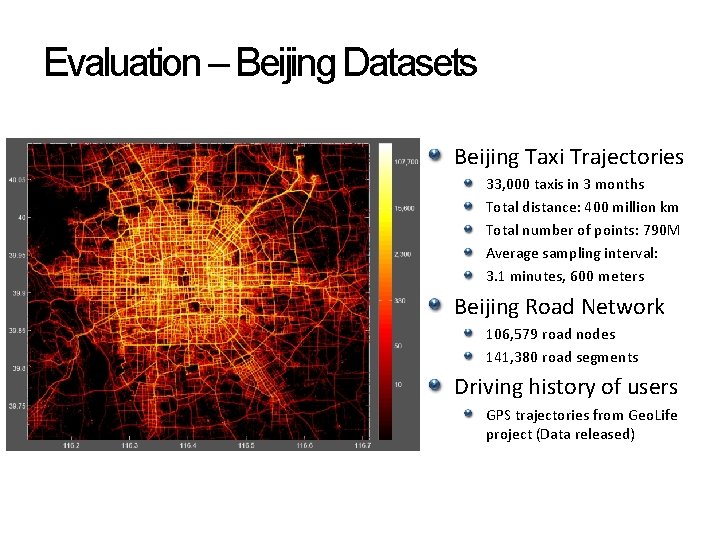
Evaluation – Beijing Datasets Beijing Taxi Trajectories 33, 000 taxis in 3 months Total distance: 400 million km Total number of points: 790 M Average sampling interval: 3. 1 minutes, 600 meters Beijing Road Network 106, 579 road nodes 141, 380 road segments Driving history of users GPS trajectories from Geo. Life project (Data released)
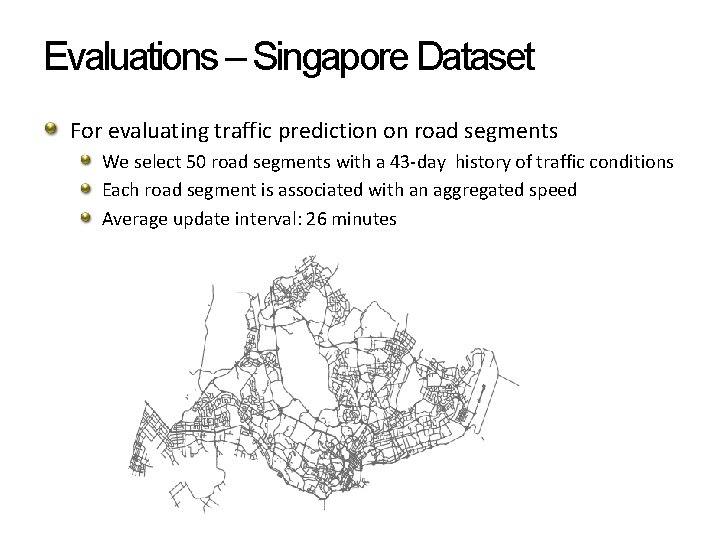
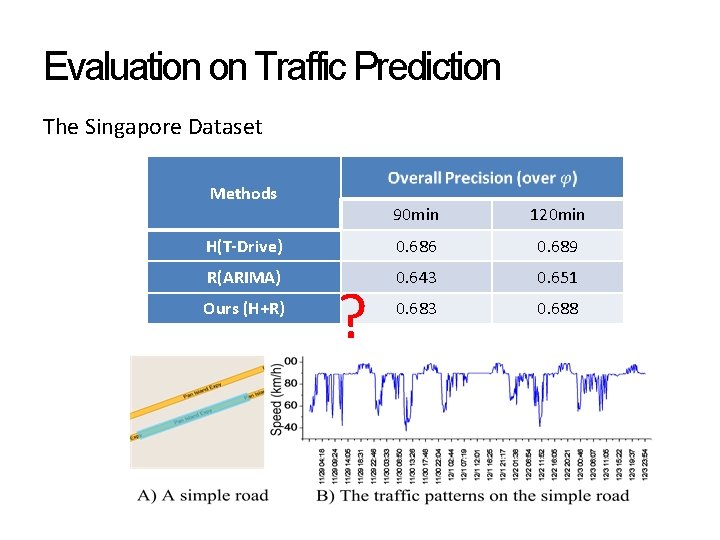
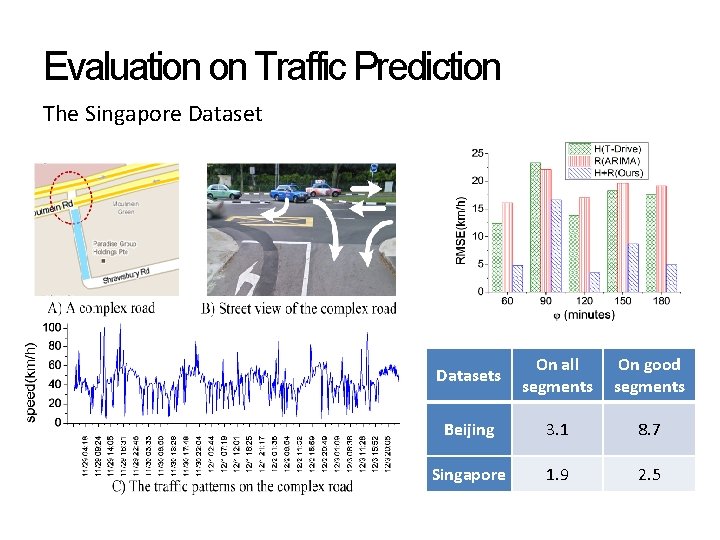
Evaluations – Singapore Dataset For evaluating traffic prediction on road segments We select 50 road segments with a 43 -day history of traffic conditions Each road segment is associated with an aggregated speed Average update interval: 26 minutes
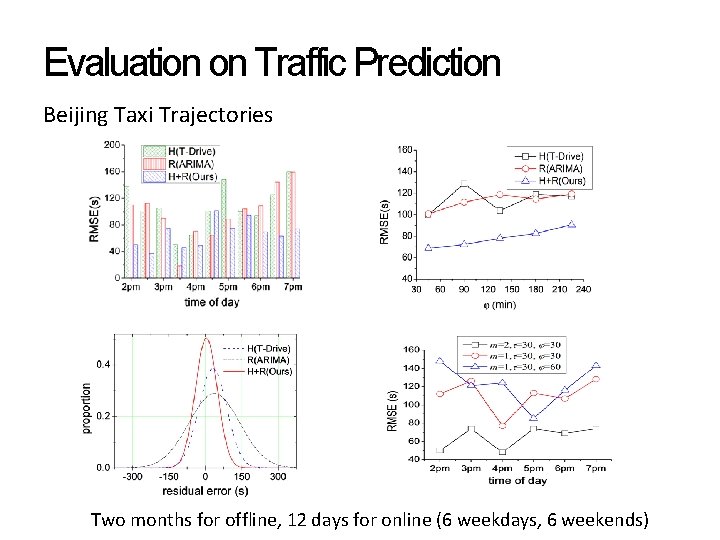
Evaluation on Traffic Prediction Beijing Taxi Trajectories Two months for offline, 12 days for online (6 weekdays, 6 weekends)
Evaluation on Traffic Prediction The Singapore Dataset Methods 90 min 120 min H(T-Drive) 0. 686 0. 689 R(ARIMA) 0. 643 0. 651 0. 683 0. 688 Ours (H+R) ?
Evaluation on Traffic Prediction The Singapore Datasets On all segments On good segments Beijing 3. 1 8. 7 Singapore 1. 9 2. 5
Evaluation on Routing User A on different routes Route A Route B Two users on the same route User A User B
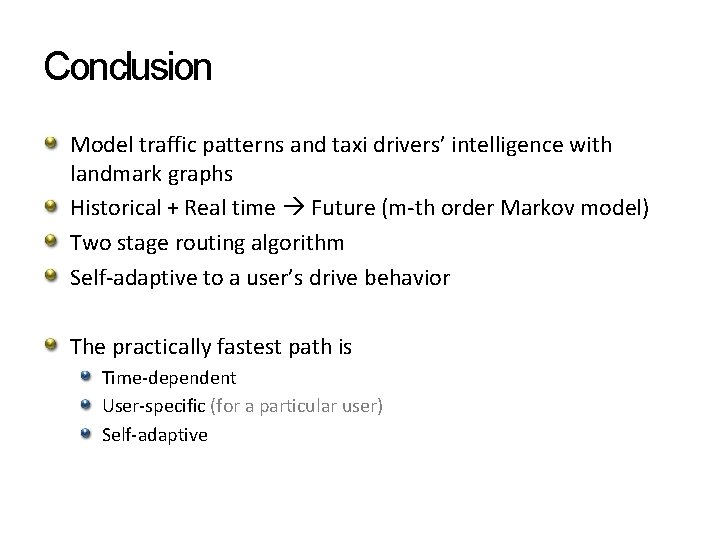
Conclusion Model traffic patterns and taxi drivers’ intelligence with landmark graphs Historical + Real time Future (m-th order Markov model) Two stage routing algorithm Self-adaptive to a user’s drive behavior The practically fastest path is Time-dependent User-specific (for a particular user) Self-adaptive
Released Datasets: T-Drive: taxi trajectories Geo. Life: user-generated GPS trajectories Thanks! Yu Zheng yuzheng@microsoft. com