Designing high performance IO for SQL Server Thomas





- Slides: 81

Designing high performance I/O for SQL Server Thomas Kejser / Mike Ruthruff SQL Server Customer Advisory Team Microsoft Corporation

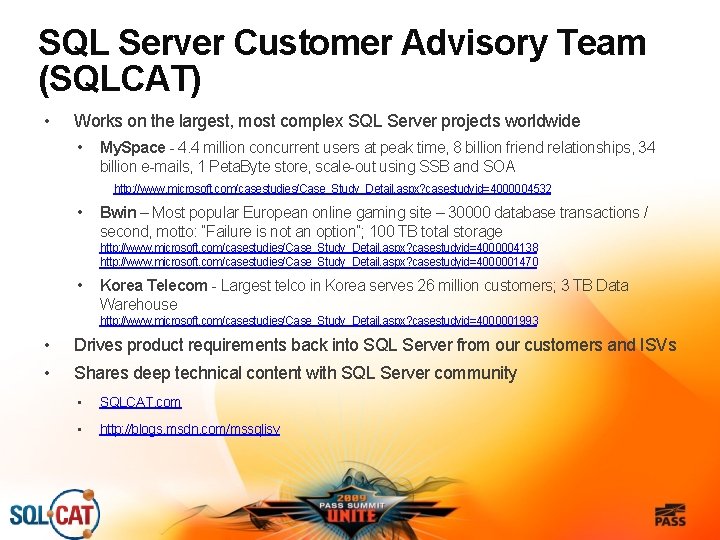
SQL Server Customer Advisory Team (SQLCAT) • Works on the largest, most complex SQL Server projects worldwide • My. Space - 4. 4 million concurrent users at peak time, 8 billion friend relationships, 34 billion e-mails, 1 Peta. Byte store, scale-out using SSB and SOA http: //www. microsoft. com/casestudies/Case_Study_Detail. aspx? casestudyid=4000004532 • Bwin – Most popular European online gaming site – 30000 database transactions / second, motto: “Failure is not an option”; 100 TB total storage http: //www. microsoft. com/casestudies/Case_Study_Detail. aspx? casestudyid=4000004138 http: //www. microsoft. com/casestudies/Case_Study_Detail. aspx? casestudyid=4000001470 • Korea Telecom - Largest telco in Korea serves 26 million customers; 3 TB Data Warehouse http: //www. microsoft. com/casestudies/Case_Study_Detail. aspx? casestudyid=4000001993 • • Drives product requirements back into SQL Server from our customers and ISVs Shares deep technical content with SQL Server community • SQLCAT. com • http: //blogs. msdn. com/mssqlisv

SQLCAT and SQL CSS Invite You… • To the SQL Server Clinic where the most experienced SQL Server experts in the world will be waiting to talk with you. • Bring your toughest Questions / Challenges to the experts who have seen it all • Architect and Design your future applications with experts who have done it before with some of the largest, most complex systems in the world • Or just stop in to say hello! ROOM 611

SQL Server Design Win Program • Target the most challenging and innovative SQL Server applications • 10+ TB DW, 3 k/tran/s OLTP, Large 500 GB+ Cubes, Competitive migrations, Complex deployments, Server Consolidation (1000+) • Invest in large scale, referenceable SQL Server projects across the world • Provide SQLCAT technical & project experience • Conduct architecture and design reviews covering performance, operation, scalability and availability • Offer use of HW lab in Redmond with direct access to SQL Server development team • Work with Marketing Team Developing PR

Agenda • • • What is an I/O? Deployment Considerations & Best Practices • Typical SAN challenges • Typical DAS challenges • DAS vs. SAN Sizing & Tuning Practices • What to monitor • Benchmarking • For Random I/O (aka: Tuning for IOPS) • • SSD Examples For aggregate throughput (aka: Tuning for MB/sec) I/O Characteristics by Workload • OLTP • DW and SSAS SQL Server Best Practices

Designing high performance I/O for SQL Server WHAT IS AN I/O?

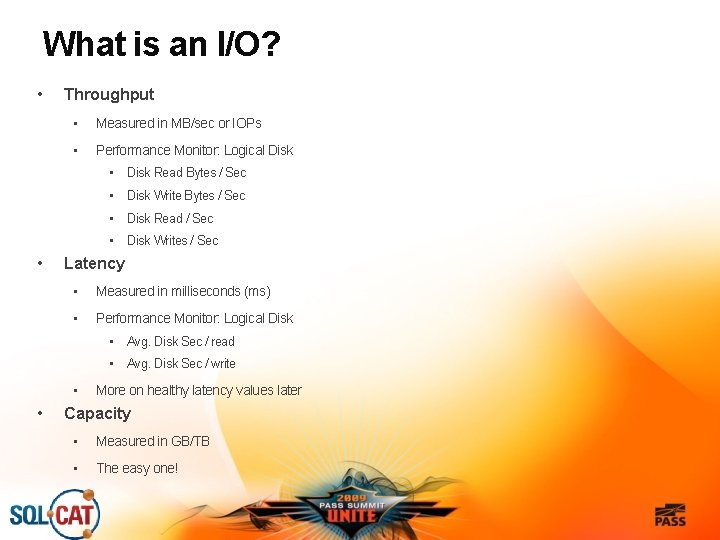
What is an I/O? • Throughput • Measured in MB/sec or IOPs • Performance Monitor: Logical Disk • Disk Read Bytes / Sec • Disk Write Bytes / Sec • Disk Read / Sec • Disk Writes / Sec • Latency • Measured in milliseconds (ms) • Performance Monitor: Logical Disk • Avg. Disk Sec / read • Avg. Disk Sec / write • • More on healthy latency values later Capacity • Measured in GB/TB • The easy one!

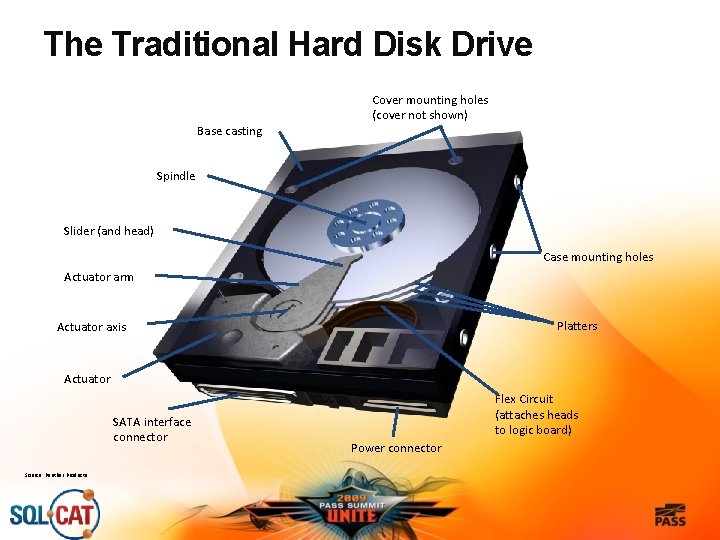
The Traditional Hard Disk Drive Base casting Cover mounting holes (cover not shown) Spindle Slider (and head) Case mounting holes Actuator arm Platters Actuator axis Actuator SATA interface connector Source: Panther Products Flex Circuit (attaches heads to logic board) Power connector

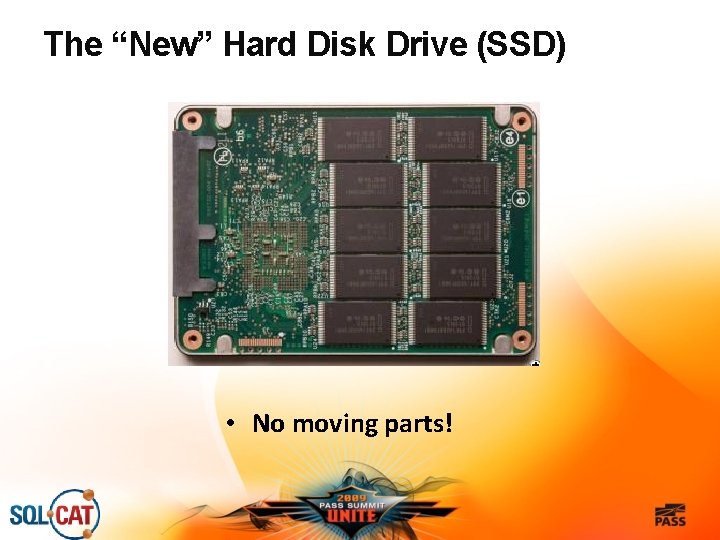
The “New” Hard Disk Drive (SSD) • No moving parts!

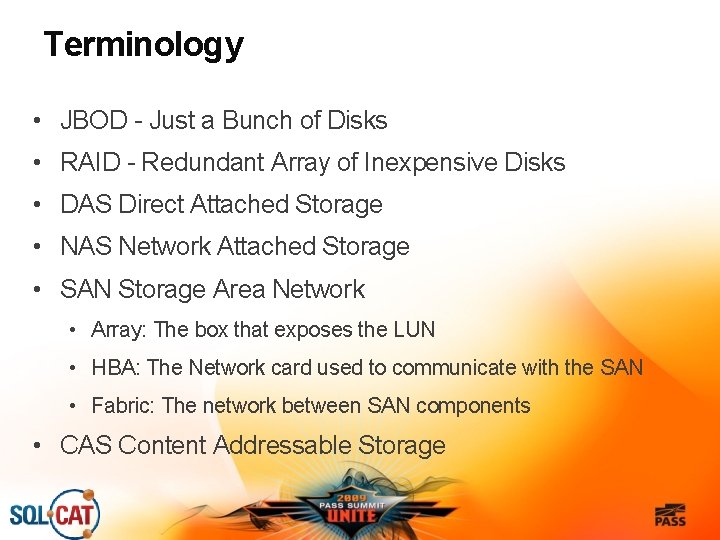
Terminology • JBOD - Just a Bunch of Disks • RAID - Redundant Array of Inexpensive Disks • DAS Direct Attached Storage • NAS Network Attached Storage • SAN Storage Area Network • Array: The box that exposes the LUN • HBA: The Network card used to communicate with the SAN • Fabric: The network between SAN components • CAS Content Addressable Storage

Designing high performance I/O for SQL Server DEPLOYMENT CONSIDERATIONS & BEST PRACTICES

Storage Selection - General • Number of drives matter • More drives typically yield better speed • True for both SAN and DAS • . . . Less so for SSD, but still relevant (especially for NAND) • If designing for performance, make sure the topology can handle it • Understand the path to the drives • Best Practice: Validate and compare configurations prior to deployment • Always run SQLIO or IOMeter to test

Storage Selection – General Pitfalls • There are organizational barriers between DBA’s and storage administrators • • Each needs to understand the others “world” Share storage environments • • At the disk level and other shared components (i. e. service processors, cache, etc…) Sizing only on “capacity” is a common problem • • Key Takeaway: Take latency and throughput requirements (MB/s, IOPs and max latency) into consideration when sizing storage One size fits all type configurations • Storage vendor should have knowledge of SQL Server and Windows best practices when array is configured • Especially when advanced features are used (snapshots, replication, etc…)

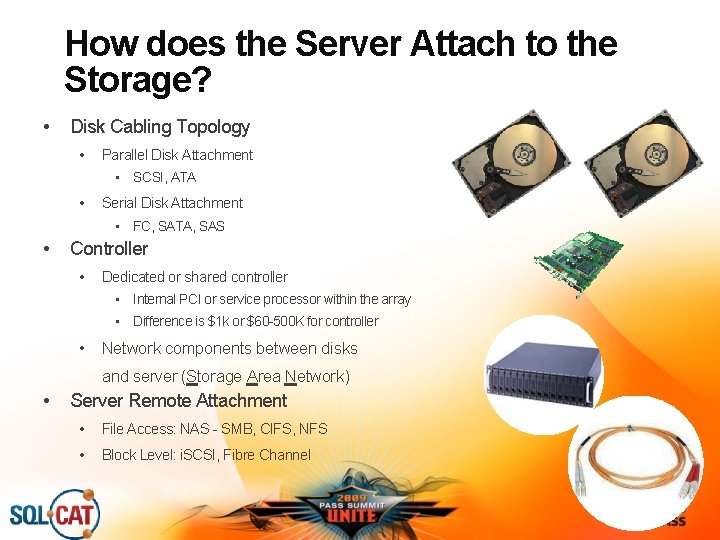
How does the Server Attach to the Storage? • • Disk Cabling Topology • Parallel Disk Attachment • SCSI, ATA • Serial Disk Attachment • FC, SATA, SAS Controller • Dedicated or shared controller • Internal PCI or service processor within the array • Difference is $1 k or $60 -500 K for controller • Network components between disks and server (Storage Area Network) • Server Remote Attachment • File Access: NAS - SMB, CIFS, NFS • Block Level: i. SCSI, Fibre Channel

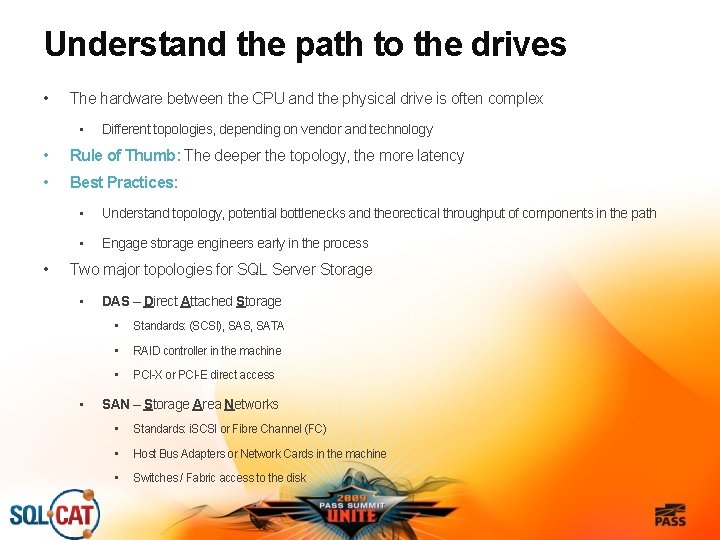
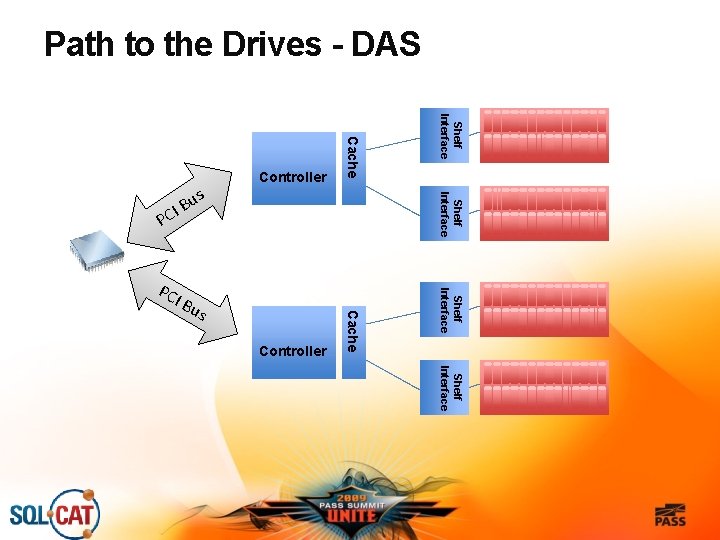
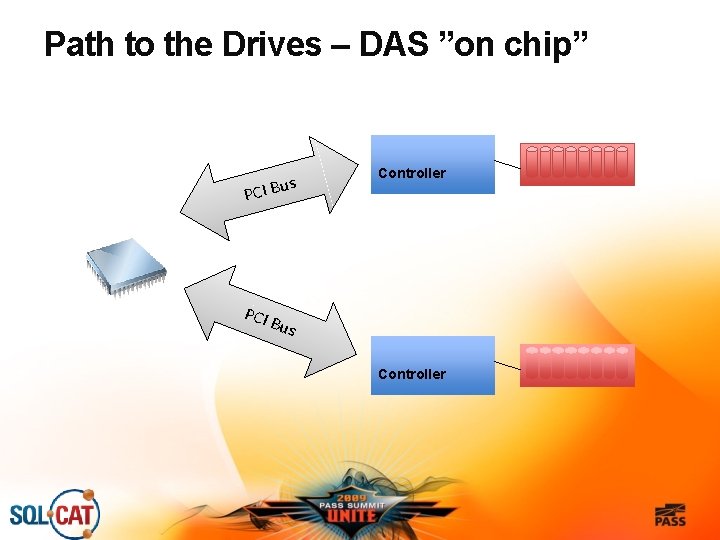
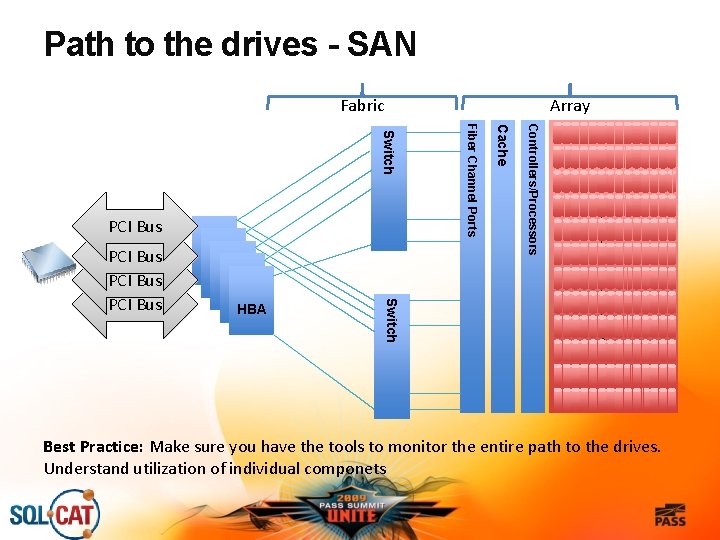
Understand the path to the drives • The hardware between the CPU and the physical drive is often complex • Different topologies, depending on vendor and technology • Rule of Thumb: The deeper the topology, the more latency • Best Practices: • • Understand topology, potential bottlenecks and theorectical throughput of components in the path • Engage storage engineers early in the process Two major topologies for SQL Server Storage • • DAS – Direct Attached Storage • Standards: (SCSI), SAS, SATA • RAID controller in the machine • PCI-X or PCI-E direct access SAN – Storage Area Networks • Standards: i. SCSI or Fibre Channel (FC) • Host Bus Adapters or Network Cards in the machine • Switches / Fabric access to the disk

Path to the Drives - DAS Shelf Interface Cache Controller us B I PC Controller IB us PC Shelf Interface

Path to the Drives – DAS ”on chip” s CI Bu Controller P PCI Bus Controller

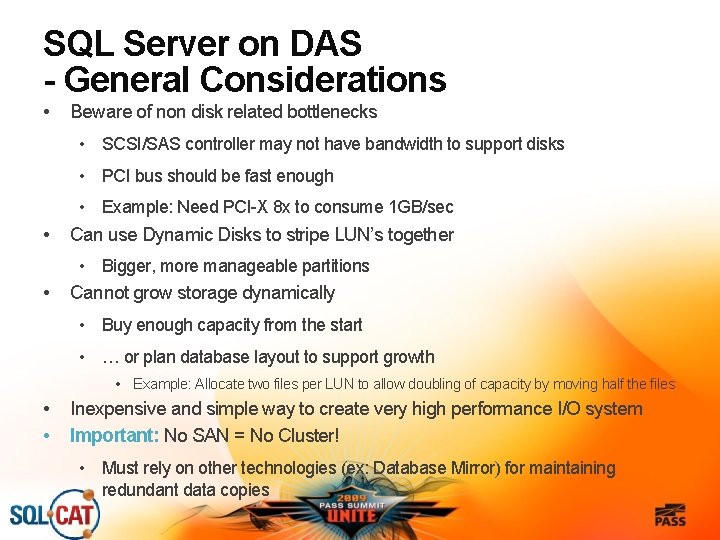
SQL Server on DAS - General Considerations • Beware of non disk related bottlenecks • SCSI/SAS controller may not have bandwidth to support disks • PCI bus should be fast enough • • Example: Need PCI-X 8 x to consume 1 GB/sec Can use Dynamic Disks to stripe LUN’s together • • Bigger, more manageable partitions Cannot grow storage dynamically • Buy enough capacity from the start • … or plan database layout to support growth • Example: Allocate two files per LUN to allow doubling of capacity by moving half the files • • Inexpensive and simple way to create very high performance I/O system Important: No SAN = No Cluster! • Must rely on other technologies (ex: Database Mirror) for maintaining redundant data copies

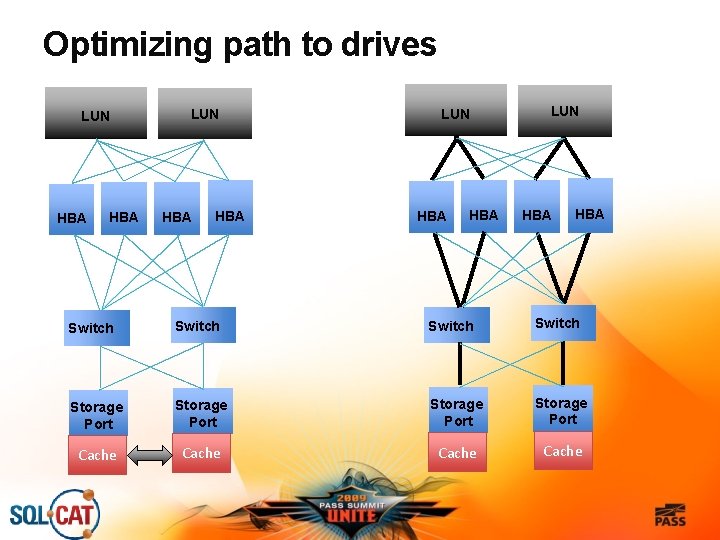
Path to the drives - SAN Fabric Controllers/Processors Cache HBA Switch PCI Bus Fiber Channel Ports Switch PCI Bus Array Best Practice: Make sure you have the tools to monitor the entire path to the drives. Understand utilization of individual componets

SQL Server on SAN - General Considerations • • Storage technologies are evolving rapidly and traditional best practices may not apply to all configurations Physical isolation practices become more important at the high end • High volume OLTP, large scale DW • Isolation of HBA to storage ports can yield big benefits • • • This largely remains true for SAN although some vendors claim it is not needed There is no one single “right” way to configure storage for SQL Server on SAN deployment can be complex • • • Generally involves multiple organizations to put a configuration in place Storage ports will often be bottleneck for DW workloads Understanding paths to the disks becomes even more important and complex

SQL Server on SAN - Common Pitfalls • • Sizing on capacity Assuming physical design does not matter on SAN • • Basic configuration best practices have not been followed Lack of knowledge about physical configuration and the potential bottlenecks or expected limits of configuration • Makes it hard to tell if performance is reasonable on the configuration • Array controller or bandwidth of the connection is often the bottleneck • Key Takeaway: Bottleneck is not always the disk No (or incomplete) monitoring strategy or baseline to compare against • • Over estimating the benefit of array cache Capture counters that provide the entire picture (see monitoring section) Overestimating the ability of the SAN or array • Overutilization of shared storage

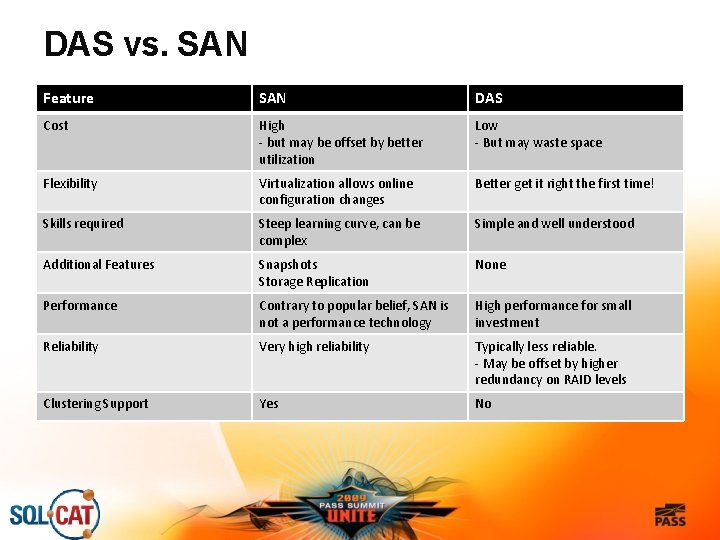
DAS vs. SAN Feature SAN DAS Cost High - but may be offset by better utilization Low - But may waste space Flexibility Virtualization allows online configuration changes Better get it right the first time! Skills required Steep learning curve, can be complex Simple and well understood Additional Features Snapshots Storage Replication None Performance Contrary to popular belief, SAN is not a performance technology High performance for small investment Reliability Very high reliability Typically less reliable. - May be offset by higher redundancy on RAID levels Clustering Support Yes No

Designing high performance I/O for SQL Server SIZING AND TUNING

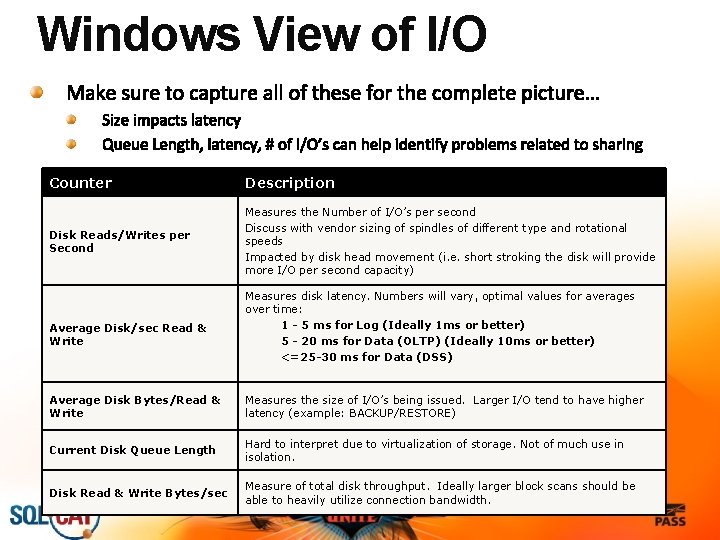
Windows View of I/O Counter Description Disk Reads/Writes per Second Measures the Number of I/O’s per second Discuss with vendor sizing of spindles of different type and rotational speeds Impacted by disk head movement (i. e. short stroking the disk will provide more I/O per second capacity) Average Disk/sec Read & Write Measures disk latency. Numbers will vary, optimal values for averages over time: 1 - 5 ms for Log (Ideally 1 ms or better) 5 - 20 ms for Data (OLTP) (Ideally 10 ms or better) <=25 -30 ms for Data (DSS) Average Disk Bytes/Read & Write Measures the size of I/O’s being issued. Larger I/O tend to have higher latency (example: BACKUP/RESTORE) Current Disk Queue Length Hard to interpret due to virtualization of storage. Not of much use in isolation. Disk Read & Write Bytes/sec Measure of total disk throughput. Ideally larger block scans should be able to heavily utilize connection bandwidth.

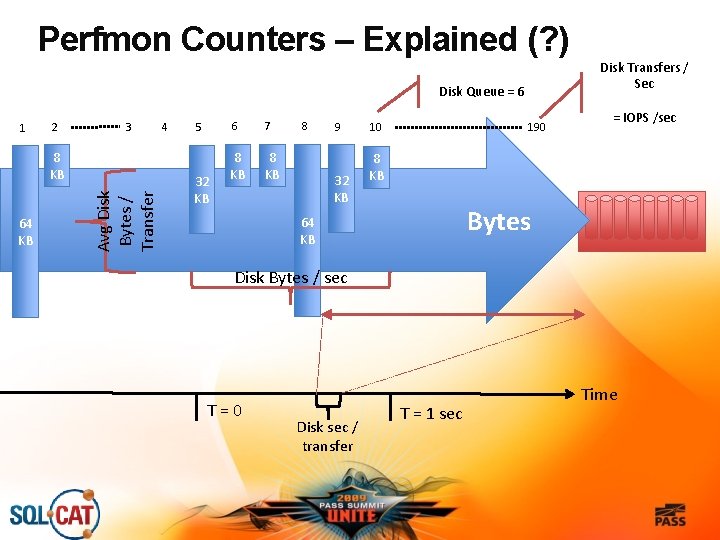
Perfmon Counters – Explained (? ) Disk Transfers / Sec Disk Queue = 6 1 2 3 64 KB Avg Disk Bytes / Transfer 8 KB 4 5 32 KB 6 7 8 KB 8 9 32 KB 10 190 = IOPS /sec 8 KB Bytes 64 KB Disk Bytes / sec T=0 Disk sec / transfer T = 1 sec Time

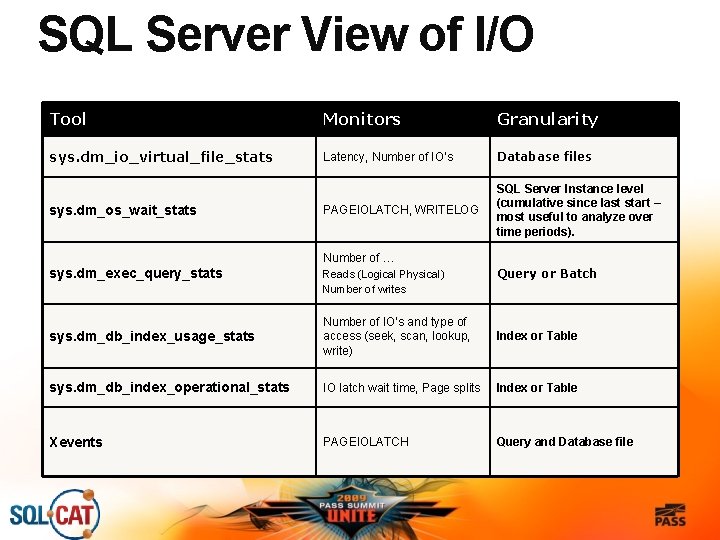
SQL Server View of I/O Tool Monitors Granularity sys. dm_io_virtual_file_stats Latency, Number of IO’s Database files PAGEIOLATCH, WRITELOG SQL Server Instance level (cumulative since last start – most useful to analyze over time periods). sys. dm_os_wait_stats Number of … sys. dm_exec_query_stats Reads (Logical Physical) Number of writes Query or Batch sys. dm_db_index_usage_stats Number of IO’s and type of access (seek, scan, lookup, write) Index or Table sys. dm_db_index_operational_stats IO latch wait time, Page splits Index or Table Xevents PAGEIOLATCH Query and Database file

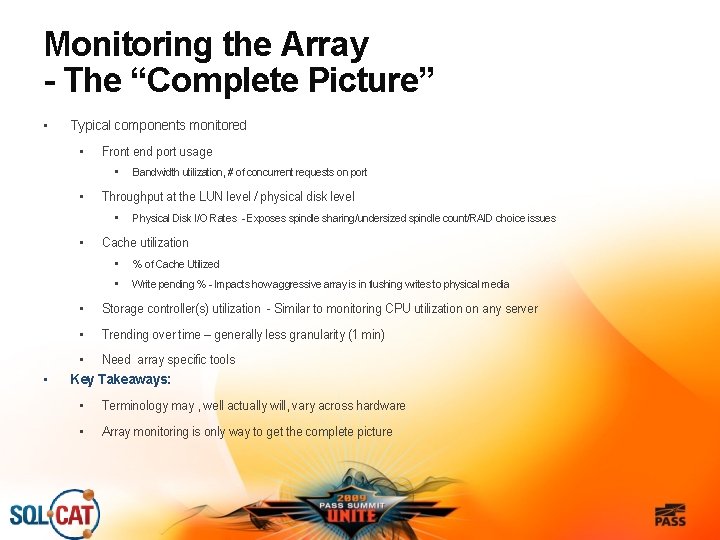
Monitoring the Array - The “Complete Picture” • Typical components monitored • Front end port usage • • Throughput at the LUN level / physical disk level • • • Bandwidth utilization, # of concurrent requests on port Physical Disk I/O Rates - Exposes spindle sharing/undersized spindle count/RAID choice issues Cache utilization • % of Cache Utilized • Write pending % - Impacts how aggressive array is in flushing writes to physical media • Storage controller(s) utilization - Similar to monitoring CPU utilization on any server • Trending over time – generally less granularity (1 min) • Need array specific tools Key Takeaways: • Terminology may , well actually will, vary across hardware • Array monitoring is only way to get the complete picture

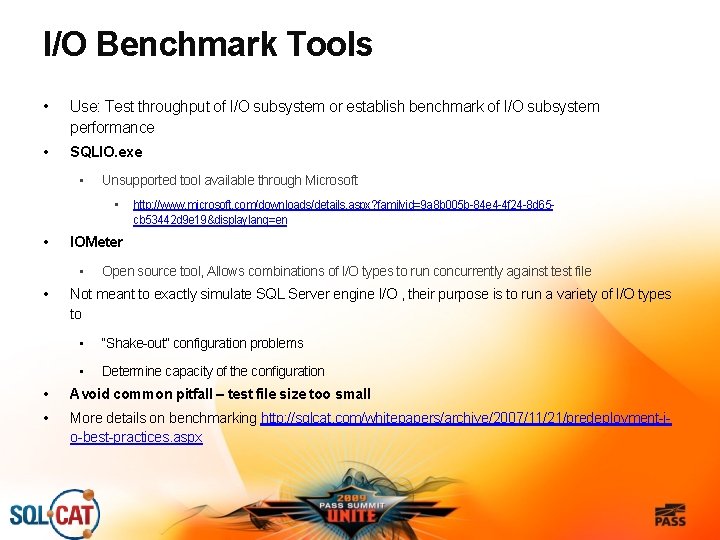
I/O Benchmark Tools • Use: Test throughput of I/O subsystem or establish benchmark of I/O subsystem performance • SQLIO. exe • Unsupported tool available through Microsoft • • IOMeter • • http: //www. microsoft. com/downloads/details. aspx? familyid=9 a 8 b 005 b-84 e 4 -4 f 24 -8 d 65 cb 53442 d 9 e 19&displaylang=en Open source tool, Allows combinations of I/O types to run concurrently against test file Not meant to exactly simulate SQL Server engine I/O , their purpose is to run a variety of I/O types to • “Shake-out” configuration problems • Determine capacity of the configuration • Avoid common pitfall – test file size too small • More details on benchmarking http: //sqlcat. com/whitepapers/archive/2007/11/21/predeployment-io-best-practices. aspx

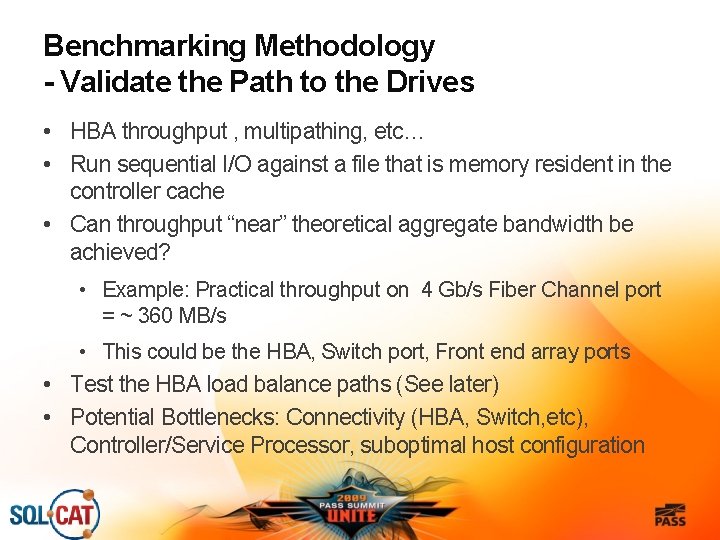
Benchmarking Methodology - Validate the Path to the Drives • HBA throughput , multipathing, etc… • Run sequential I/O against a file that is memory resident in the controller cache • Can throughput “near” theoretical aggregate bandwidth be achieved? • Example: Practical throughput on 4 Gb/s Fiber Channel port = ~ 360 MB/s • This could be the HBA, Switch port, Front end array ports • Test the HBA load balance paths (See later) • Potential Bottlenecks: Connectivity (HBA, Switch, etc), Controller/Service Processor, suboptimal host configuration

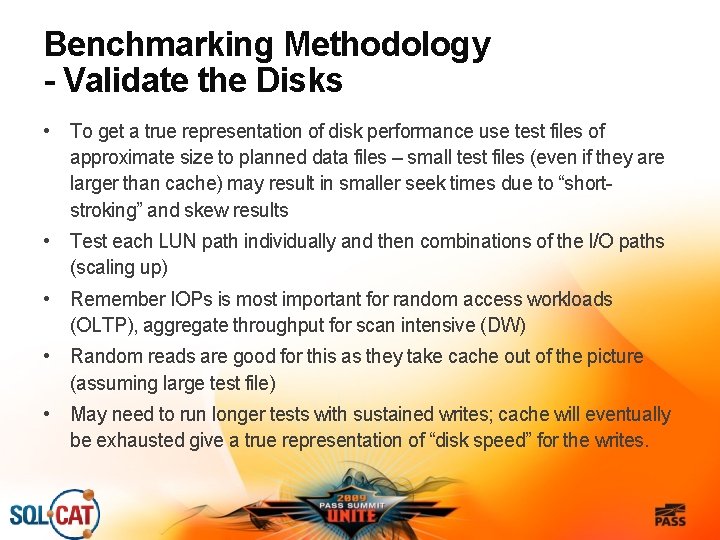
Benchmarking Methodology - Validate the Disks • To get a true representation of disk performance use test files of approximate size to planned data files – small test files (even if they are larger than cache) may result in smaller seek times due to “shortstroking” and skew results • Test each LUN path individually and then combinations of the I/O paths (scaling up) • Remember IOPs is most important for random access workloads (OLTP), aggregate throughput for scan intensive (DW) • Random reads are good for this as they take cache out of the picture (assuming large test file) • May need to run longer tests with sustained writes; cache will eventually be exhausted give a true representation of “disk speed” for the writes.

Benchmarking Methodology - Workload Patterns • Test a variety of I/O types and sizes • Run tests for a reasonable period of time • caching may behave differently after long period of sustained I/O • Relatively short tests are okay for read tests with low read cache • For write-back caches, make sure you run test long enough to measure the destaging of the cache. • Allow time in between tests to allow the hardware to reset (cache flush) • Keep all of the benchmark data to refer to after the SQL implementation has taken place • Maximum throughput (IOPS or MB/s) has been obtained when latency continues to increase while throughput is near constant

I/O Sizing for SQL Server - OLTP • Do: Base sizing on spindle count needed to support the IOPs requirements with healthy latencies • Don’t: Size on capacity • Spindle count rule of thumb • • 10 K RPM – 100 -130 IOPs at ‘full stroke’ • 15 K RPM – 150 -180 IOPs at ‘full stroke’ • Can achieve 2 x or more when ‘short stroking’ the disks (using less than 20% capacity of the physical spindle) • These are for random 8 K I/O Remember the RAID level impact on writes (2 x RAID 10, 4 x RAID 5) • Cache hit rates or ability of cache to absorb writes may improve these numbers • RAID 5 may benefit from larger I/O Size’s

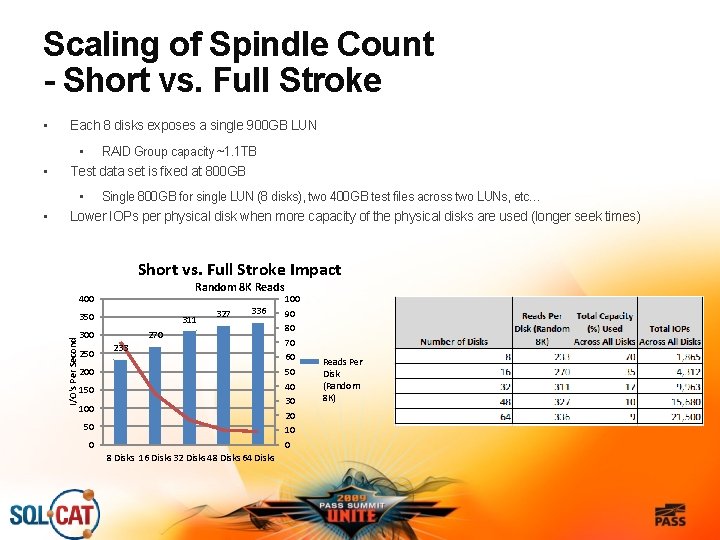
Scaling of Spindle Count - Short vs. Full Stroke • Each 8 disks exposes a single 900 GB LUN • • RAID Group capacity ~1. 1 TB Test data set is fixed at 800 GB • • Single 800 GB for single LUN (8 disks), two 400 GB test files across two LUNs, etc… Lower IOPs per physical disk when more capacity of the physical disks are used (longer seek times) Short vs. Full Stroke Impact Random 8 K Reads 400 I/O's Per Second 350 311 270 300 250 327 336 233 200 150 100 50 0 8 Disks 16 Disks 32 Disks 48 Disks 64 Disks 100 90 80 70 60 50 40 30 20 10 0 Reads Per Disk (Random 8 K)

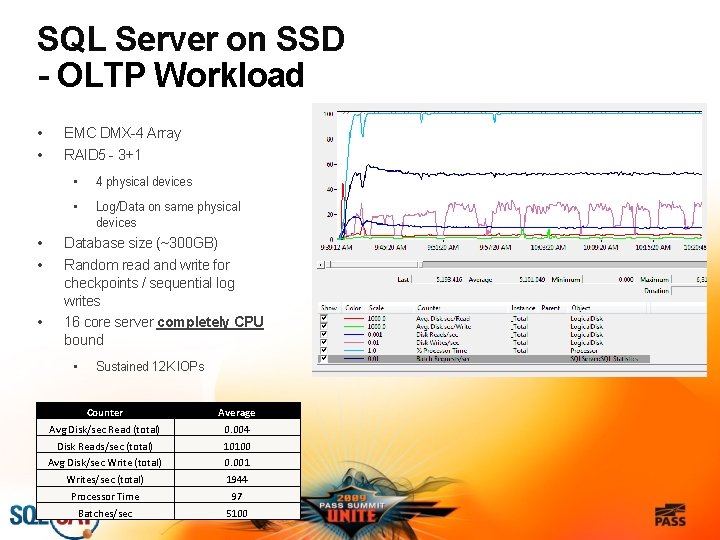
SQL Server on SSD - OLTP Workload • • • EMC DMX-4 Array RAID 5 - 3+1 • 4 physical devices • Log/Data on same physical devices Database size (~300 GB) Random read and write for checkpoints / sequential log writes 16 core server completely CPU bound • Sustained 12 K IOPs Counter Average Avg Disk/sec Read (total) 0. 004 Disk Reads/sec (total) 10100 Avg Disk/sec Write (total) 0. 001 Writes/sec (total) 1944 Processor Time 97 Batches/sec 5100

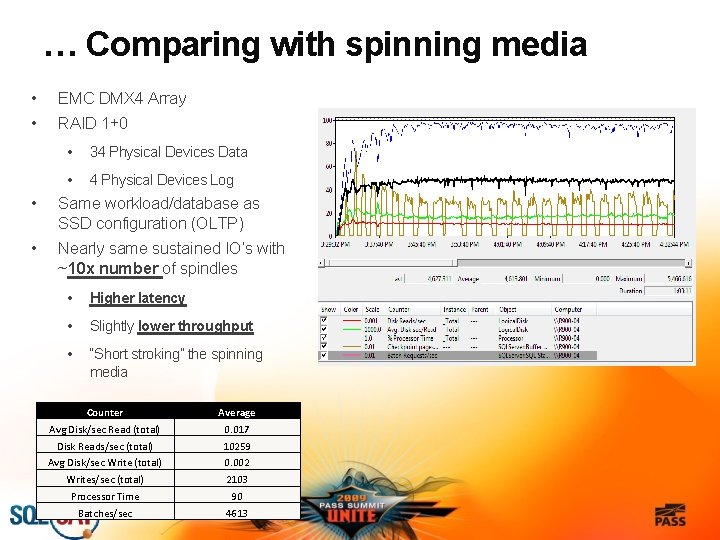
… Comparing with spinning media • • EMC DMX 4 Array RAID 1+0 • 34 Physical Devices Data • 4 Physical Devices Log Same workload/database as SSD configuration (OLTP) Nearly same sustained IO’s with ~10 x number of spindles • Higher latency • Slightly lower throughput • “Short stroking” the spinning media Counter Average Avg Disk/sec Read (total) 0. 017 Disk Reads/sec (total) 10259 Avg Disk/sec Write (total) 0. 002 Writes/sec (total) 2103 Processor Time 90 Batches/sec 4613

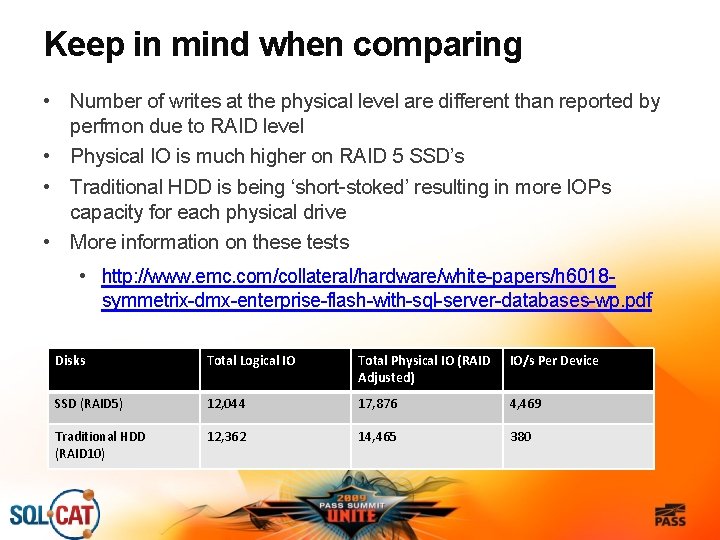
Keep in mind when comparing • Number of writes at the physical level are different than reported by perfmon due to RAID level • Physical IO is much higher on RAID 5 SSD’s • Traditional HDD is being ‘short-stoked’ resulting in more IOPs capacity for each physical drive • More information on these tests • http: //www. emc. com/collateral/hardware/white-papers/h 6018 symmetrix-dmx-enterprise-flash-with-sql-server-databases-wp. pdf Disks Total Logical IO Total Physical IO (RAID Adjusted) IO/s Per Device SSD (RAID 5) 12, 044 17, 876 4, 469 Traditional HDD (RAID 10) 12, 362 14, 465 380

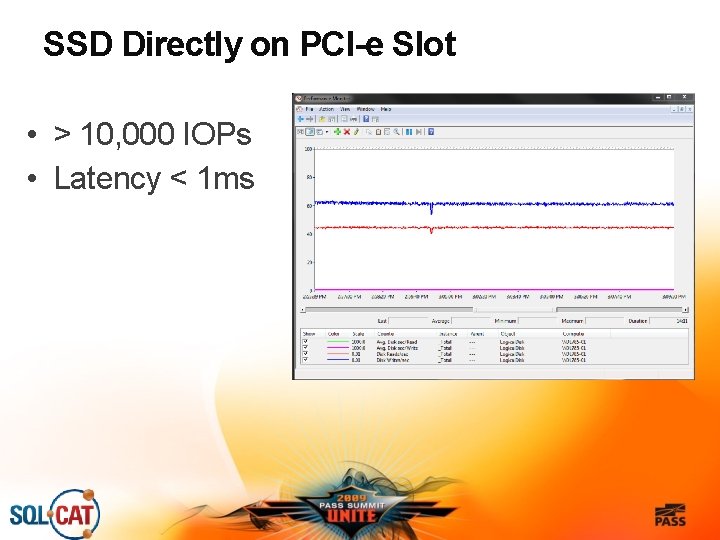
SSD Directly on PCI-e Slot • > 10, 000 IOPs • Latency < 1 ms

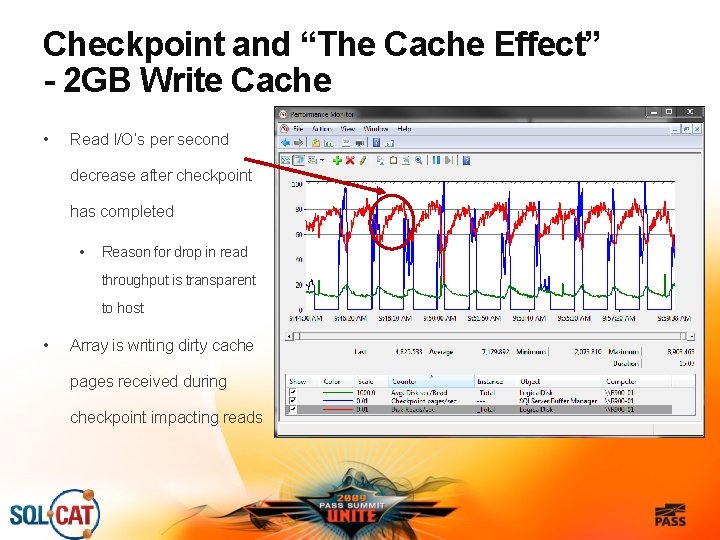
Checkpoint and “The Cache Effect” - 2 GB Write Cache • Read I/O’s per second decrease after checkpoint has completed • Reason for drop in read throughput is transparent to host • Array is writing dirty cache pages received during checkpoint impacting reads

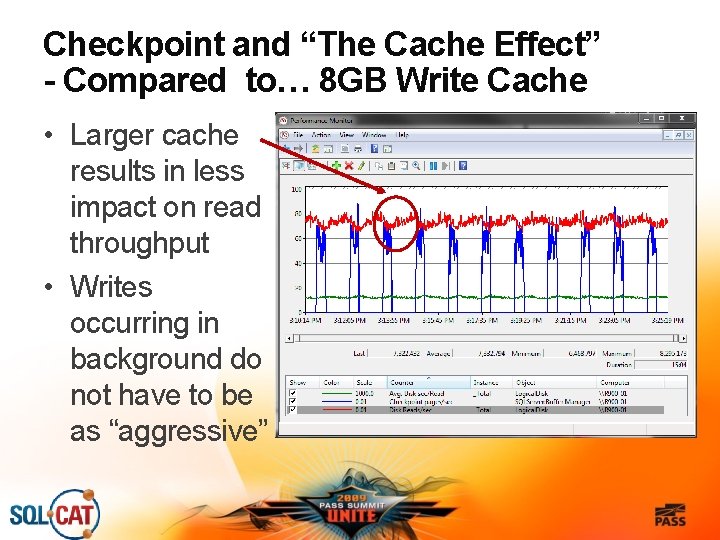
Checkpoint and “The Cache Effect” - Compared to… 8 GB Write Cache • Larger cache results in less impact on read throughput • Writes occurring in background do not have to be as “aggressive”

I/O Sizing for SQL Server - DW • Do: Size on the aggregate throughput requirements • Don’t: Only consider the number of spindles needed for this – other components are often the bottleneck (controllers, switches, HBA’s, etc…) • Ensure there is adequate bandwidth (very important for sequential I/O workloads) • Know the limits of your path (HBA’s, switch ports, array ports) • 320 -360 MB/s Observed/practical throughput (per 4 Gb/s HBA) • Consider aggregate connectivity limits (host -> switch -> array) • Consider service processor or controller limits • Often, disabling read cache or using it for readahead gives best performance

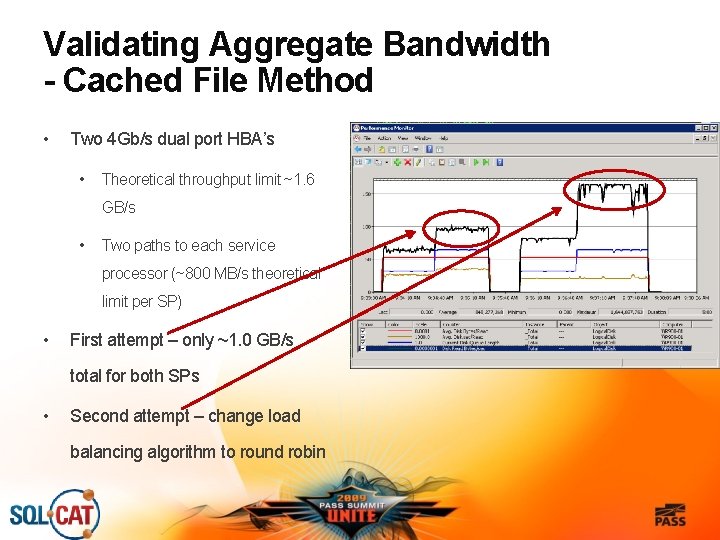
Validating Aggregate Bandwidth - Cached File Method • Two 4 Gb/s dual port HBA’s • Theoretical throughput limit ~1. 6 GB/s • Two paths to each service processor (~800 MB/s theoretical limit per SP) • First attempt – only ~1. 0 GB/s total for both SPs • Second attempt – change load balancing algorithm to round robin

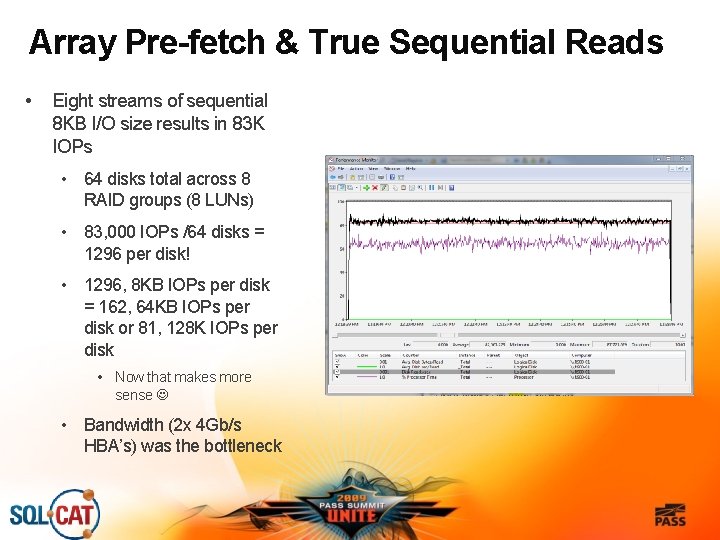
Array Pre-fetch & True Sequential Reads • Eight streams of sequential 8 KB I/O size results in 83 K IOPs • 64 disks total across 8 RAID groups (8 LUNs) • 83, 000 IOPs /64 disks = 1296 per disk! • 1296, 8 KB IOPs per disk = 162, 64 KB IOPs per disk or 81, 128 K IOPs per disk • Now that makes more sense • Bandwidth (2 x 4 Gb/s HBA’s) was the bottleneck

Optimizing path to drives LUN HBA HBA Switch Storage Port Cache

Designing high performance I/O for SQL Server I/O CHARACTERISTICS BY WORKLOAD TYPE

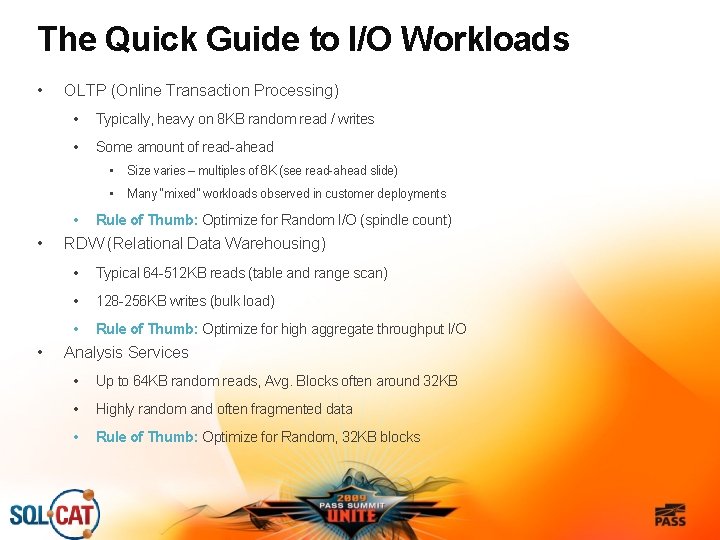
The Quick Guide to I/O Workloads • OLTP (Online Transaction Processing) • Typically, heavy on 8 KB random read / writes • Some amount of read-ahead • Size varies – multiples of 8 K (see read-ahead slide) • Many “mixed” workloads observed in customer deployments • • • Rule of Thumb: Optimize for Random I/O (spindle count) RDW (Relational Data Warehousing) • Typical 64 -512 KB reads (table and range scan) • 128 -256 KB writes (bulk load) • Rule of Thumb: Optimize for high aggregate throughput I/O Analysis Services • Up to 64 KB random reads, Avg. Blocks often around 32 KB • Highly random and often fragmented data • Rule of Thumb: Optimize for Random, 32 KB blocks

Designing high performance I/O for SQL Server OLTP WORKLOADS

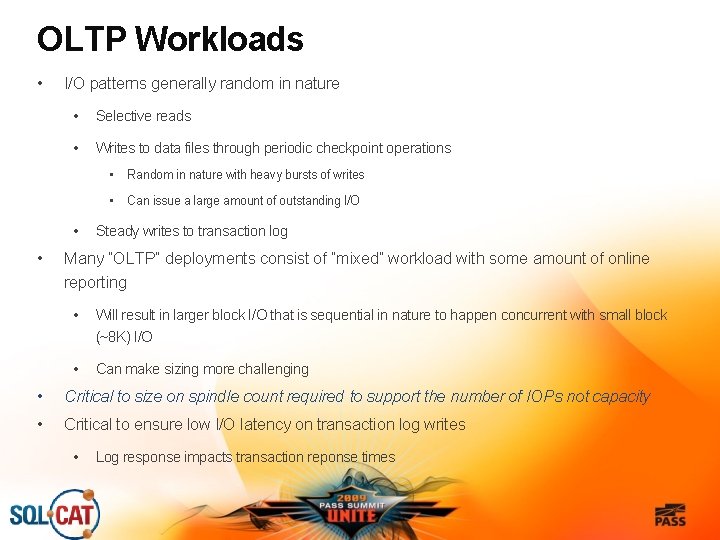
OLTP Workloads • I/O patterns generally random in nature • Selective reads • Writes to data files through periodic checkpoint operations • Random in nature with heavy bursts of writes • Can issue a large amount of outstanding I/O • • Steady writes to transaction log Many ”OLTP” deployments consist of ”mixed” workload with some amount of online reporting • Will result in larger block I/O that is sequential in nature to happen concurrent with small block (~8 K) I/O • Can make sizing more challenging • Critical to size on spindle count required to support the number of IOPs not capacity • Critical to ensure low I/O latency on transaction log writes • Log response impacts transaction reponse times

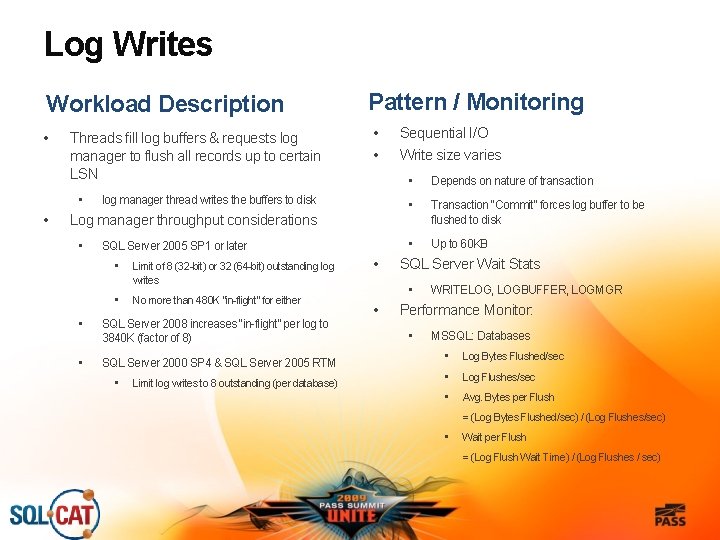
Log Writes Workload Description • Threads fill log buffers & requests log manager to flush all records up to certain LSN • • Pattern / Monitoring • • log manager thread writes the buffers to disk Log manager throughput considerations • SQL Server 2005 SP 1 or later • Limit of 8 (32 -bit) or 32 (64 -bit) outstanding log writes • No more than 480 K “in-flight” for either • SQL Server 2008 increases “in-flight” per log to 3840 K (factor of 8) • SQL Server 2000 SP 4 & SQL Server 2005 RTM • Limit log writes to 8 outstanding (per database) • Sequential I/O Write size varies • Depends on nature of transaction • Transaction “Commit” forces log buffer to be flushed to disk • Up to 60 KB SQL Server Wait Stats • • WRITELOG, LOGBUFFER, LOGMGR Performance Monitor: • MSSQL: Databases • Log Bytes Flushed/sec • Log Flushes/sec • Avg. Bytes per Flush = (Log Bytes Flushed/sec) / (Log Flushes/sec) • Wait per Flush = (Log Flush Wait Time) / (Log Flushes / sec)

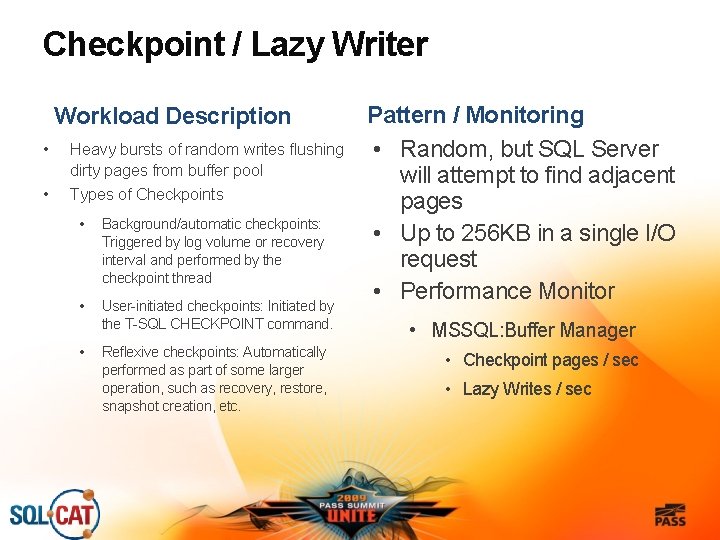
Checkpoint / Lazy Writer Workload Description • • Heavy bursts of random writes flushing dirty pages from buffer pool Types of Checkpoints • Background/automatic checkpoints: Triggered by log volume or recovery interval and performed by the checkpoint thread • User-initiated checkpoints: Initiated by the T-SQL CHECKPOINT command. • Reflexive checkpoints: Automatically performed as part of some larger operation, such as recovery, restore, snapshot creation, etc. Pattern / Monitoring • Random, but SQL Server will attempt to find adjacent pages • Up to 256 KB in a single I/O request • Performance Monitor • MSSQL: Buffer Manager • Checkpoint pages / sec • Lazy Writes / sec

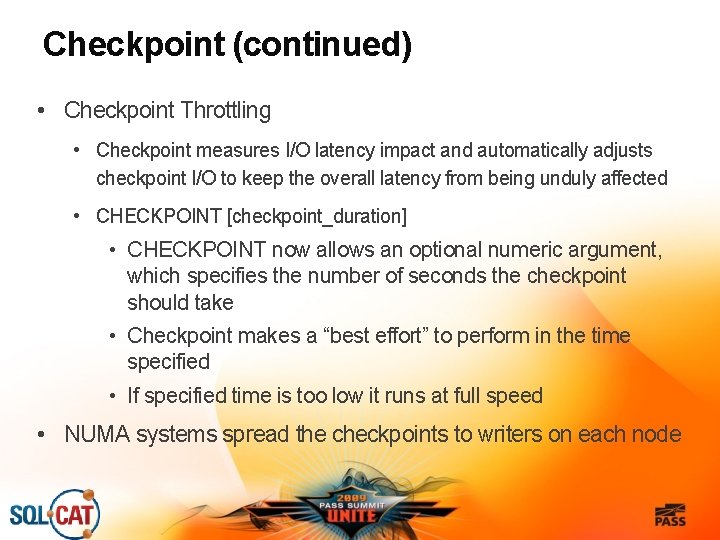
Checkpoint (continued) • Checkpoint Throttling • Checkpoint measures I/O latency impact and automatically adjusts checkpoint I/O to keep the overall latency from being unduly affected • CHECKPOINT [checkpoint_duration] • CHECKPOINT now allows an optional numeric argument, which specifies the number of seconds the checkpoint should take • Checkpoint makes a “best effort” to perform in the time specified • If specified time is too low it runs at full speed • NUMA systems spread the checkpoints to writers on each node

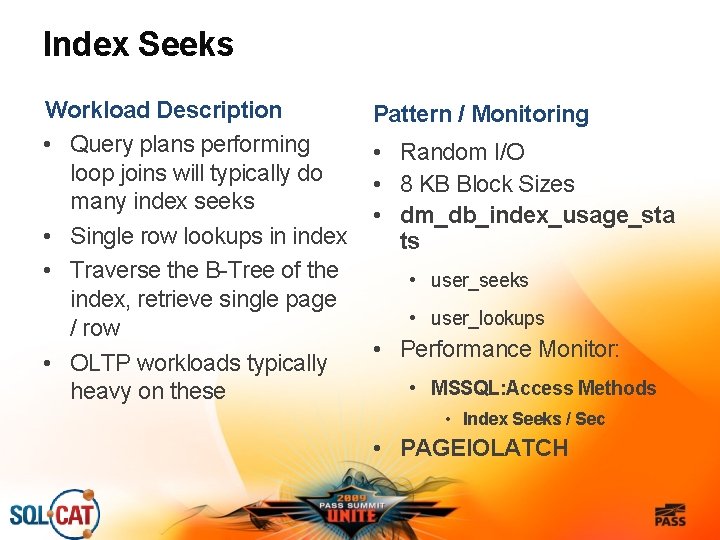
Index Seeks Workload Description • Query plans performing loop joins will typically do many index seeks • Single row lookups in index • Traverse the B-Tree of the index, retrieve single page / row • OLTP workloads typically heavy on these Pattern / Monitoring • Random I/O • 8 KB Block Sizes • dm_db_index_usage_sta ts • user_seeks • user_lookups • Performance Monitor: • MSSQL: Access Methods • Index Seeks / Sec • PAGEIOLATCH

Designing high performance IO for SQL Server DW AND ANALYSIS SERVICES WORKLOADS

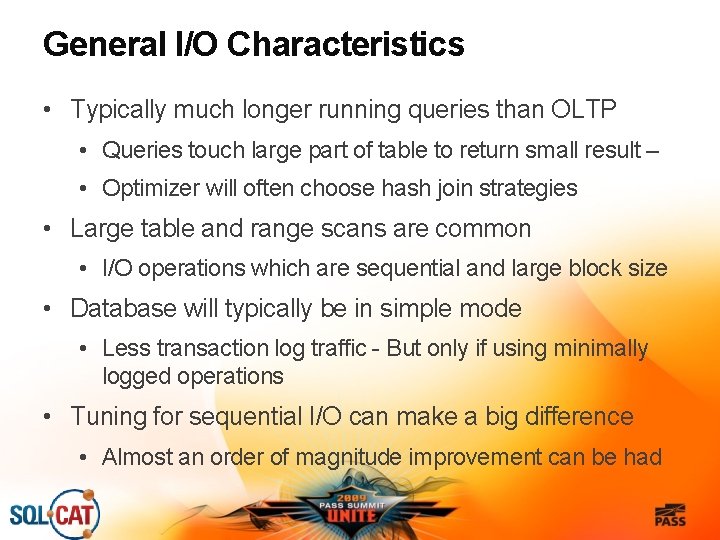
General I/O Characteristics • Typically much longer running queries than OLTP • Queries touch large part of table to return small result – • Optimizer will often choose hash join strategies • Large table and range scans are common • I/O operations which are sequential and large block size • Database will typically be in simple mode • Less transaction log traffic - But only if using minimally logged operations • Tuning for sequential I/O can make a big difference • Almost an order of magnitude improvement can be had

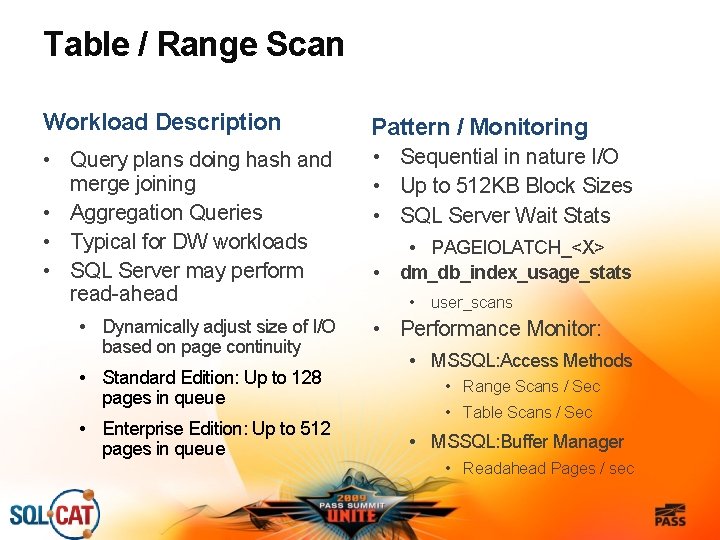
Table / Range Scan Workload Description Pattern / Monitoring • Query plans doing hash and merge joining • Aggregation Queries • Typical for DW workloads • SQL Server may perform read-ahead • Sequential in nature I/O • Up to 512 KB Block Sizes • SQL Server Wait Stats • Dynamically adjust size of I/O based on page continuity • Standard Edition: Up to 128 pages in queue • Enterprise Edition: Up to 512 pages in queue • • PAGEIOLATCH_<X> dm_db_index_usage_stats • user_scans • Performance Monitor: • MSSQL: Access Methods • Range Scans / Sec • Table Scans / Sec • MSSQL: Buffer Manager • Readahead Pages / sec

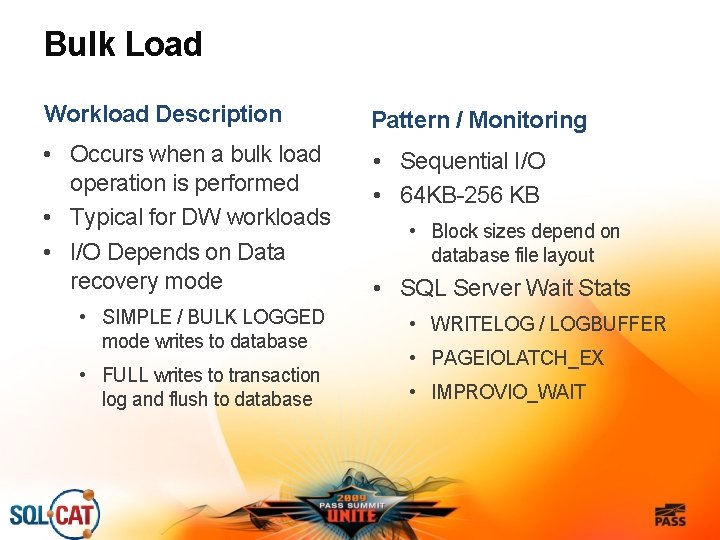
Bulk Load Workload Description Pattern / Monitoring • Occurs when a bulk load operation is performed • Typical for DW workloads • I/O Depends on Data recovery mode • Sequential I/O • 64 KB-256 KB • Block sizes depend on database file layout • SQL Server Wait Stats • SIMPLE / BULK LOGGED mode writes to database • WRITELOG / LOGBUFFER • FULL writes to transaction log and flush to database • IMPROVIO_WAIT • PAGEIOLATCH_EX

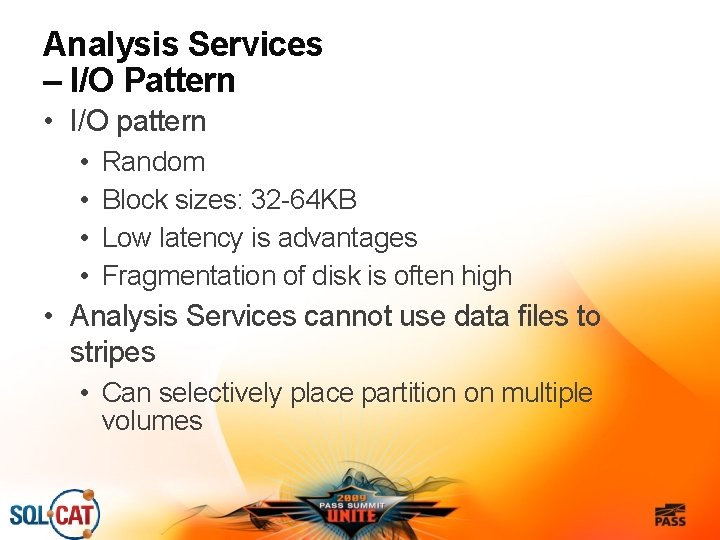
Analysis Services – I/O Pattern • I/O pattern • • Random Block sizes: 32 -64 KB Low latency is advantages Fragmentation of disk is often high • Analysis Services cannot use data files to stripes • Can selectively place partition on multiple volumes

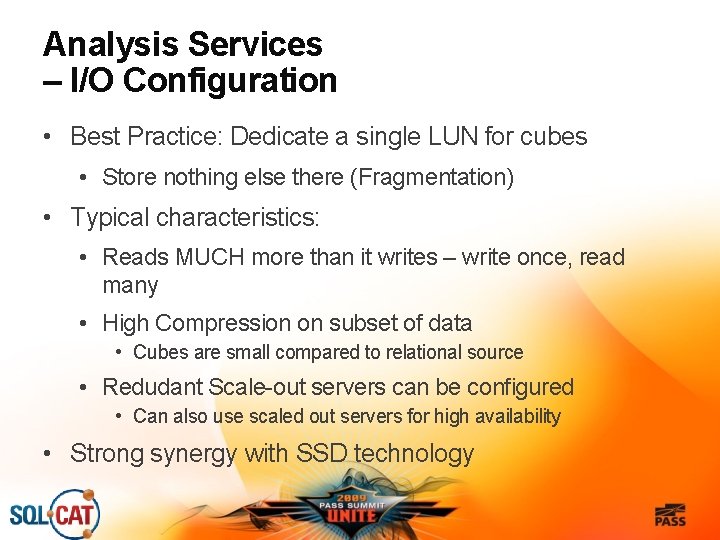
Analysis Services – I/O Configuration • Best Practice: Dedicate a single LUN for cubes • Store nothing else there (Fragmentation) • Typical characteristics: • Reads MUCH more than it writes – write once, read many • High Compression on subset of data • Cubes are small compared to relational source • Redudant Scale-out servers can be configured • Can also use scaled out servers for high availability • Strong synergy with SSD technology

Designing high performance I/O for SQL Server SQL SERVER BEST PRACTICES

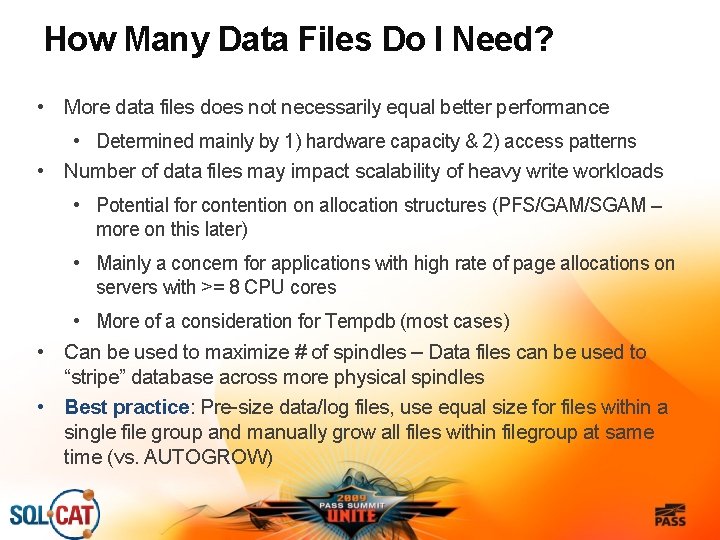
How Many Data Files Do I Need? • More data files does not necessarily equal better performance • Determined mainly by 1) hardware capacity & 2) access patterns • Number of data files may impact scalability of heavy write workloads • Potential for contention on allocation structures (PFS/GAM/SGAM – more on this later) • Mainly a concern for applications with high rate of page allocations on servers with >= 8 CPU cores • More of a consideration for Tempdb (most cases) • Can be used to maximize # of spindles – Data files can be used to “stripe” database across more physical spindles • Best practice: Pre-size data/log files, use equal size for files within a single file group and manually grow all files within filegroup at same time (vs. AUTOGROW)

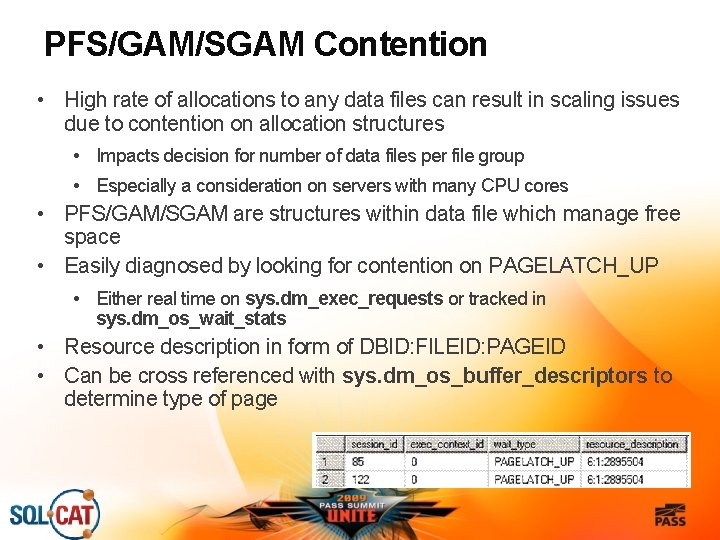
PFS/GAM/SGAM Contention • High rate of allocations to any data files can result in scaling issues due to contention on allocation structures • Impacts decision for number of data files per file group • Especially a consideration on servers with many CPU cores • PFS/GAM/SGAM are structures within data file which manage free space • Easily diagnosed by looking for contention on PAGELATCH_UP • Either real time on sys. dm_exec_requests or tracked in sys. dm_os_wait_stats • Resource description in form of DBID: FILEID: PAGEID • Can be cross referenced with sys. dm_os_buffer_descriptors to determine type of page

Why Should I Avoid a Single File per Filegroup for Large Databases? • Provides less flexibility with respect to mapping data files into differing storage configurations • Multiple files can be used as a mechanism to stripe data across more physical spindles and/or service processors (applies to many small/mid range arrays) • A single file prevents possible optimizations related to file placement of certain objects (relatively uncommon) • Allocations heavy workloads (PFS contention) may incur waits on allocation structures, which are maintained per file.

TEMPDB – A Special Case • Tempdb placement (dedicated vs. shared spindles) • Generally recommended on separate spindles • However, depends on how well you know your workload use of tempdb • In some cases is may be better to place tempdb on spindles shared with data to utilize more cumulative disks • PFS contention is a bigger problem in tempdb • Best Practice: 1 File per CPU Core • Consider using trace flag -T 1118

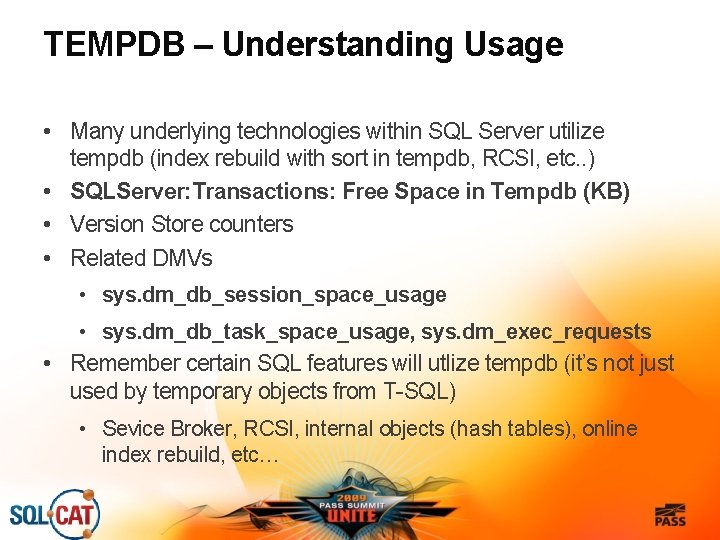
TEMPDB – Understanding Usage • Many underlying technologies within SQL Server utilize tempdb (index rebuild with sort in tempdb, RCSI, etc. . ) • SQLServer: Transactions: Free Space in Tempdb (KB) • Version Store counters • Related DMVs • sys. dm_db_session_space_usage • sys. dm_db_task_space_usage, sys. dm_exec_requests • Remember certain SQL features will utlize tempdb (it’s not just used by temporary objects from T-SQL) • Sevice Broker, RCSI, internal objects (hash tables), online index rebuild, etc…

Designing high performance I/O for SQL Server WINDOWS

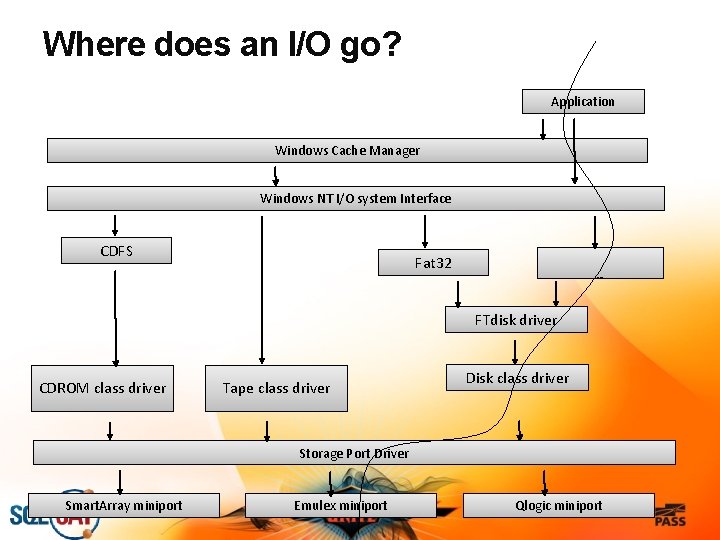
Where does an I/O go? Application Windows Cache Manager Windows NT I/O system Interface CDFS Fat 32 NTFS FTdisk driver CDROM class driver Tape class driver Disk class driver Storage Port Driver Smart. Array miniport Emulex miniport Qlogic miniport

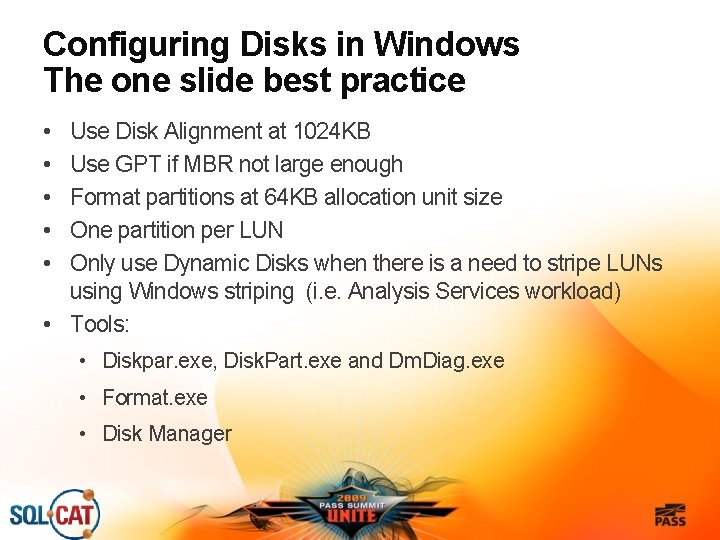
Configuring Disks in Windows The one slide best practice • • • Use Disk Alignment at 1024 KB Use GPT if MBR not large enough Format partitions at 64 KB allocation unit size One partition per LUN Only use Dynamic Disks when there is a need to stripe LUNs using Windows striping (i. e. Analysis Services workload) • Tools: • Diskpar. exe, Disk. Part. exe and Dm. Diag. exe • Format. exe • Disk Manager

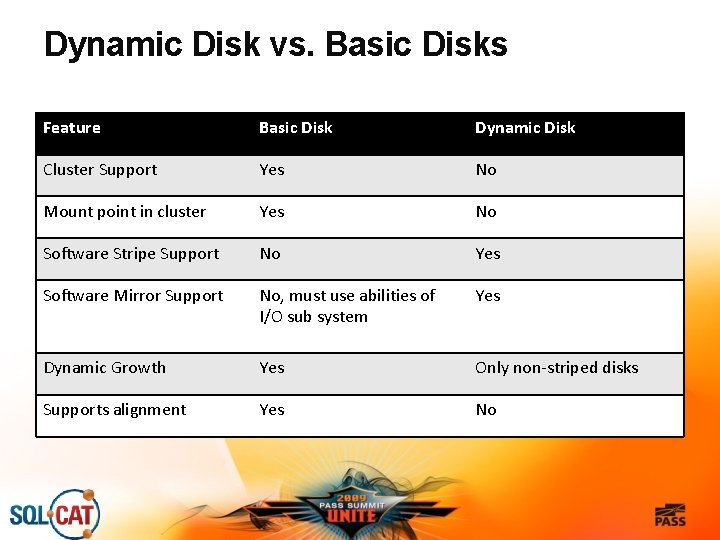
Dynamic Disk vs. Basic Disks Feature Basic Disk Dynamic Disk Cluster Support Yes No Mount point in cluster Yes No Software Stripe Support No Yes Software Mirror Support No, must use abilities of I/O sub system Yes Dynamic Growth Yes Only non-striped disks Supports alignment Yes No

Visit the Microsoft Technical Learning Center Located in the Expo Hall Microsoft Ask the Experts Lounge Microsoft Chalk Theater Presentations Microsoft Partner Village

Thank you for attending this session and the 2009 PASS Summit in Seattle

Designing high performance I/O for SQL Server APPENDIX

Additional Resources • SQL Server I/O Basics • http: //www. microsoft. com/technet/prodtechnol/sql/2000/maintain/sql. IObasics. mspx • http: //www. microsoft. com/technet/prodtechnol/sql/2005/iobasics. mspx • SQL Server Pre. Deployment Best Practices • http: //sqlcat. com/whitepapers/archive/2007/11/21/predeployment-i-o-best-practices. aspx • Disk Partition Alignment Best Practices for SQL Server • http: //sqlcat. com/whitepapers/archive/2009/05/11/disk-partition-alignment-best-practices-for-sqlserver. aspx

FILESTREAM • Writes to varbinary(max) will go through the buffer pool and are flushed during checkpoint • Reads & Writes to FILESTEAM data does not go through the buffer pool (either T-SQL or Win 32) • T-SQL uses buffered access to read & write data • Win 32 can use either buffered or non-buffered • • File. Stream I/O is not tracked via sys. dm_io_virtual_file_stats • • Depends on application use of APIs Best practice to separate on to separate logical volume for monitoring purposes Writes/Generates to FILESTREAM generates less transaction log volume than varbinary(max) • Actual FILESTREAM data is not logged • FILESTREAM data is captured as part of database backup and transaction log backup • May increase throughput capacity of the transaction log • http: //sqlcat. com/technicalnotes/archive/2008/12/09/diagnosing-transaction-log-performance-issues-and-limits-of-the-log-manager. aspx

Backup / Restore • Backup and restore operations utilize internal buffers for the data being read/written • Number of buffers is determined by: • The number of data file volumes • The number of backup devices • Or by explicitly setting BUFFERCOUNT • If database files are spread across are a few (or a single) logical volume(s), and there a few (or a single) output device(s) optimal performance may not be achievable by default • Tuning can be achieved by using the BUFFERCOUNT parameter for BACKUP / RESTORE • More Information: • http: //sqlcat. com/technicalnotes/archive/2008/04/21/tuning-the-performance-of-backupcompression-in-sql-server-2008. aspx

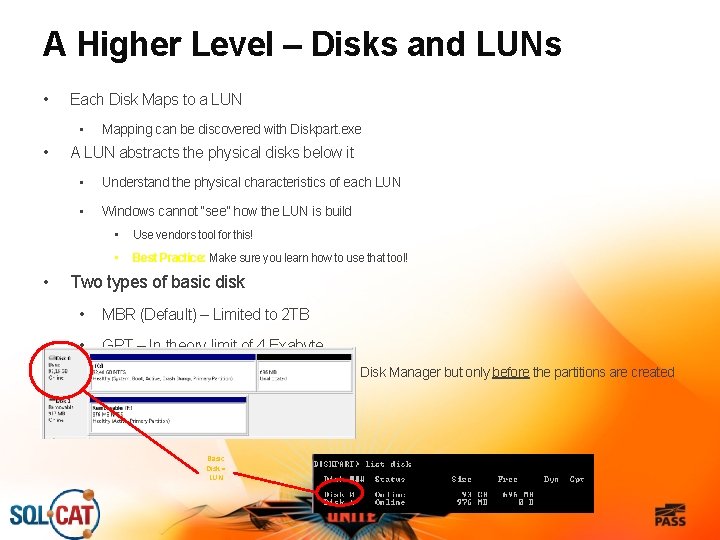
A Higher Level – Disks and LUNs • Each Disk Maps to a LUN • • • Mapping can be discovered with Diskpart. exe A LUN abstracts the physical disks below it • Understand the physical characteristics of each LUN • Windows cannot “see” how the LUN is build • Use vendors tool for this! • Best Practice: Make sure you learn how to use that tool! Two types of basic disk • MBR (Default) – Limited to 2 TB • GPT – In theory limit of 4 Exabyte • You can convert an MBR to GPT using Disk Manager but only before the partitions are created Basic Disk = LUN

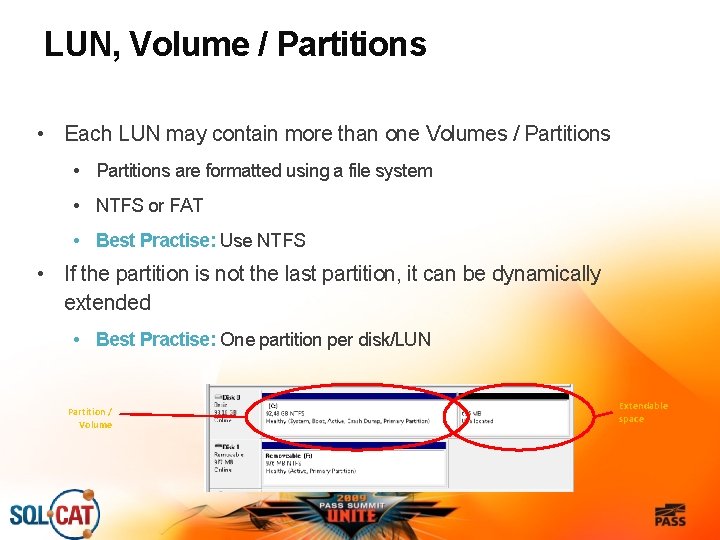
LUN, Volume / Partitions • Each LUN may contain more than one Volumes / Partitions • Partitions are formatted using a file system • NTFS or FAT • Best Practise: Use NTFS • If the partition is not the last partition, it can be dynamically extended • Best Practise: One partition per disk/LUN Partition / Volume Extendable space

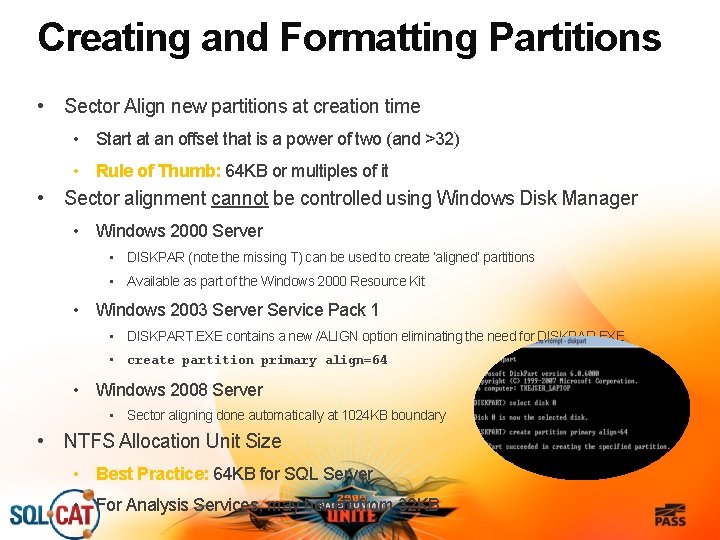
Creating and Formatting Partitions • Sector Align new partitions at creation time • Start at an offset that is a power of two (and >32) • Rule of Thumb: 64 KB or multiples of it • Sector alignment cannot be controlled using Windows Disk Manager • Windows 2000 Server • DISKPAR (note the missing T) can be used to create ‘aligned’ partitions • Available as part of the Windows 2000 Resource Kit • Windows 2003 Server Service Pack 1 • DISKPART. EXE contains a new /ALIGN option eliminating the need for DISKPAR. EXE • create partition primary align=64 • Windows 2008 Server • Sector aligning done automatically at 1024 KB boundary • NTFS Allocation Unit Size • Best Practice: 64 KB for SQL Server • For Analysis Services, may benefit from 32 KB

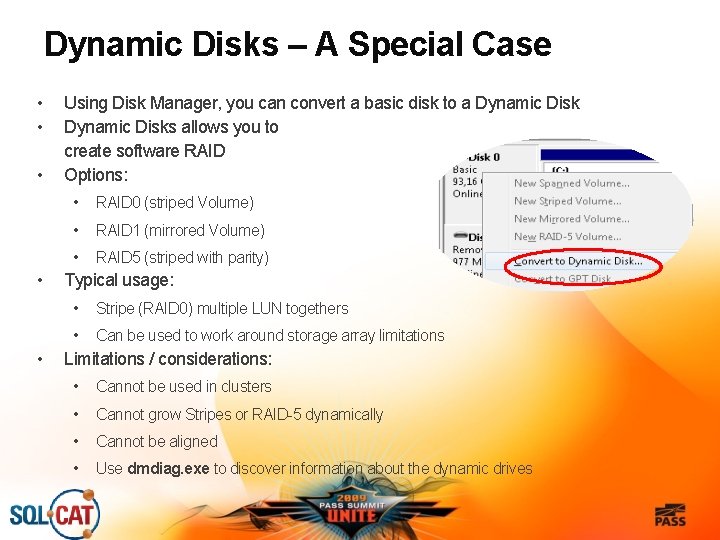
Dynamic Disks – A Special Case • • • Using Disk Manager, you can convert a basic disk to a Dynamic Disks allows you to create software RAID Options: • RAID 0 (striped Volume) • RAID 1 (mirrored Volume) • RAID 5 (striped with parity) Typical usage: • Stripe (RAID 0) multiple LUN togethers • Can be used to work around storage array limitations Limitations / considerations: • Cannot be used in clusters • Cannot grow Stripes or RAID-5 dynamically • Cannot be aligned • Use dmdiag. exe to discover information about the dynamic drives

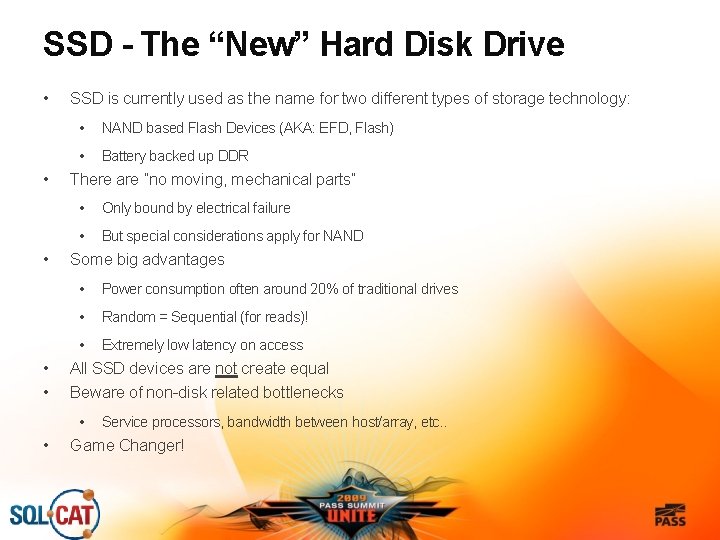
SSD - The “New” Hard Disk Drive • • • SSD is currently used as the name for two different types of storage technology: • NAND based Flash Devices (AKA: EFD, Flash) • Battery backed up DDR There are ”no moving, mechanical parts” • Only bound by electrical failure • But special considerations apply for NAND Some big advantages • Power consumption often around 20% of traditional drives • Random = Sequential (for reads)! • Extremely low latency on access All SSD devices are not create equal Beware of non-disk related bottlenecks • • Service processors, bandwidth between host/array, etc. . Game Changer!

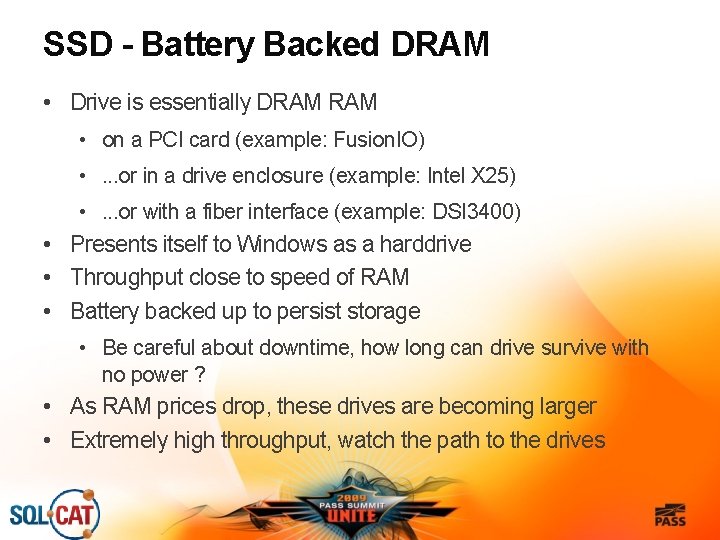
SSD - Battery Backed DRAM • Drive is essentially DRAM • on a PCI card (example: Fusion. IO) • . . . or in a drive enclosure (example: Intel X 25) • . . . or with a fiber interface (example: DSI 3400) • Presents itself to Windows as a harddrive • Throughput close to speed of RAM • Battery backed up to persist storage • Be careful about downtime, how long can drive survive with no power ? • As RAM prices drop, these drives are becoming larger • Extremely high throughput, watch the path to the drives

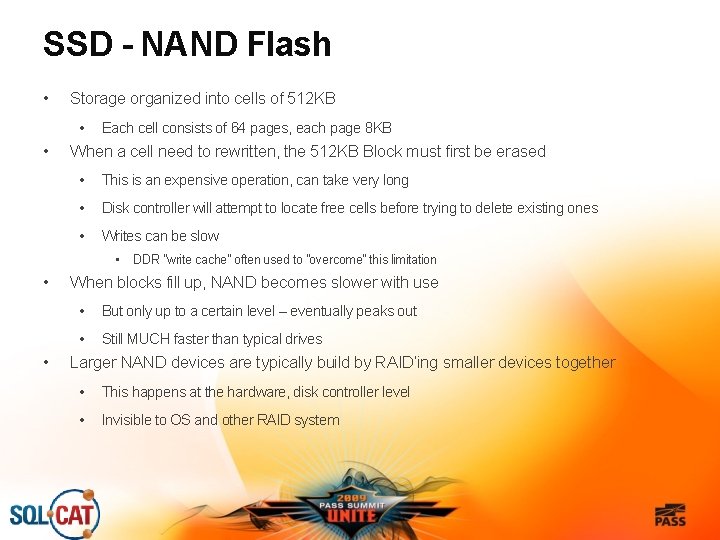
SSD - NAND Flash • Storage organized into cells of 512 KB • • Each cell consists of 64 pages, each page 8 KB When a cell need to rewritten, the 512 KB Block must first be erased • This is an expensive operation, can take very long • Disk controller will attempt to locate free cells before trying to delete existing ones • Writes can be slow • DDR ”write cache” often used to ”overcome” this limitation • • When blocks fill up, NAND becomes slower with use • But only up to a certain level – eventually peaks out • Still MUCH faster than typical drives Larger NAND devices are typically build by RAID’ing smaller devices together • This happens at the hardware, disk controller level • Invisible to OS and other RAID system

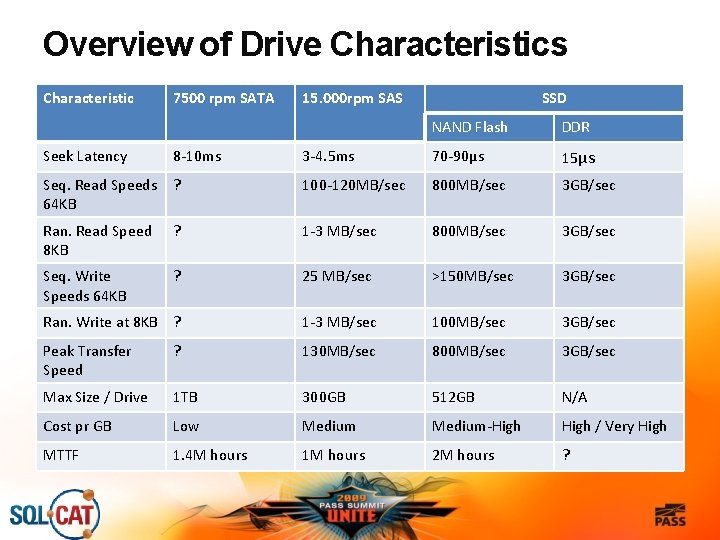
Overview of Drive Characteristics Characteristic 7500 rpm SATA 15. 000 rpm SAS SSD NAND Flash DDR 3 -4. 5 ms 70 -90µs 15µs Seq. Read Speeds ? 64 KB 100 -120 MB/sec 800 MB/sec 3 GB/sec Ran. Read Speed 8 KB ? 1 -3 MB/sec 800 MB/sec 3 GB/sec Seq. Write Speeds 64 KB ? 25 MB/sec >150 MB/sec 3 GB/sec Ran. Write at 8 KB ? 1 -3 MB/sec 100 MB/sec 3 GB/sec Peak Transfer Speed ? 130 MB/sec 800 MB/sec 3 GB/sec Max Size / Drive 1 TB 300 GB 512 GB N/A Cost pr GB Low Medium-High / Very High MTTF 1. 4 M hours 1 M hours 2 M hours ? Seek Latency 8 -10 ms