Microsoft SQL Server 2012 Analysis Services SSAS Reporting
 Reporting Services (SSRS)")


- Slides: 19
Microsoft SQL Server 2012 Analysis Services (SSAS) Reporting Services (SSRS)
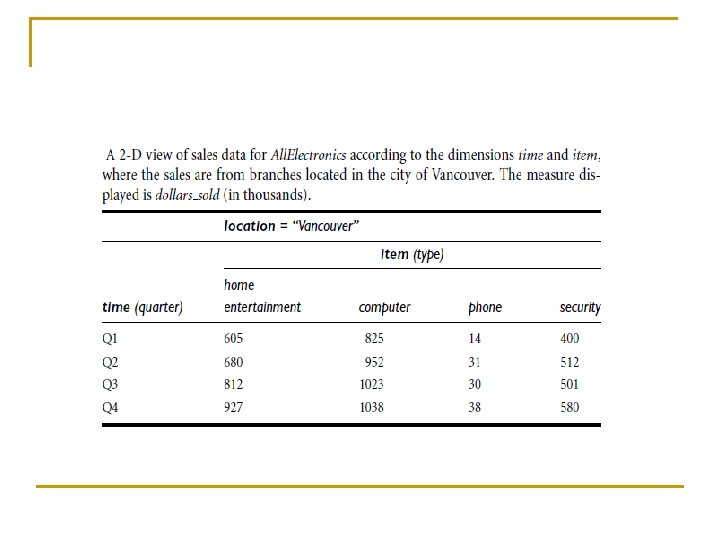
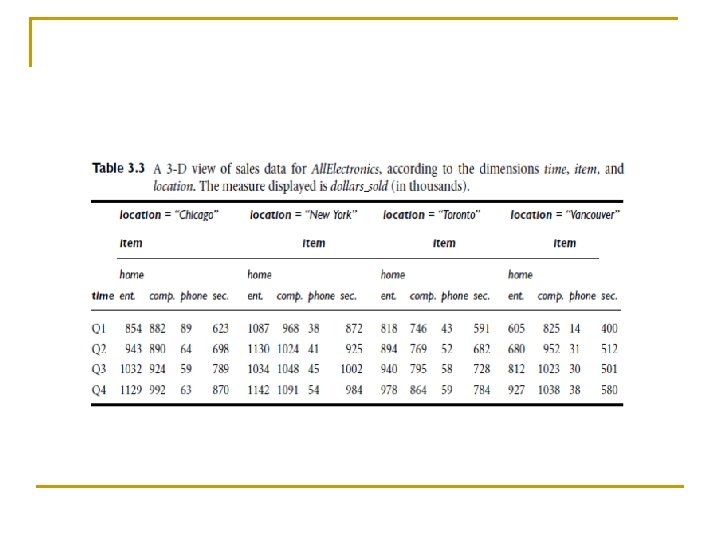
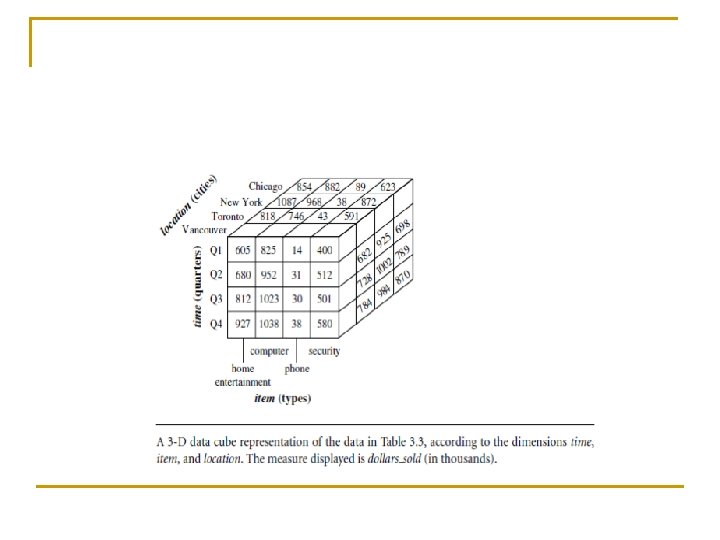
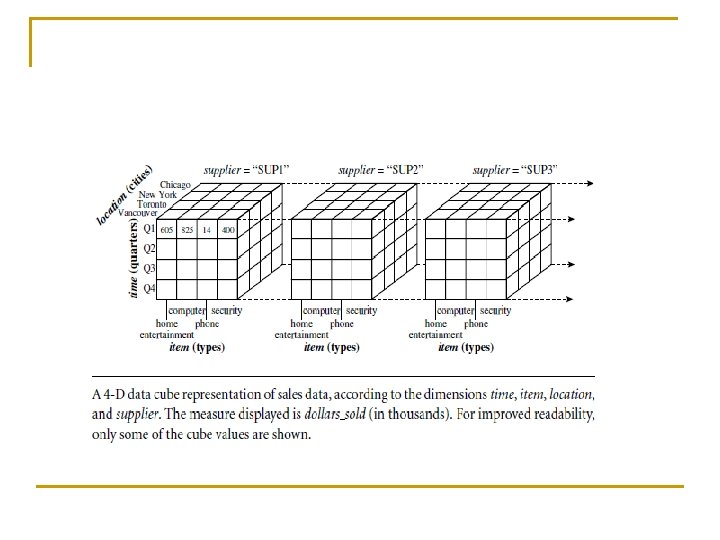
A Multidimensional Data Model n A data cube allows data to be modeled and viewed in multiple dimensions. It is defined by dimensions and facts. n Although we usually think of cubes as 3 -D geometric structures, in data warehousing the data cube is n-dimensional.
Concept Hierarchies n A concept hierarchy defines a sequence of mappings from a set of low-level concepts to higher-level, more general concepts. n Concept hierarchies allow data to be handled at varying levels of abstraction
Concept Hierarchies
Concept Hierarchies - Concept hierarchies may also be defined by discretizing or grouping values for a given dimension or attribute, resulting in a set-grouping hierarchy. A total or partial order can be defined among groups of values. - There may be more than one concept hierarchy for a given attribute or dimension, based on different user viewpoints. For instance, a user may prefer to organize price by defining ranges for inexpensive, moderately priced, and expensive.
OLAP Operations in the Multidimensional Data Model n “How are concept hierarchies useful in OLAP? ” n In the multidimensional model, data are organized into multiple dimensions, and each dimension contains multiple levels of abstraction defined by concept hierarchies. This organization provides users with the flexibility to view data from different perspectives. A number of OLAP data cube operations exist to materialize these different views, allowing interactive querying and analysis of the data at hand. Hence, OLAP provides a user-friendly environment for interactive data analysis.
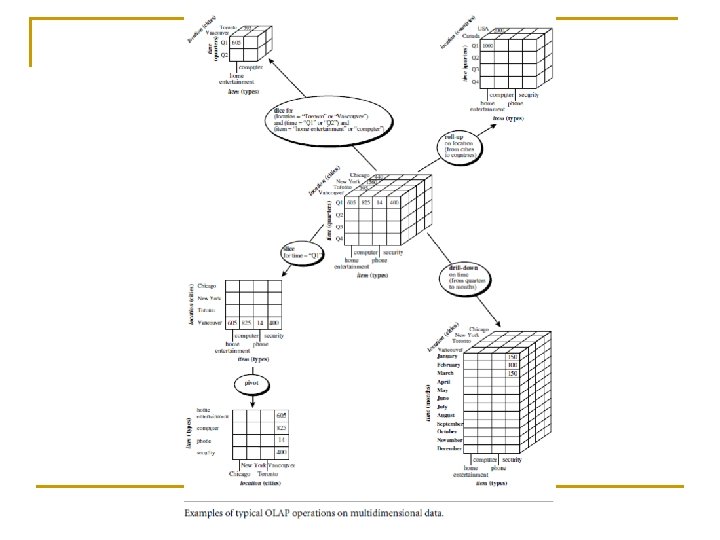
OLAP Operations in the Multidimensional Data Model n Roll-up: The roll-up operation (also called the drill-up operation by some vendors) performs aggregation on a data cube, either by climbing up a concept hierarchy for a dimension or by dimension reduction. Figure (slide 19) shows the result of a roll-up operation performed on the central cube by climbing up the concept hierarchy for location given in Figure 3. 7. This hierarchy was defined as the total order “street < city < province or state < country. ” The roll-up operation shown aggregates the data by ascending the location hierarchy from the level of city to the level of country. In other words, rather than grouping the data by city, the resulting cube groups the data by country. When roll-up is performed by dimension reduction, one or more dimensions are removed from the given cube. For example, consider a sales data cube containing only the two dimensions location and time. Roll-up may be performed by removing, say, the time dimension, resulting in an aggregation of the total sales by location, rather than by location and by time.
OLAP Operations in the Multidimensional Data Model n Drill-down: Drill-down is the reverse of roll-up. It navigates from less detailed data to more detailed data. Drill-down can be realized by either stepping down a concept hierarchy for a dimension or introducing additional dimensions. Figure shows the result of a drill-down operation performed on the central cube by stepping down a concept hierarchy for time defined as “day < month < quarter < year. ” Drill-down occurs by descending the time hierarchy fromthe level of quarter to the more detailed level of month. The resulting data cube details the total sales per month rather than summarizing them by quarter. Because a drilldown adds more detail to the given data, it can also be performed by adding new dimensions to a cube. For example, a drill-down on the central cube of Figure 3. 10 can occur by introducing an additional dimension, such as customer group.
OLAP Operations in the Multidimensional Data Model n Slice and dice: The slice operation performs a selection on one dimension of the given cube, resulting in a subcube. Figure 3. 10 shows a slice operation where the sales data are selected from the central cube for the dimension time using the criterion time = “Q 1”. The dice operation defines a subcube by performing a selection on two or more dimensions. Figure 3. 10 shows a dice operation on the central cube based on the following selection criteria that involve three dimensions: (location = “Toronto” or “Vancouver”) and (time = “Q 1” or “Q 2”) and (item = “home entertainment” or “computer”). n Pivot (rotate): Pivot (also called rotate) is a visualization operation that rotates the data axes in view in order to provide an alternative presentation of the data. Figure shows a pivot operation where the item and location axes in a 2 -D slice are rotated. Other examples include rotating the axes in a 3 -D cube, or transforming a 3 -D cube into a series of 2 -D planes.
OLAP Operations in the Multidimensional Data Model n Other OLAP operations: Some OLAP systems offer additional drilling operations. For example, drill-across executes queries involving (i. e. , across) more than one fact table. The drill-through operation uses relational SQL facilities to drill through the bottom level of a data cube down to its back-end relational tables. n Other OLAP operations may include ranking the top N or bottom N items in lists, as well as computing moving averages, growth rates, interests, internal rates of return, depreciation, currency conversions, and statistical functions.
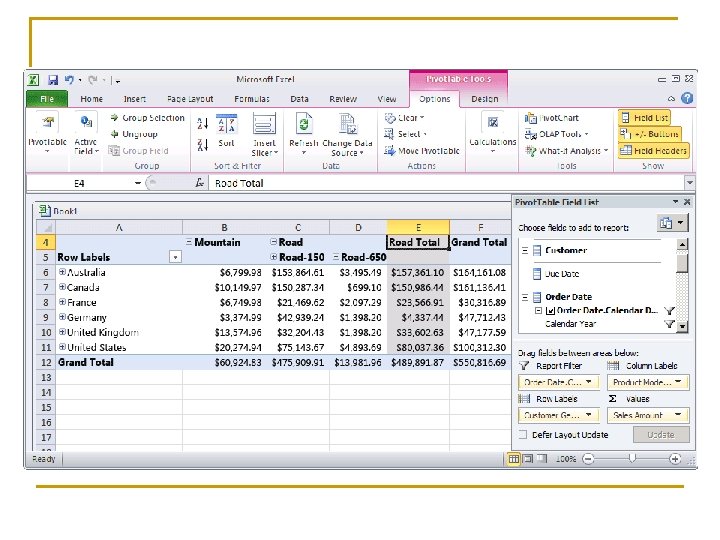
DEMO SSAS
DEMO SSRS
Bibliography n Randal Root, Caryn Mason, Pro SQL Server 2012 BI Solutions, APRESS 2012 n Brian Mc. Donald, Shawn Mc. Gehee, Rodney Landrum, Pro SQL Server 2012 Reporting Services, APRESS 2012 n Paul Turley, Robert Bruckner, Thiago Silva, Ken Withee, Grant Paisley, PROFESSIONAL Microsoft SQL Server 2012 Reporting Services, Wiley 2012