Descriptive Statistics 3 1 3 5 Chap 3
- Slides: 47
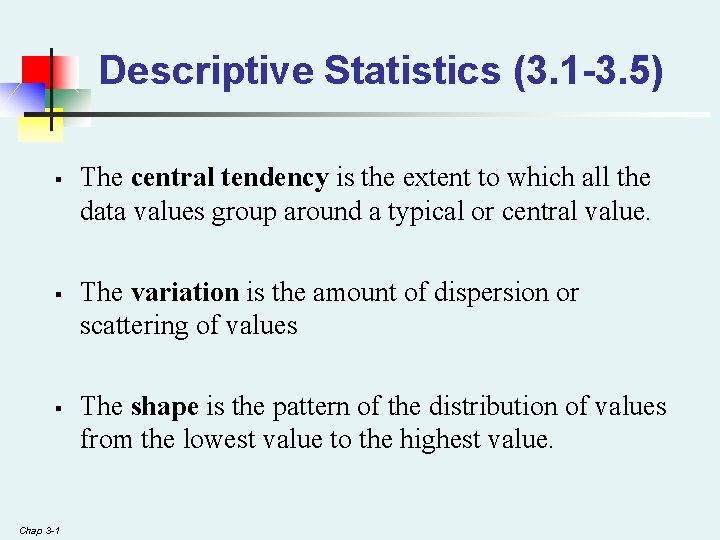
Descriptive Statistics (3. 1 -3. 5) § § § Chap 3 -1 The central tendency is the extent to which all the data values group around a typical or central value. The variation is the amount of dispersion or scattering of values The shape is the pattern of the distribution of values from the lowest value to the highest value.
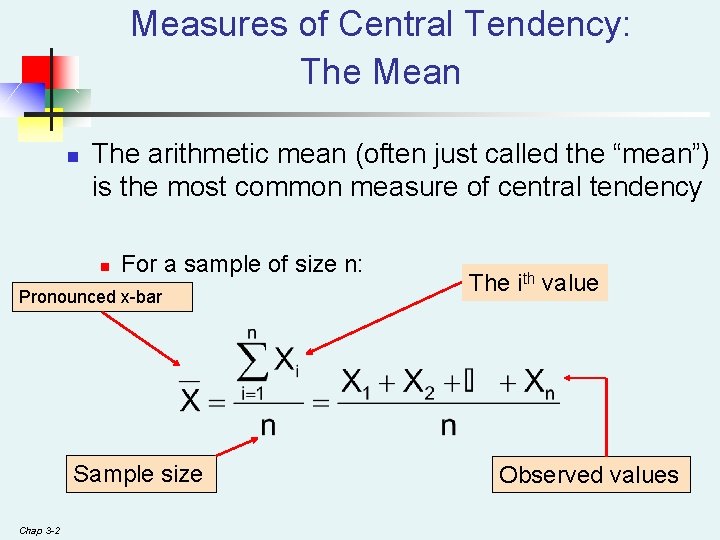
Measures of Central Tendency: The Mean n The arithmetic mean (often just called the “mean”) is the most common measure of central tendency n For a sample of size n: Pronounced x-bar Sample size Chap 3 -2 The ith value Observed values
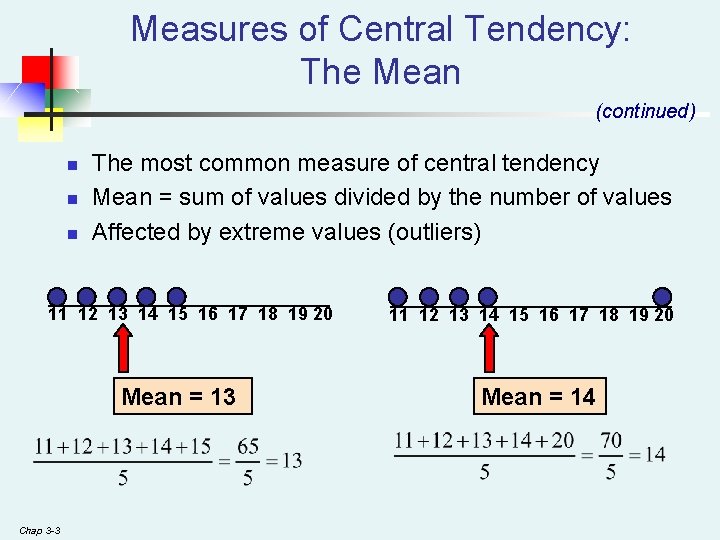
Measures of Central Tendency: The Mean (continued) n n n The most common measure of central tendency Mean = sum of values divided by the number of values Affected by extreme values (outliers) 11 12 13 14 15 16 17 18 19 20 Mean = 13 Chap 3 -3 11 12 13 14 15 16 17 18 19 20 Mean = 14
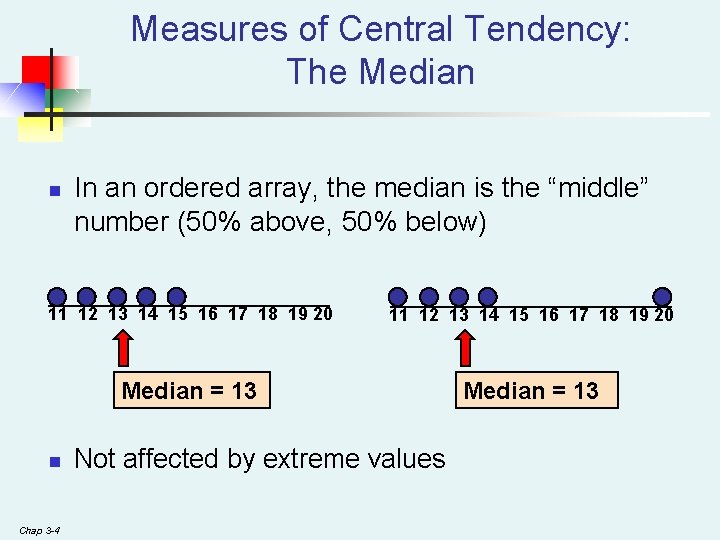
Measures of Central Tendency: The Median n In an ordered array, the median is the “middle” number (50% above, 50% below) 11 12 13 14 15 16 17 18 19 20 Median = 13 n Chap 3 -4 Not affected by extreme values
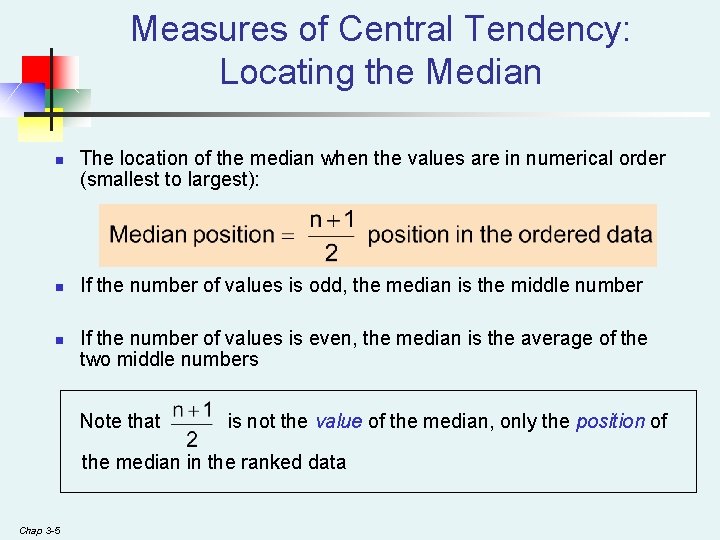
Measures of Central Tendency: Locating the Median n The location of the median when the values are in numerical order (smallest to largest): If the number of values is odd, the median is the middle number If the number of values is even, the median is the average of the two middle numbers Note that is not the value of the median, only the position of the median in the ranked data Chap 3 -5
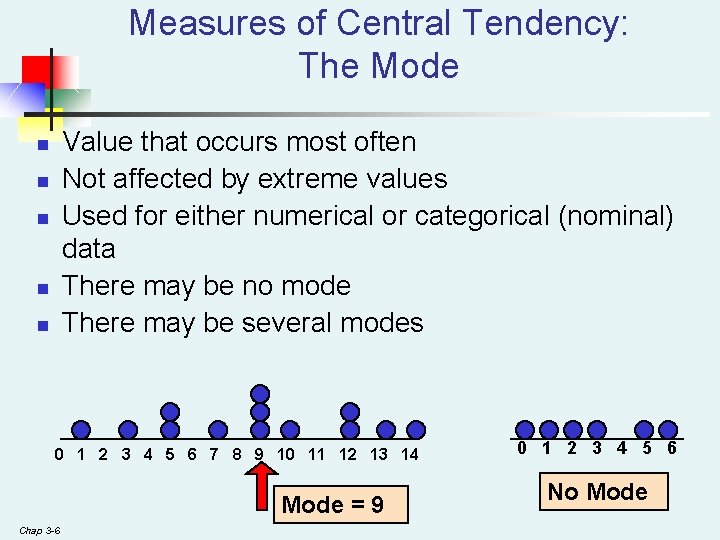
Measures of Central Tendency: The Mode Value that occurs most often Not affected by extreme values Used for either numerical or categorical (nominal) data There may be no mode There may be several modes n n n 0 1 2 3 4 5 6 7 8 9 10 11 12 13 14 Mode = 9 Chap 3 -6 0 1 2 3 4 5 6 No Mode
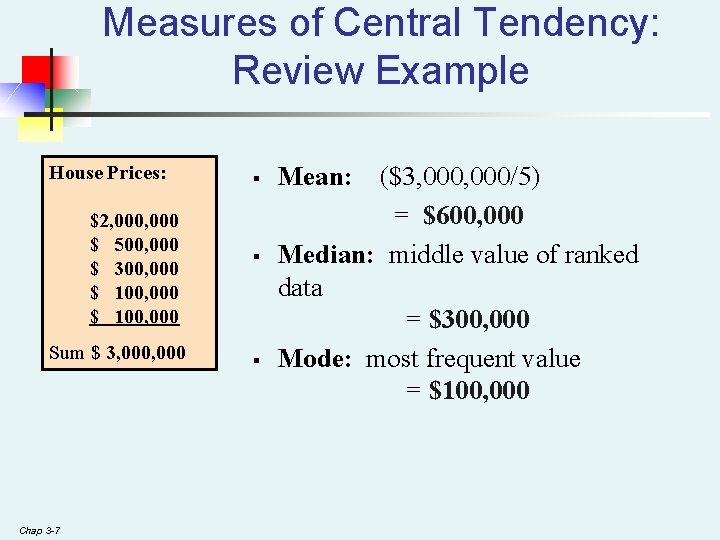
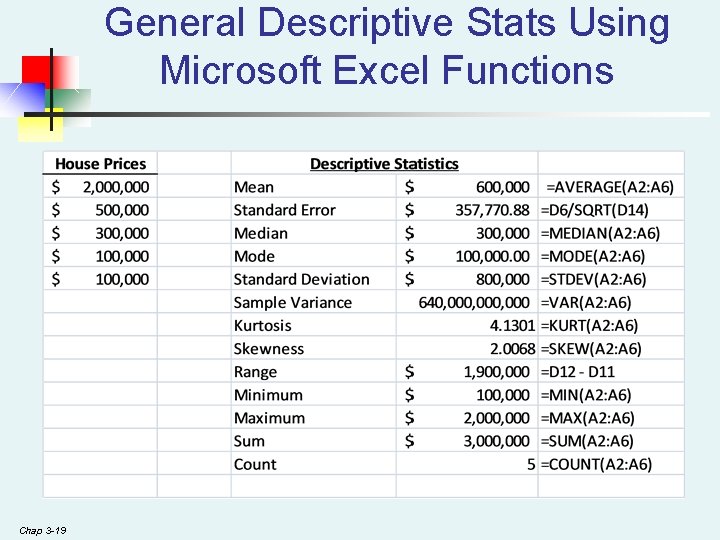
Measures of Central Tendency: Review Example House Prices: $2, 000 $ 500, 000 $ 300, 000 $ 100, 000 Sum $ 3, 000 Chap 3 -7 § § § Mean: ($3, 000/5) = $600, 000 Median: middle value of ranked data = $300, 000 Mode: most frequent value = $100, 000
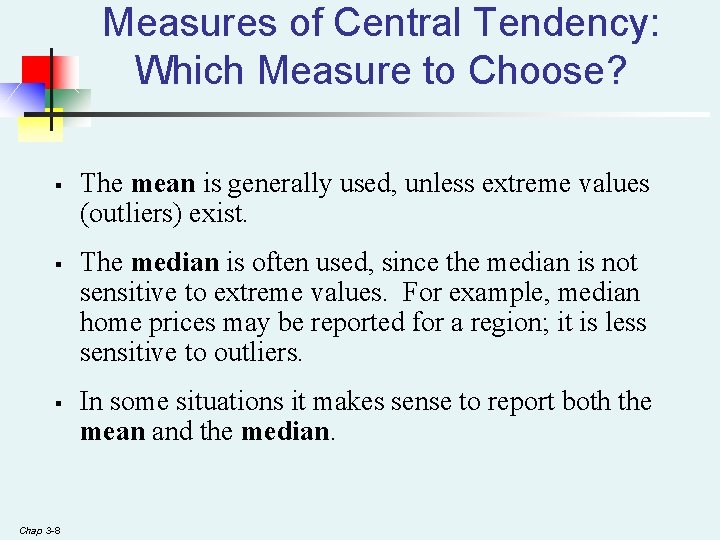
Measures of Central Tendency: Which Measure to Choose? § § § Chap 3 -8 The mean is generally used, unless extreme values (outliers) exist. The median is often used, since the median is not sensitive to extreme values. For example, median home prices may be reported for a region; it is less sensitive to outliers. In some situations it makes sense to report both the mean and the median.
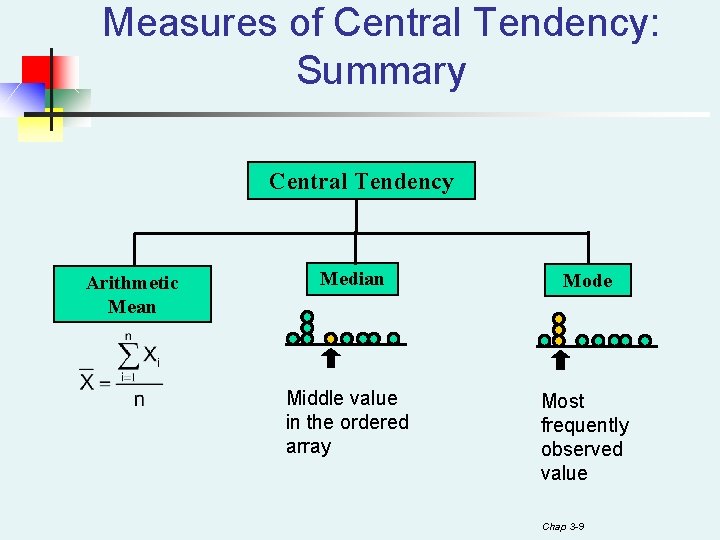
Measures of Central Tendency: Summary Central Tendency Arithmetic Mean Median Mode Middle value in the ordered array Most frequently observed value Chap 3 -9
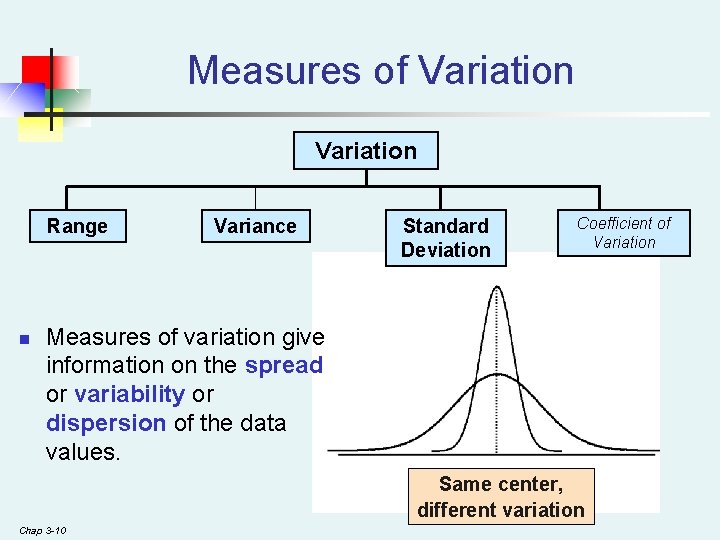
Measures of Variation Range n Variance Standard Deviation Coefficient of Variation Measures of variation give information on the spread or variability or dispersion of the data values. Same center, different variation Chap 3 -10
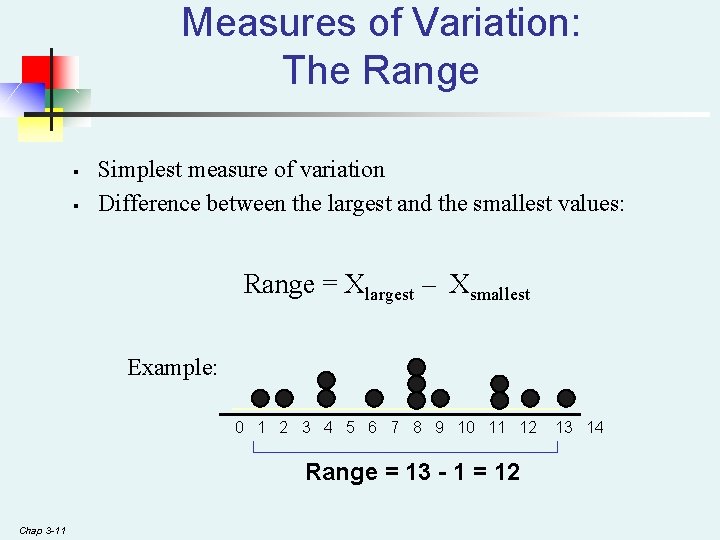
Measures of Variation: The Range § § Simplest measure of variation Difference between the largest and the smallest values: Range = Xlargest – Xsmallest Example: 0 1 2 3 4 5 6 7 8 9 10 11 12 Range = 13 - 1 = 12 Chap 3 -11 13 14
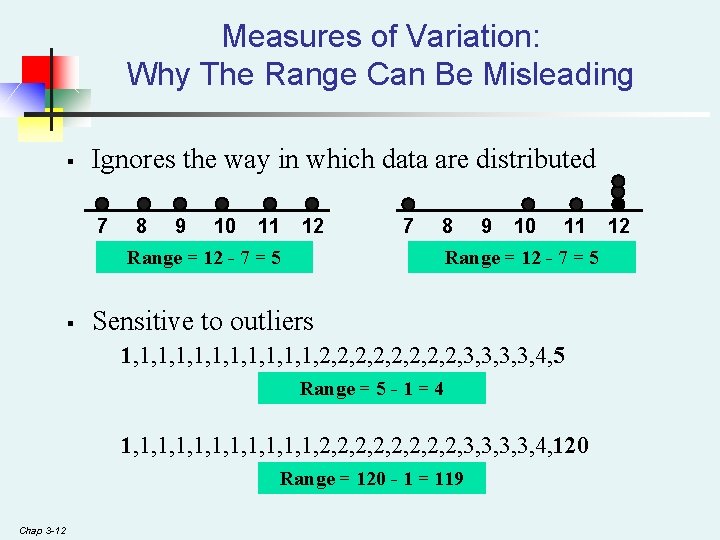
Measures of Variation: Why The Range Can Be Misleading § Ignores the way in which data are distributed 7 8 9 10 11 12 7 8 Range = 12 - 7 = 5 § 9 10 11 Range = 12 - 7 = 5 Sensitive to outliers 1, 1, 1, 2, 2, 3, 3, 4, 5 Range = 5 - 1 = 4 1, 1, 1, 2, 2, 3, 3, 4, 120 Range = 120 - 1 = 119 Chap 3 -12 12
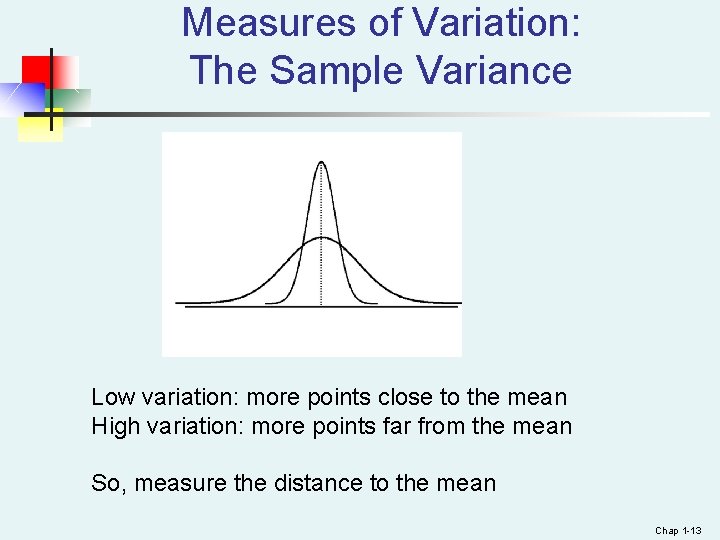
Measures of Variation: The Sample Variance Low variation: more points close to the mean High variation: more points far from the mean So, measure the distance to the mean Chap 1 -13
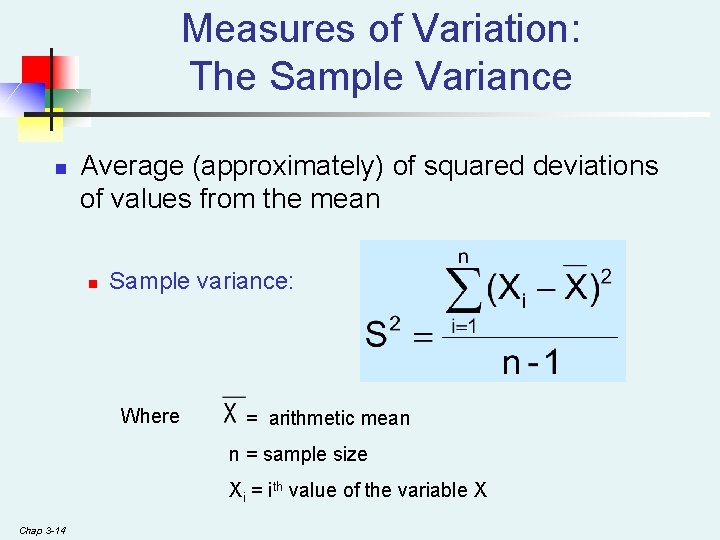
Measures of Variation: The Sample Variance n Average (approximately) of squared deviations of values from the mean n Sample variance: Where = arithmetic mean n = sample size Xi = ith value of the variable X Chap 3 -14
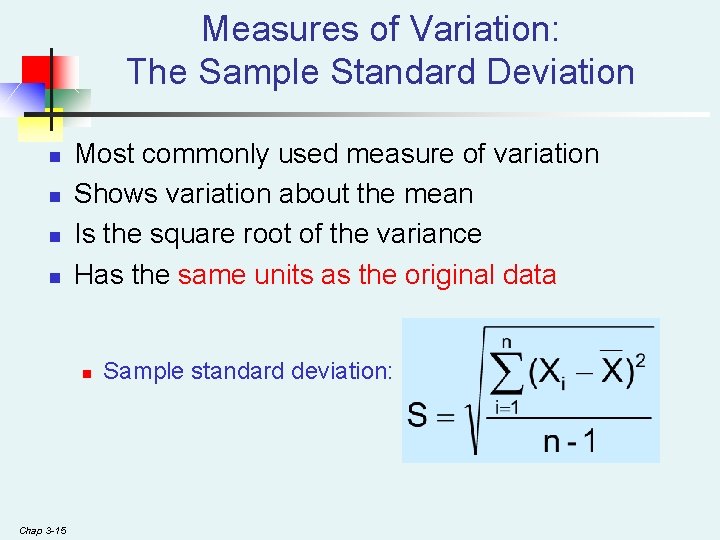
Measures of Variation: The Sample Standard Deviation n n Most commonly used measure of variation Shows variation about the mean Is the square root of the variance Has the same units as the original data n Chap 3 -15 Sample standard deviation:
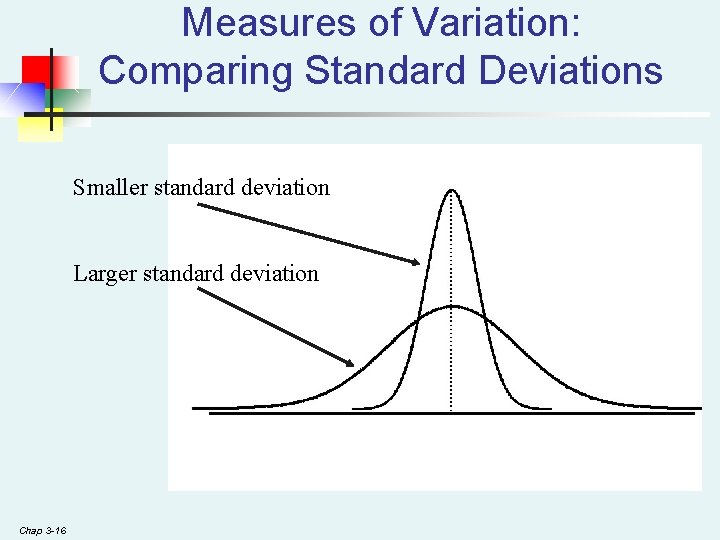
Measures of Variation: Comparing Standard Deviations Smaller standard deviation Larger standard deviation Chap 3 -16
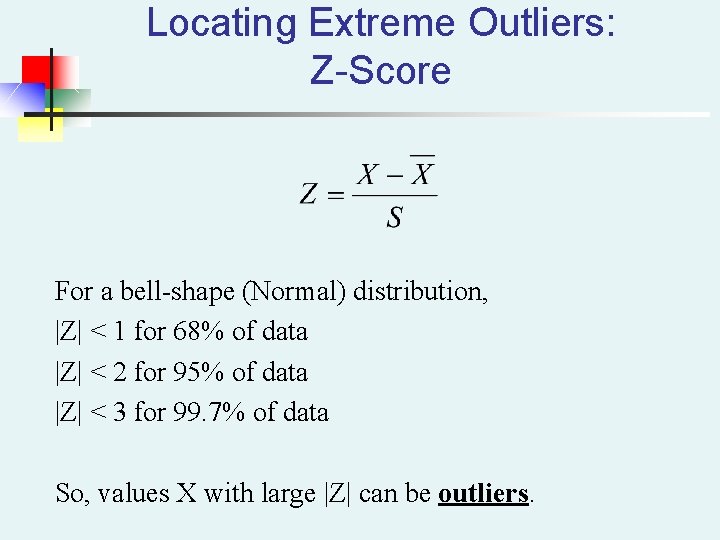
Locating Extreme Outliers: Z-Score For a bell-shape (Normal) distribution, |Z| < 1 for 68% of data |Z| < 2 for 95% of data |Z| < 3 for 99. 7% of data So, values X with large |Z| can be outliers.
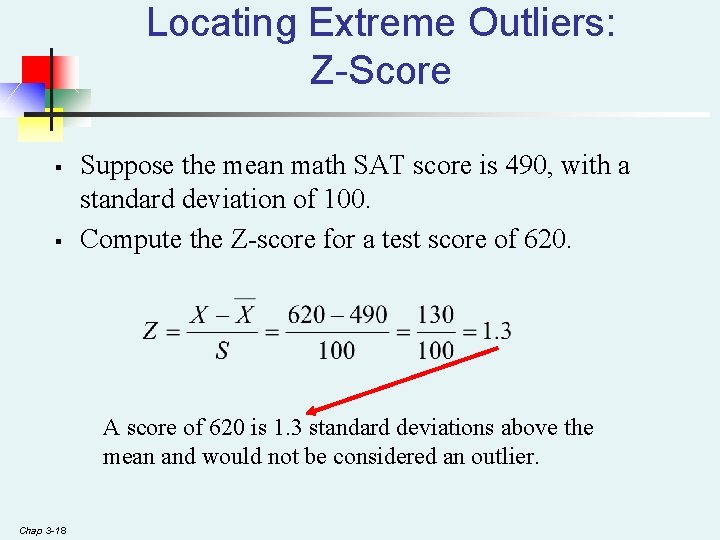
Locating Extreme Outliers: Z-Score § § Suppose the mean math SAT score is 490, with a standard deviation of 100. Compute the Z-score for a test score of 620. A score of 620 is 1. 3 standard deviations above the mean and would not be considered an outlier. Chap 3 -18
General Descriptive Stats Using Microsoft Excel Functions Chap 3 -19
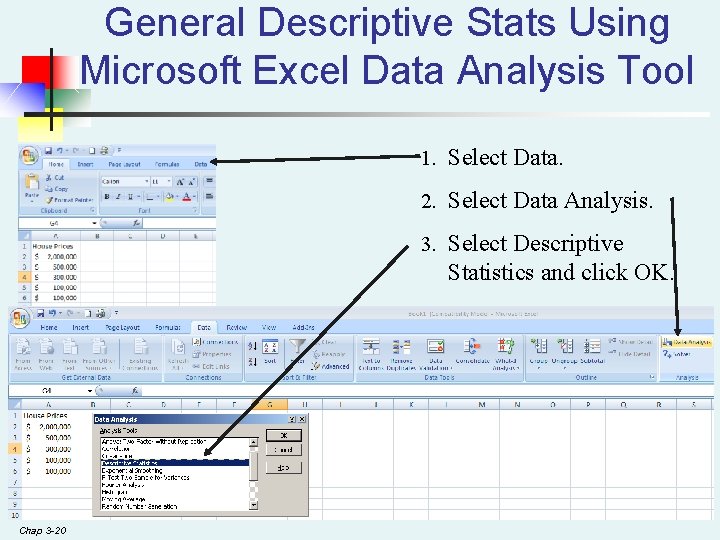
General Descriptive Stats Using Microsoft Excel Data Analysis Tool 1. Select Data. 2. Select Data Analysis. 3. Select Descriptive Statistics and click OK. Chap 3 -20
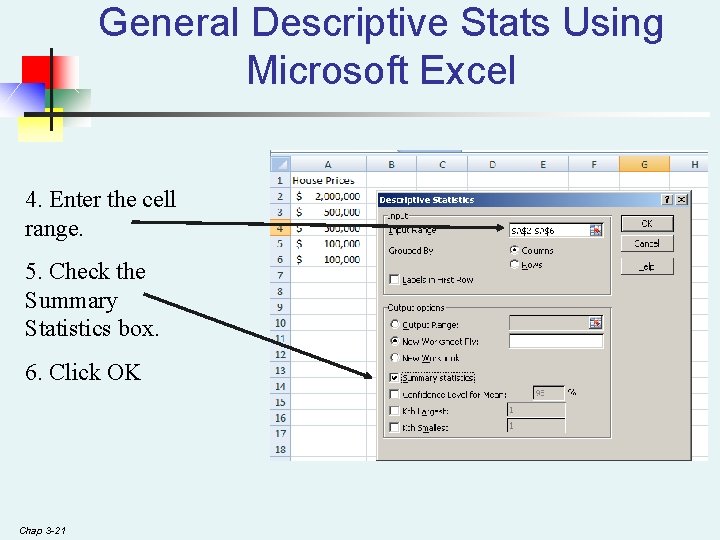
General Descriptive Stats Using Microsoft Excel 4. Enter the cell range. 5. Check the Summary Statistics box. 6. Click OK Chap 3 -21
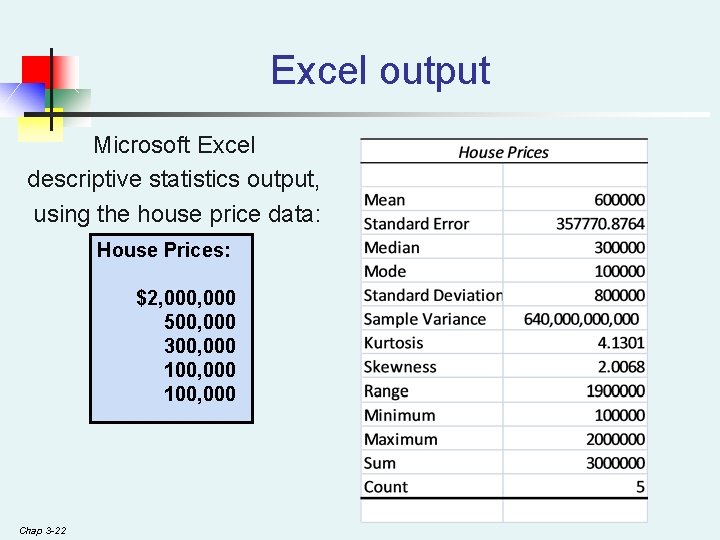
Excel output Microsoft Excel descriptive statistics output, using the house price data: House Prices: $2, 000 500, 000 300, 000 100, 000 Chap 3 -22
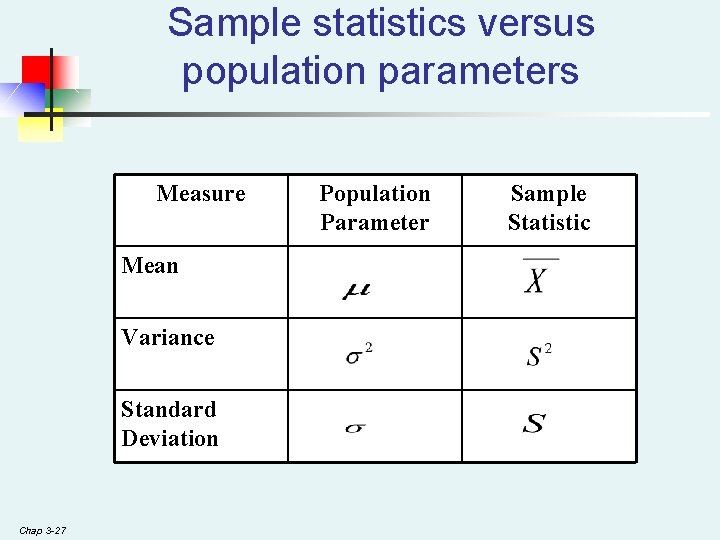
Numerical Descriptive Measures for a Population § § § Chap 3 -23 Descriptive statistics discussed previously described a sample, not the population. Summary measures describing a population, called parameters, are denoted with Greek letters. Important population parameters are the population mean, variance, and standard deviation.
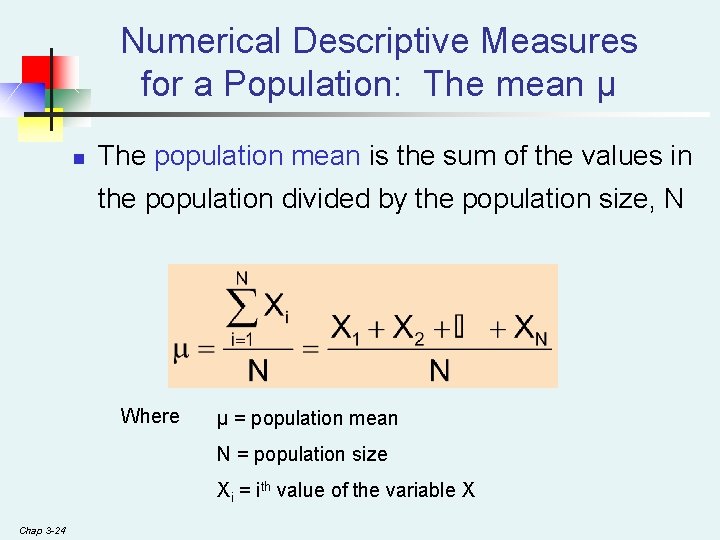
Numerical Descriptive Measures for a Population: The mean µ n The population mean is the sum of the values in the population divided by the population size, N Where μ = population mean N = population size Xi = ith value of the variable X Chap 3 -24
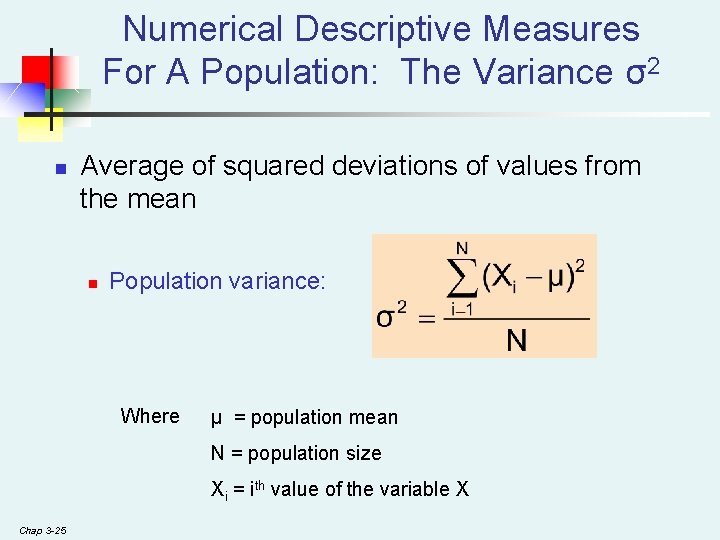
Numerical Descriptive Measures For A Population: The Variance σ2 n Average of squared deviations of values from the mean n Population variance: Where μ = population mean N = population size Xi = ith value of the variable X Chap 3 -25
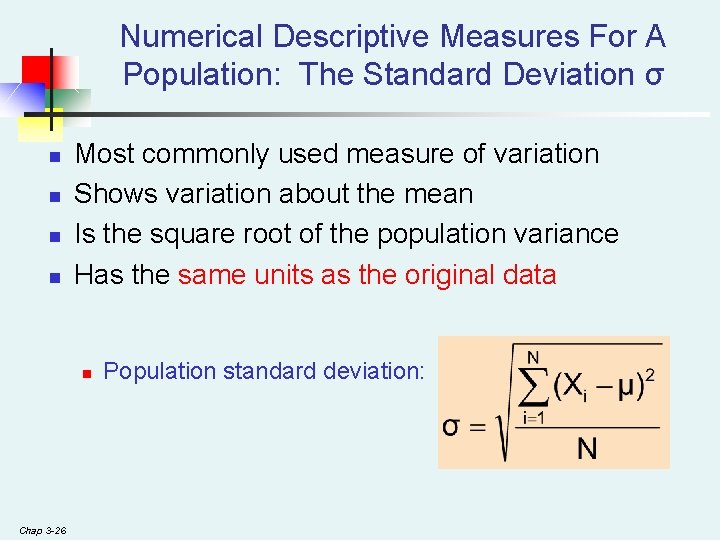
Numerical Descriptive Measures For A Population: The Standard Deviation σ n n Most commonly used measure of variation Shows variation about the mean Is the square root of the population variance Has the same units as the original data n Chap 3 -26 Population standard deviation:
Sample statistics versus population parameters Measure Mean Variance Standard Deviation Chap 3 -27 Population Parameter Sample Statistic
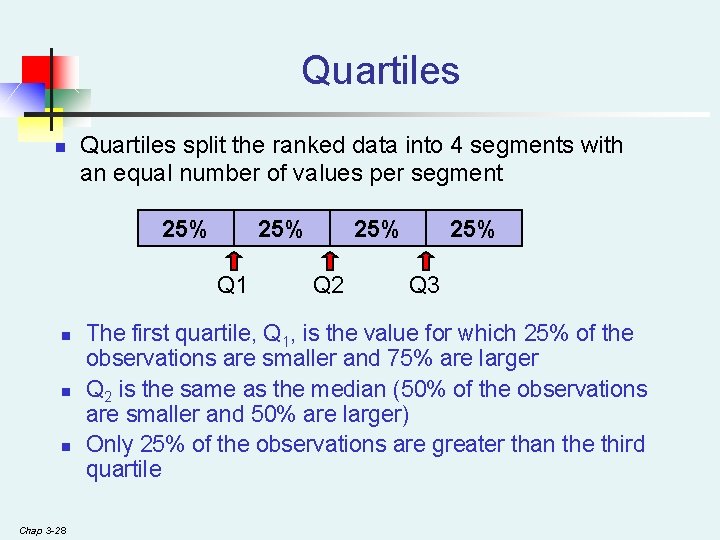
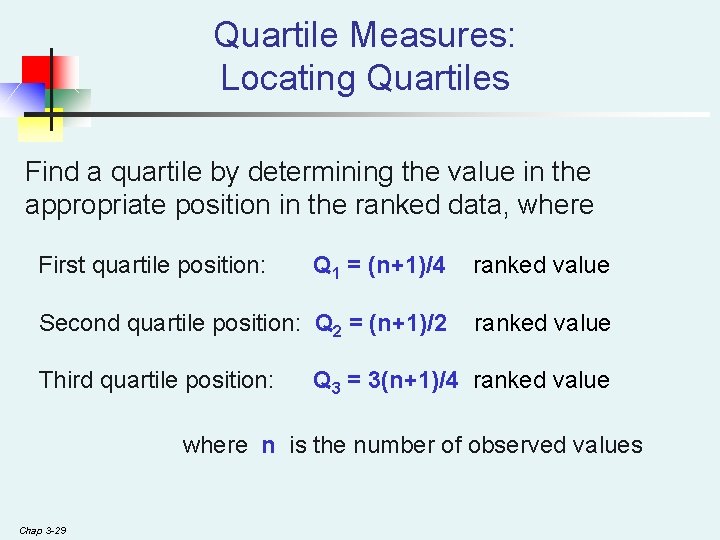
Quartiles n Quartiles split the ranked data into 4 segments with an equal number of values per segment 25% Q 1 n n n Chap 3 -28 25% Q 2 25% Q 3 The first quartile, Q 1, is the value for which 25% of the observations are smaller and 75% are larger Q 2 is the same as the median (50% of the observations are smaller and 50% are larger) Only 25% of the observations are greater than the third quartile
Quartile Measures: Locating Quartiles Find a quartile by determining the value in the appropriate position in the ranked data, where First quartile position: Q 1 = (n+1)/4 ranked value Second quartile position: Q 2 = (n+1)/2 ranked value Third quartile position: Q 3 = 3(n+1)/4 ranked value where n is the number of observed values Chap 3 -29
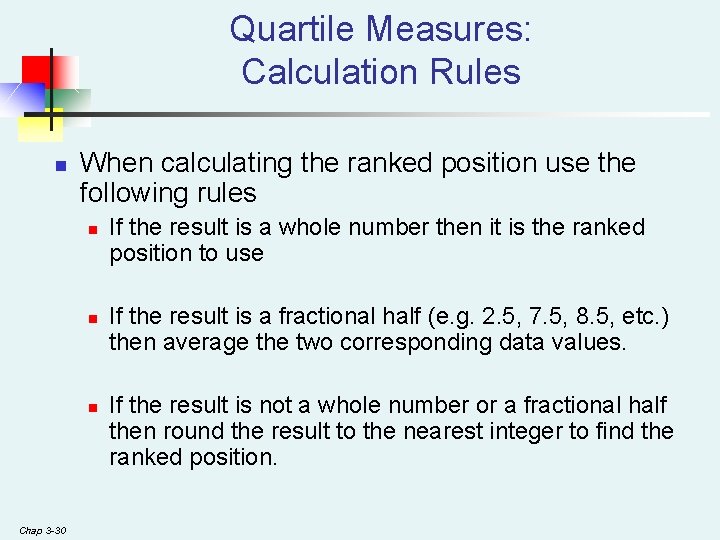
Quartile Measures: Calculation Rules n When calculating the ranked position use the following rules n n n Chap 3 -30 If the result is a whole number then it is the ranked position to use If the result is a fractional half (e. g. 2. 5, 7. 5, 8. 5, etc. ) then average the two corresponding data values. If the result is not a whole number or a fractional half then round the result to the nearest integer to find the ranked position.
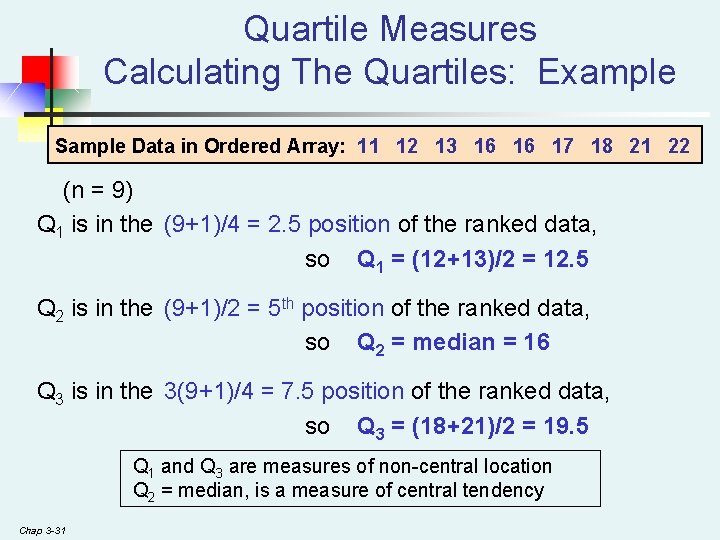
Quartile Measures Calculating The Quartiles: Example Sample Data in Ordered Array: 11 12 13 16 16 17 18 21 22 (n = 9) Q 1 is in the (9+1)/4 = 2. 5 position of the ranked data, so Q 1 = (12+13)/2 = 12. 5 Q 2 is in the (9+1)/2 = 5 th position of the ranked data, so Q 2 = median = 16 Q 3 is in the 3(9+1)/4 = 7. 5 position of the ranked data, so Q 3 = (18+21)/2 = 19. 5 Q 1 and Q 3 are measures of non-central location Q 2 = median, is a measure of central tendency Chap 3 -31
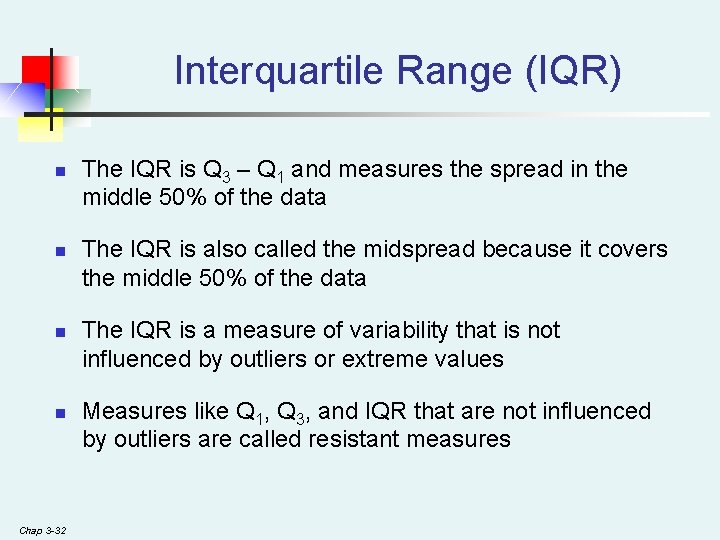
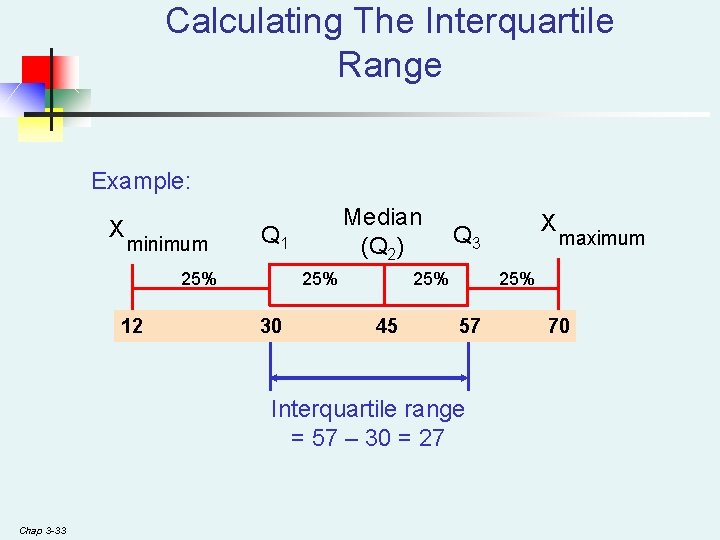
Interquartile Range (IQR) n n Chap 3 -32 The IQR is Q 3 – Q 1 and measures the spread in the middle 50% of the data The IQR is also called the midspread because it covers the middle 50% of the data The IQR is a measure of variability that is not influenced by outliers or extreme values Measures like Q 1, Q 3, and IQR that are not influenced by outliers are called resistant measures
Calculating The Interquartile Range Example: X minimum Q 1 25% 12 Median (Q 2) 25% 30 25% 45 maximum 25% 57 Interquartile range = 57 – 30 = 27 Chap 3 -33 X Q 3 70
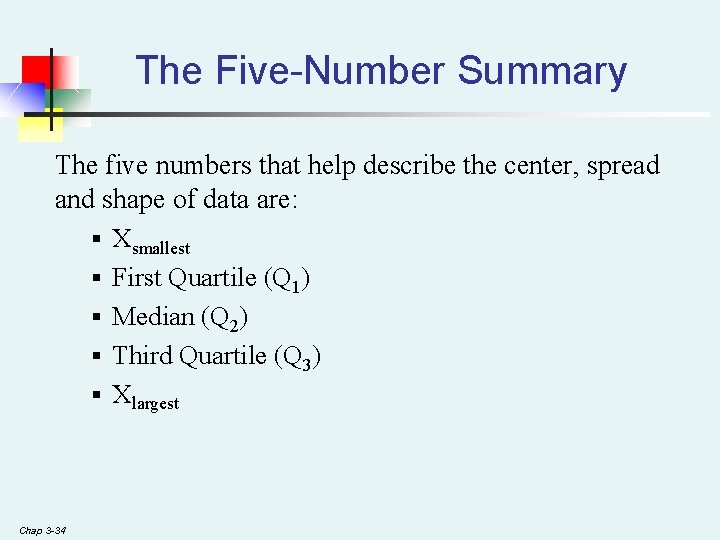
The Five-Number Summary The five numbers that help describe the center, spread and shape of data are: § Xsmallest § First Quartile (Q 1) § Median (Q 2) § Third Quartile (Q 3) § Xlargest Chap 3 -34
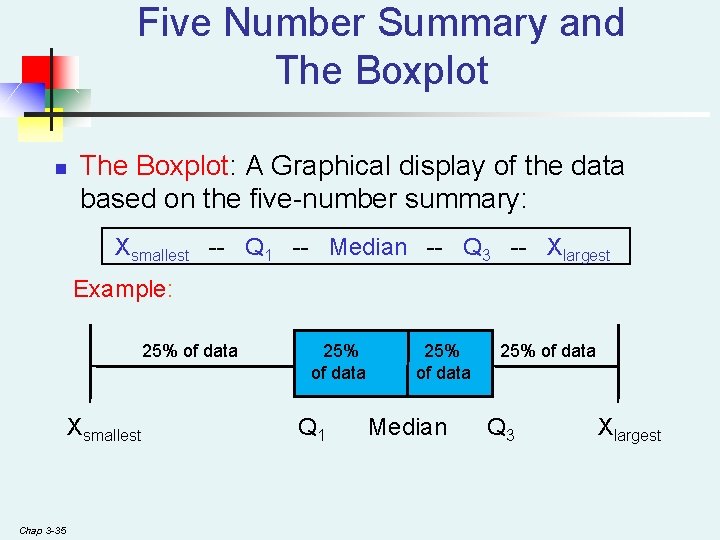
Five Number Summary and The Boxplot n The Boxplot: A Graphical display of the data based on the five-number summary: Xsmallest -- Q 1 -- Median -- Q 3 -- Xlargest Example: 25% of data Xsmallest Chap 3 -35 25% of data Q 1 25% of data Median 25% of data Q 3 Xlargest
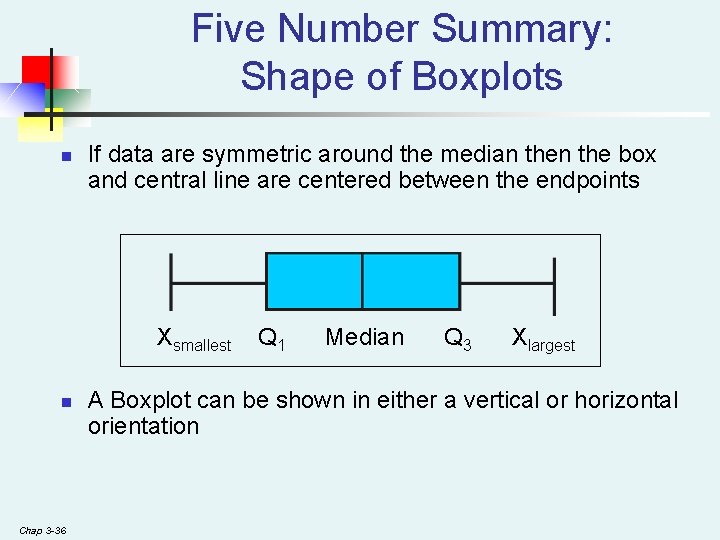
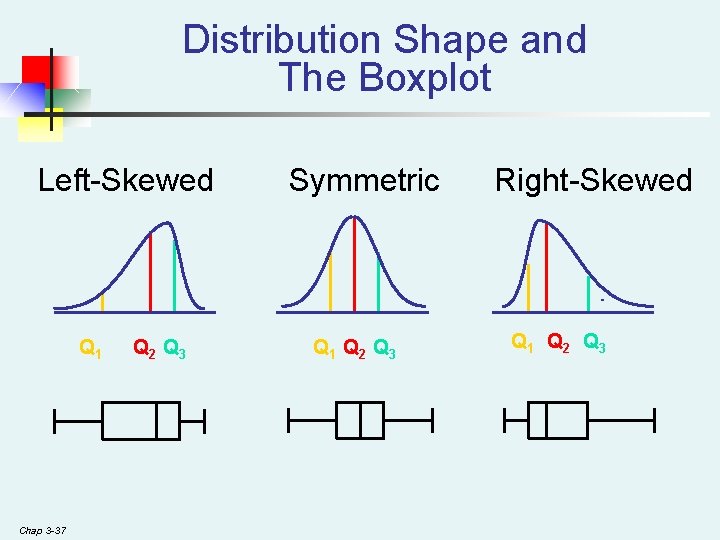
Five Number Summary: Shape of Boxplots n If data are symmetric around the median the box and central line are centered between the endpoints Xsmallest n Chap 3 -36 Q 1 Median Q 3 Xlargest A Boxplot can be shown in either a vertical or horizontal orientation
Distribution Shape and The Boxplot Left-Skewed Q 1 Chap 3 -37 Q 2 Q 3 Symmetric Q 1 Q 2 Q 3 Right-Skewed Q 1 Q 2 Q 3
Measures Of The Relationship Between Two Numerical Variables n n n Chap 3 -38 Scatter plots allow you to visually examine the relationship between two numerical variables and now we will discuss two quantitative measures of such relationships. The Covariance The Coefficient of Correlation
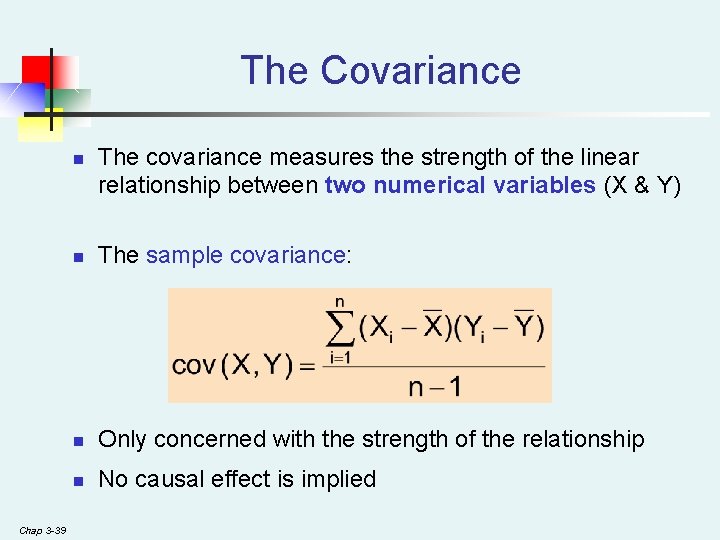
The Covariance n Chap 3 -39 The covariance measures the strength of the linear relationship between two numerical variables (X & Y) n The sample covariance: n Only concerned with the strength of the relationship n No causal effect is implied
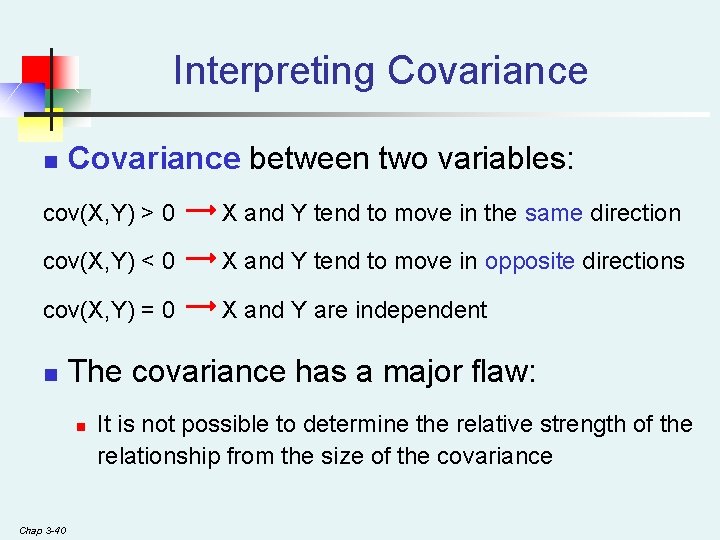
Interpreting Covariance n Covariance between two variables: cov(X, Y) > 0 X and Y tend to move in the same direction cov(X, Y) < 0 X and Y tend to move in opposite directions cov(X, Y) = 0 X and Y are independent n The covariance has a major flaw: n Chap 3 -40 It is not possible to determine the relative strength of the relationship from the size of the covariance
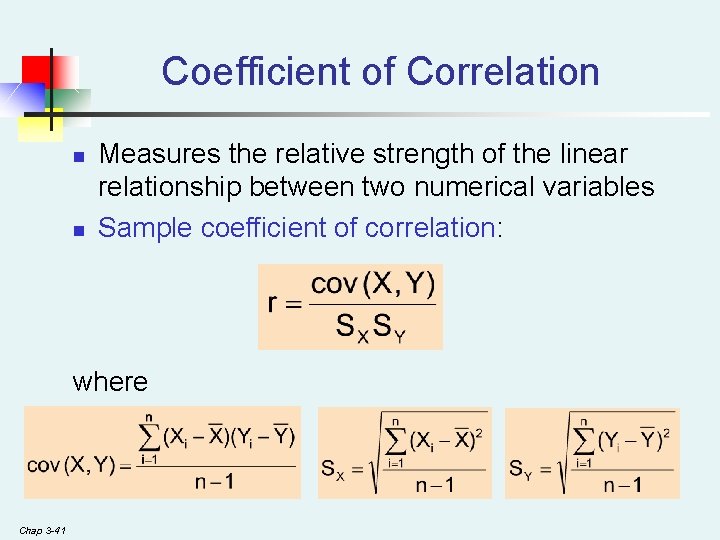
Coefficient of Correlation n n Measures the relative strength of the linear relationship between two numerical variables Sample coefficient of correlation: where Chap 3 -41
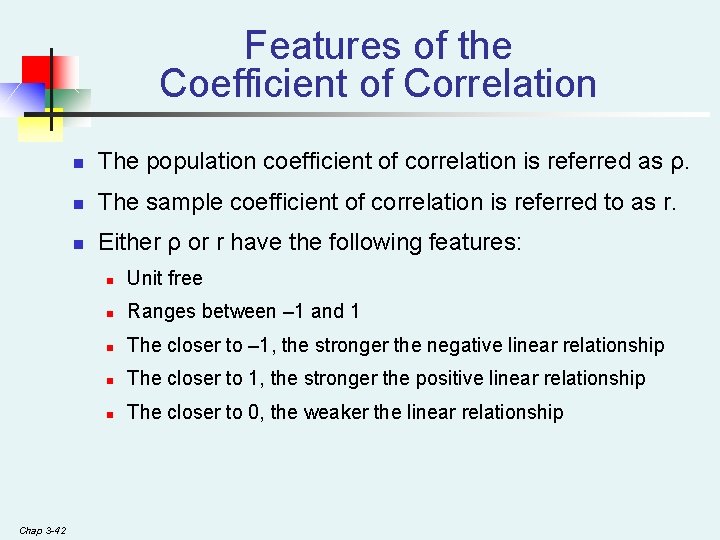
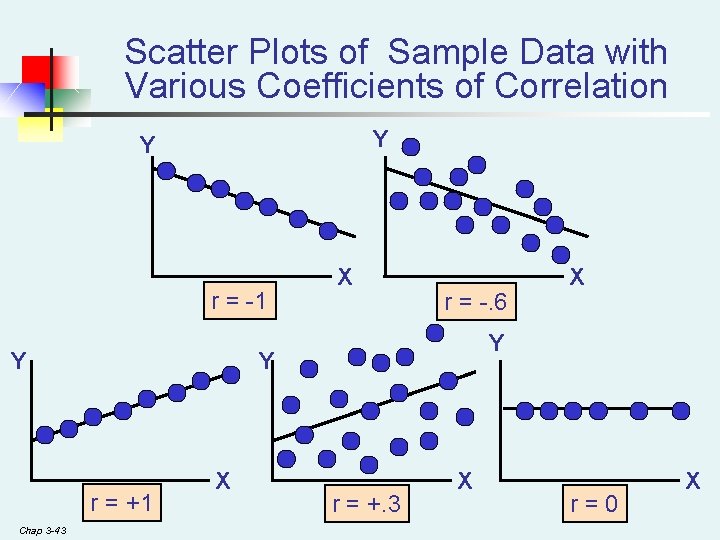
Features of the Coefficient of Correlation Chap 3 -42 n The population coefficient of correlation is referred as ρ. n The sample coefficient of correlation is referred to as r. n Either ρ or r have the following features: n Unit free n Ranges between – 1 and 1 n The closer to – 1, the stronger the negative linear relationship n The closer to 1, the stronger the positive linear relationship n The closer to 0, the weaker the linear relationship
Scatter Plots of Sample Data with Various Coefficients of Correlation Y Y r = -1 Y r = -. 6 X X Y Y r = +1 Chap 3 -43 X r = +. 3 X r=0 X
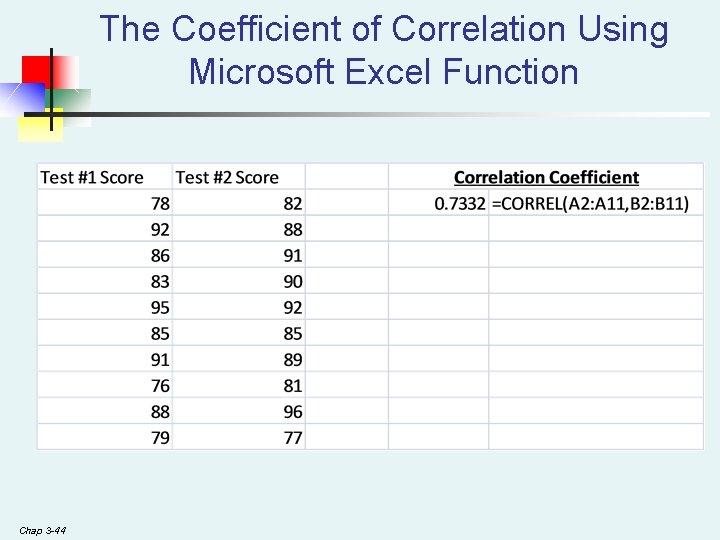
The Coefficient of Correlation Using Microsoft Excel Function Chap 3 -44
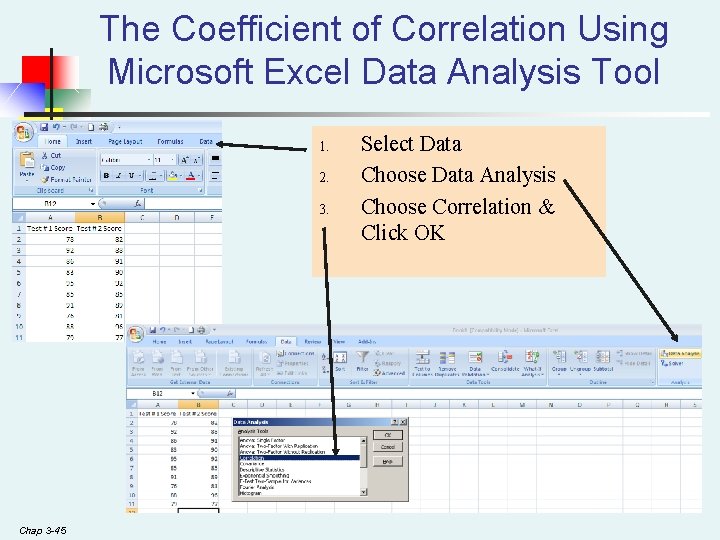
The Coefficient of Correlation Using Microsoft Excel Data Analysis Tool 1. 2. 3. Chap 3 -45 Select Data Choose Data Analysis Choose Correlation & Click OK
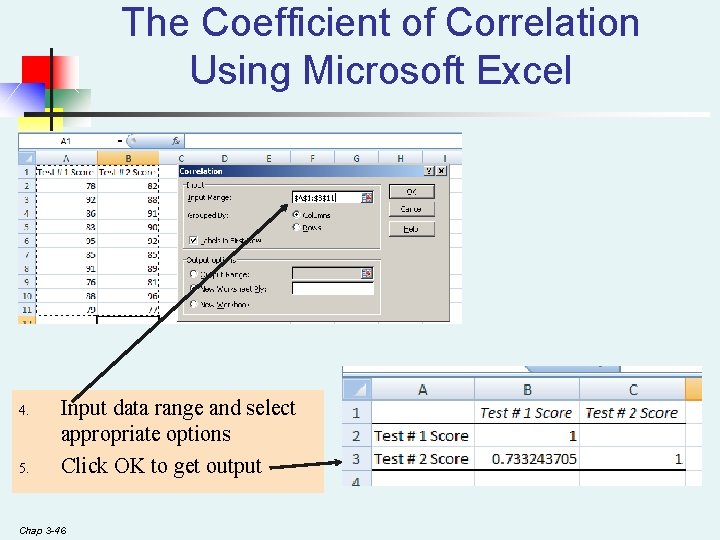
The Coefficient of Correlation Using Microsoft Excel 4. 5. Input data range and select appropriate options Click OK to get output Chap 3 -46
Excel function: =correl Or use the Data Analysis Tool, “covariance” and “correlation”. Chap 1 -47