1 3 Psychology Statistics AP Psychology Descriptive Statistics


 Find the mean of the data. b) Subtract")


")
")

- Slides: 39
1. 3 Psychology Statistics AP Psychology
Descriptive Statistics • Definition… • Describe a set of data • Measures of Central Tendency • Measures of Variation • Skewed Distributions
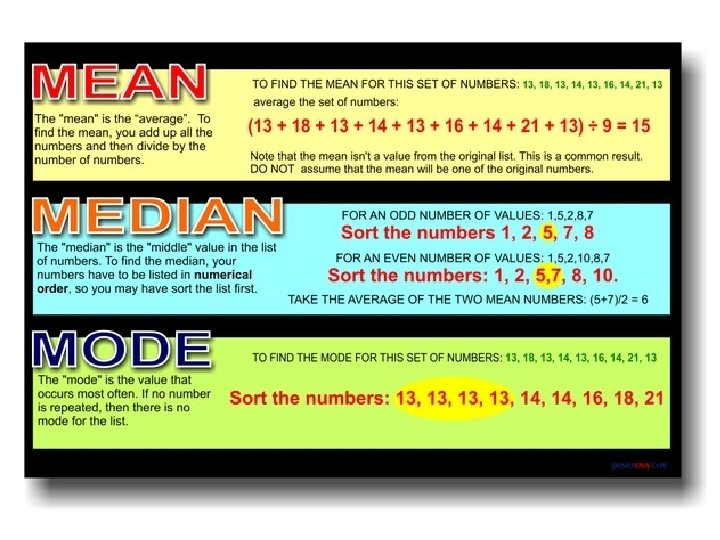
Measures of Central Tendency • Mean – Average score – Extreme scores have a greater impact on the mean than on the mode or median • Median – Score that divides a frequency distribution exactly in half, so that the same number of scores lie on each side (middle) • Mode – Most frequently occurring score (bimodal)
Measures of Variation • Definition – Measure of variation in a single score that presents info about the spread of scores in a variation • Range – highest minus the lowest • Standard Deviation – a standard measurement of how much the scores in a distribution deviate from the mean – The most widely used measure of variation • Z-score (standard score) – the distance of a score from the mean in units of standard deviation
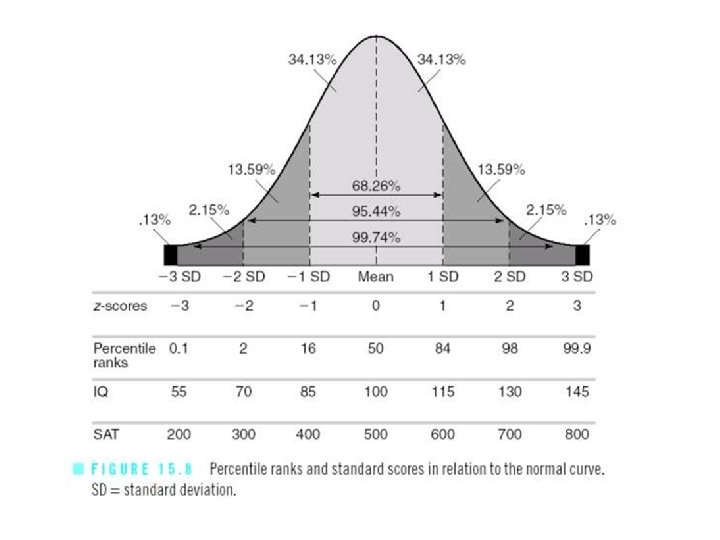
Normal Distribution • Form a bell-shaped or symmetrical curve
Normal Distribution • The percentage of scores that fall at or above the mean is 50…the percentage that fall below (or at) the mean is also 50
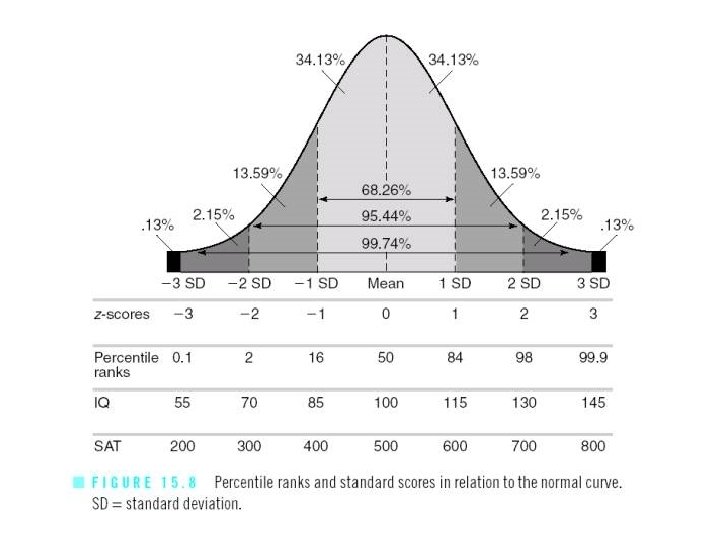
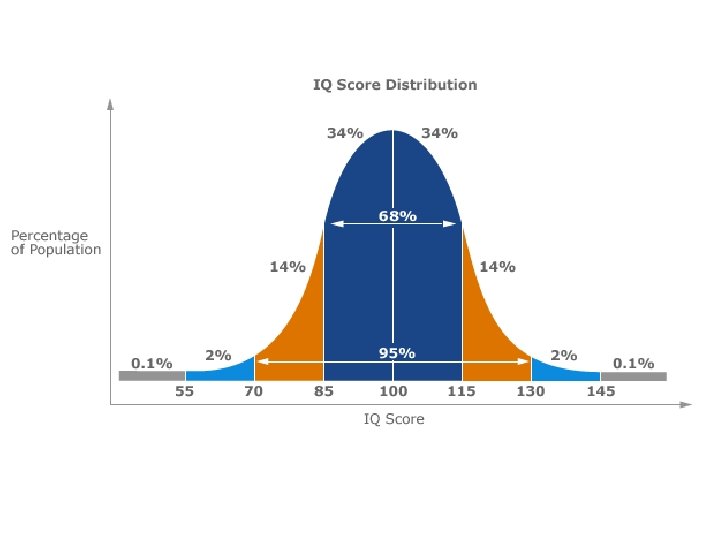
Normal Distribution • One-third of the scores fall one standard deviation below the mean and one-third fall one standard deviation above the mean • Example…Wechsler IQ Tests – Mean = 100 / Standard Deviation = 15 – One-third score 85 -100 – Another third score 100 -115
68 -95 -99. 7 Rule • 68% of scores fall within one SD • 95% of scores fall within two SD • 99. 7% of scores fall within three SD
Percentile • Distance of a score from “ 0” • Examples – 90 th percentile – score better than 90% – 38 th percentile – score better than 38%
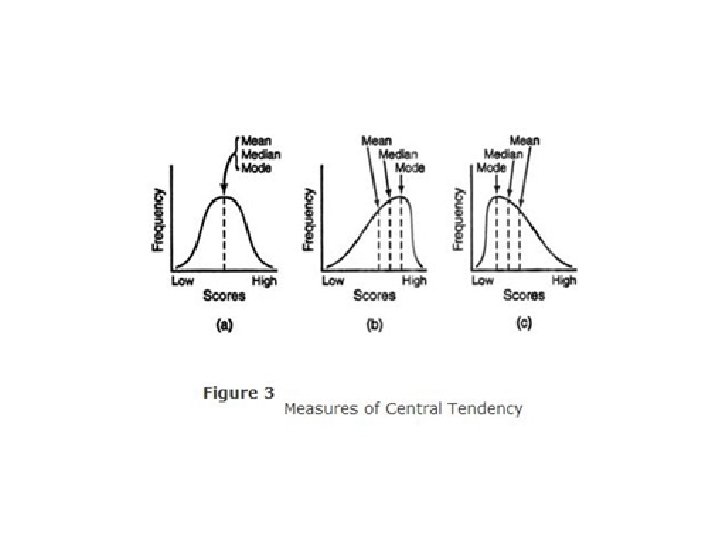
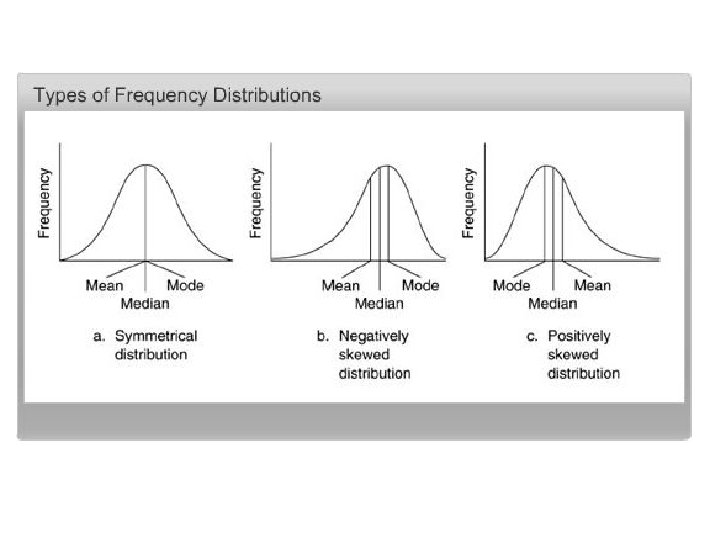
Skewed Distributions
Skewed Distributions • Positively Skewed Distributions • Contain a preponderance of scores on the low end of the scale (looks like “P” lying on back • Mean is higher than the median – Thus the median is a better representation of central tendency in positively skewed distributions
Skewed Distributions • Negatively Skewed Distributions • Contain a preponderance of scores on the high end of the scale • Mean is lower than median – Thus the median is a better representation of central tendency in a negatively skewed distribution
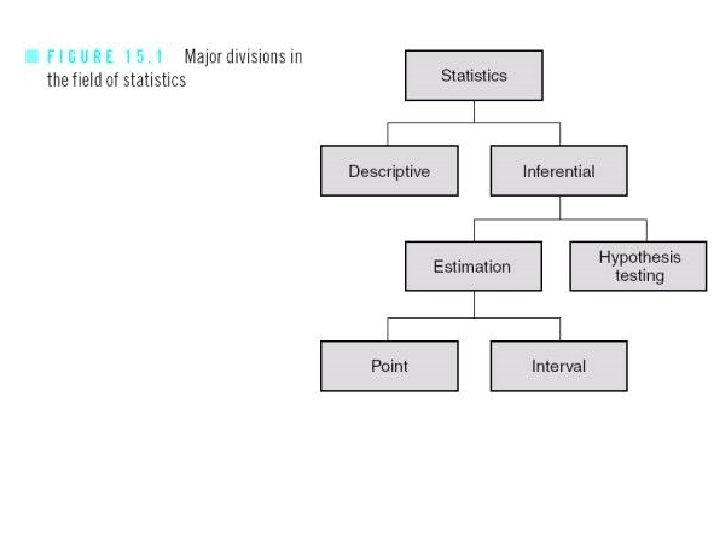
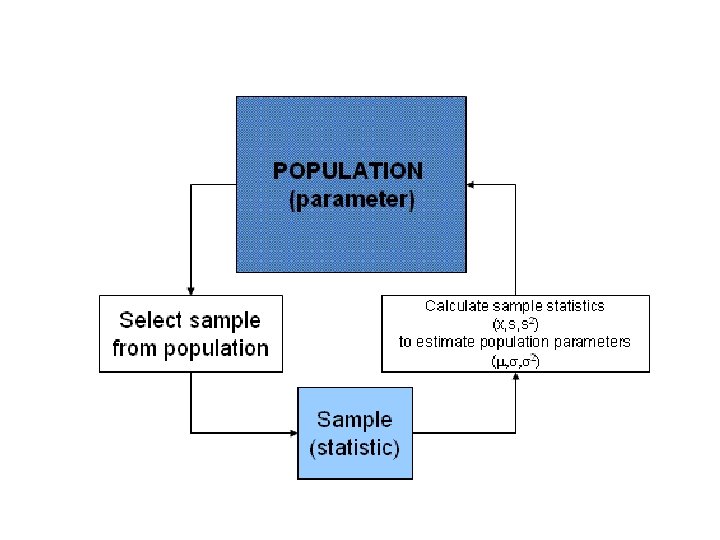
Inferential Statistics • Key points… • Most experiments are conducted with a small sample of subjects • Psychologists want to generalize the results from their small sample to a larger population • IS are used to determine how likely it is that a study’s outcome is due to chance and whether the outcome can be legitimately generalized to the larger population from the sample selected
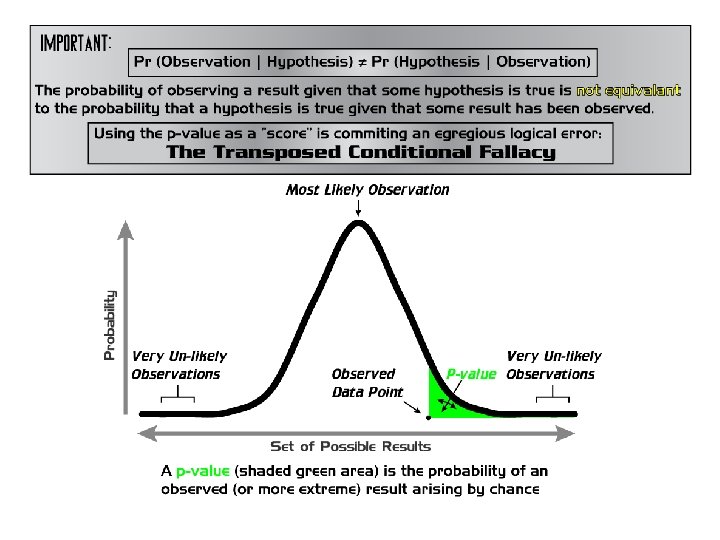
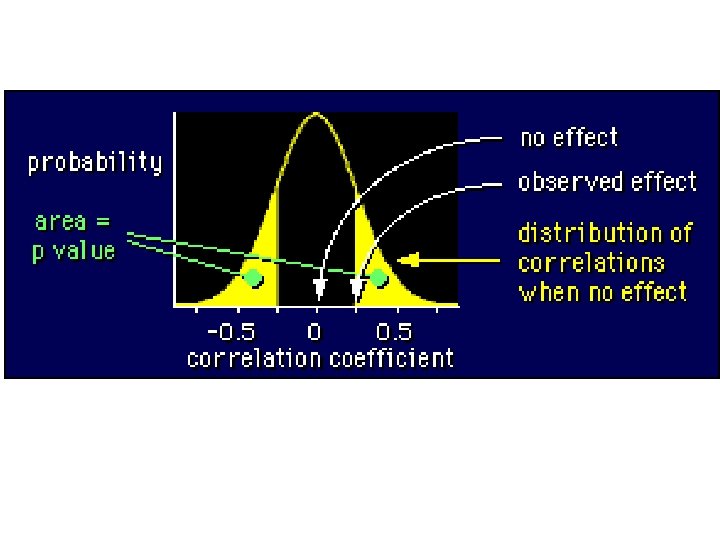
The P-Value • Probability of concluding that a difference exists when in fact this difference does not exist • A statistically significant difference is a difference not likely due to chance (shows up 5% of the time or less) • Smaller the p-value, the more significant the results • Can never be “ 0” (researchers can never be 100% certain the results did not occur by chance)
Standard Deviation Find the variance. a) Find the mean of the data. b) Subtract the mean from each value. c) Square each deviation of the mean. d) Find the sum of the squares. e) Divide the total by the number of items. Take the square root of the variance.
Standard Deviation Formula The standard deviation formula can be represented using Sigma Notation: Notice the standard deviation formula is the square root of the variance.
Find the variance and standard deviation The math test scores of five students are: 92, 88, 80, 68 and 52. 1) Find the mean: (92+88+80+68+52)/5 = 76. 2) Find the deviation from the mean: 92 -76=16 88 -76=12 80 -76=4 68 -76= -8 52 -76= -24
Find the variance and standard deviation The math test scores of five students are: 92, 88, 80, 68 and 52. 3) Square the deviation from the mean:
Find the variance and standard deviation The math test scores of five students are: 92, 88, 80, 68 and 52. 4) Find the sum of the squares of the deviation from the mean: 256+144+16+64+576= 1056 5) Divide by the number of data items to find the variance: 1056/5 = 211. 2
Find the variance and standard deviation The math test scores of five students are: 92, 88, 80, 68 and 52. 6) Find the square root of the variance: Thus the standard deviation of the test scores is 14. 53.
Standard Deviation A different math class took the same test with these five test scores: 92, 92, 52. Find the standard deviation for this class.
Hint: 1. Find the mean of the data. 2. Subtract the mean from each value – called the deviation from the mean. 3. Square each deviation of the mean. 4. Find the sum of the squares. 5. Divide the total by the number of items – result is the variance. 6. Take the square root of the variance – result is the standard deviation.
Solve: A different math class took the same test with these five test scores: 92, 92, 52. Find the standard deviation for this class.
The math test scores of five students are: 92, 92, 52 and 52. 1) Find the mean: (92+92+92+52+52)/5 = 76 2) Find the deviation from the mean: 92 -76=16 52 -76= -24 3) Square the deviation from the mean: 4) Find the sum of the squares: 256+256+576= 1920
The math test scores of five students are: 92, 92, 52 and 52. 5) Divide the sum of the squares by the number of items : 1920/5 = 384 variance 6) Find the square root of the variance: Thus the standard deviation of the second set of test scores is 19. 6.
Analyzing the data: Consider both sets of scores. Both classes have the same mean, 76. However, each class does not have the same scores. Thus we use the standard deviation to show the variation in the scores. With a standard variation of 14. 53 for the first class and 19. 6 for the second class, what does this tell us?